
 ?Mathematical formulae have been encoded as MathML and are displayed in this HTML version using MathJax in order to improve their display. Uncheck the box to turn MathJax off. This feature requires Javascript. Click on a formula to zoom.
Abstract
Background
The assessment and prevention of vascular calcification (VC) in kidney transplant recipients (KTRs) have not been systematically studied. We aimed to evaluate VC change one year after kidney transplantation (KT) and identify their influencing factors.
Methods
95 KTRs (68 males; ages 40.2 ± 10.8 years) were followed one year after KT. Changes in bone mineral density (BMD) and bone metabolism biomarkers were assessed. Coronary artery calcification (CAC) and thoracic aortic calcification (TAC) were measured using 192-slice third-generation dual-source CT. The relationship between bone metabolism indicators and VC and the factors influencing VC were analyzed.
Results
Postoperative estimated glomerular filtration rate was 79.96 ± 24.18 mL/min*1.73 m2. One year after KT, serum phosphorus, intact parathyroid hormone (iPTH), osteocalcin, type I collagen N-terminal peptide (NTx), type I collagen C-terminal peptide, and BMD decreased, 25-hydroxyvitamin D remained low, and VC increased. Post-CAC and TAC were negatively correlated with pre-femoral neck BMD, and TAC was positively correlated with post-calcium. CAC and TAC change were positively correlated with post-calcium and 25-hydroxyvitamin D. Increased CAC was positively associated with hemodialysis and pre-femoral neck osteopenia. CAC change was positively associated with prediabetes, post-calcium, and pre-CAC and negatively associated with preoperative and postoperative femoral neck BMD, and NTx change. Increased TAC was positively associated with age, prediabetes, preoperative parathyroid hyperplasia/nodule, post-calcium, and post-femoral neck osteopenia. TAC change was positively associated with age, diabetes, pre-triglyceride, pre-TAC, dialysis time, post-calcium and post-iPTH, and negatively associated with post-femoral neck BMD.
Conclusions
Mineral and bone disorders persisted, and VC progressed after KT, showing a close relationship.
1. Introduction
Chronic kidney disease-mineral and bone disorder (CKD-MBD) is a nearly universal problem in patients with chronic kidney disease (CKD). After kidney transplantation (KT), mineral and bone disorder (MBD) is partially improved as transplanted kidney function recovers. However, a considerable number of kidney transplant recipients (KTRs) continue to have abnormal bone metabolism, osteoporosis, and even fractures, which decreases the survival rate of transplanted kidneys and recipients [Citation1,Citation2].
Additionally, the prevalence of cardiovascular complications remains high after KT and cardiovascular events account for 36–55% of the causes of death in KTRs [Citation3]. Vascular calcification (VC) is a manifestation of CKD-MBD and is considered the main cause of cardiovascular events in patients with CKD. A significant association between high VC levels and cardiovascular events in KTRs has also been reported [Citation4,Citation5]. The prevalence of coronary artery calcification (CAC) in KTRs is higher (61–75%) than that in CKD 3 stage and lower than that found in hemodialysis patients. Cianciolo et al. demonstrated that KT could not preclude the progress of VC but only delayed the process [Citation3].
However, few studies have systematically examined VC after KT [Citation6–8]. Although the link between MBD and VC arising from the primary disturbance of calcium phosphate homeostasis has long been acknowledged in native CKD, few studies have investigated the postulated independent association between bone disease and VC in the post-transplant setting [Citation9–11].
In this study, the KTRs in our center were followed for MBD and VC before and one year after KT. We analyzed the possible influencing factors of VC and VC changes and evaluated the relationship between MBD indices and VC to explore the effect of bone disease on VC, as well as to provide directions for the comprehensive assessment and prevention of VC after KT.
2. Materials and methods
2.1. Patients and study design
Patients in this study were derived from our previous prospective cohort study [Citation12] which followed up 95 patients receiving their first KT allograft in our center for one year. This study was approved by the Ethics Committee of the First Affiliated Hospital of Nanjing Medical University (Ethics Number 2016-SR-029). All the patients signed an informed consent form before participating in the study.
All included KTRs were >18 years old with stable postoperative graft function (coefficient of variation of serum creatinine (Scr) < 10% in the recent three consecutive measurements).
Patients with multiple organ transplantation, pregnancy, malignant tumors, other severe diseases (including severe liver disease, hematologic malignancies, and active infections), other diseases that seriously affect bone metabolism (such as tumor-related bone diseases, endocrine system diseases, autoimmune diseases, bone dysplasia, long-term bed rest, severe malnutrition, new fractures within 1 year, hip arthroplasty history, compression fracture of the lumbar spine), or clinically significant cardiovascular events within the last three months (including acute coronary syndrome, heart failure, arrhythmia, etc.) were excluded.
Data on clinical information, laboratory examinations, and imaging examinations were collected within three months before and one year after KT under the same detection conditions.
2.2. Clinical data
Data collected from the KTRs included sex, age, height, weight, body mass index (BMI), menstrual status, dialysis method and dialysis time, primary kidney disease, comorbidities (such as preoperative hypertension, diabetes, etc.), smoking history (continuous or cumulative smoking for 6 months or longer), drinking history (daily alcohol intake of ≥ 3 units, the unit referring to the WHO fracture risk assessment system), history of total parathyroidectomy with forearm autotransplantation (TPTX + AT), use of immunosuppressants, use of antihypertensive drugs, lipid-lowering drugs, erythropoietin, calcium, calcitriol, cinacalcet, and glucocorticoid accumulation (calculated based on the dose of methylprednisolone).
For the glucocorticoid protocol, methylprednisolone was intravenously administered at a dose of 500 on the day of surgery and until two days after KT. The dosage was reduced thereafter to 400 mg, 300 mg, 200 mg, and then 80
over each subsequent day, followed by oral administration of 24 mg/d methylprednisolone. The initial immunosuppression protocol for each KTR was methylprednisolone, tacrolimus (FK506, 0.05–0.1 mg/kg/d, twice daily reaching a target trough level of 10
) or cyclosporine (CsA, 3–5 mg/kg/d, twice daily reaching a target trough level of 150–250
), and mycophenolate mofetil (MMF, 0.75–1.0 g twice daily). Once the kidney allograft function was stabilized, FK506(target trough level of 6–10 ng/mL) or CsA (target trough level of 100–200 ng/mL), MMF (0.5–1.0 g twice daily), and methylprednisolone (20 mg daily initially and then tapering to 4 mg daily within three months) were administered as maintenance therapy. KTRs intolerant to FK506 at the target dose were additionally administered low-dose sirolimus.
2.3. Laboratory measurements
Fasting blood samples from all the included KTRs were collected in the morning. A Cobas e602 automatic electrochemical luminescence analyzer (Roche, Basel, Switzerland) was used to measure Scr, total cholesterol (TC), triglyceride (TG), high-density lipoprotein (HDL), low-density lipoprotein (LDL), and albumin (Alb).
Estimated glomerular filtration rate (eGFR) was calculated using the CKD-EPI formula. CKD stages were evaluated according to ‘Guidelines for Quality of Life of Kidney Diseases and Dialysis Patients’ (Kidney Disease Outcomes Quality Initiative, K/DOQI): CKD 1 T GFR ≥ 90 mL/(min × 1.73 m2), CKD 2 T GFR 60-89 mL/(min × 1.73 m2), CKD 3 T eGFR 30-59 mL/(min × 1.73 m2), CKD 4 T eGFR 15-29 (ml/(min × 1.73 m2), and CKD 5 T eGFR < 15 mL/(min × 1.73 m2).
For bone metabolism biochemical markers, Cobas e602 automatic electrochemical luminescence analyzer (Roche, Basel, Switzerland) was used to measure serum calcium (Ca), serum phosphorus (P), 25-hydroxyvitamin D(25(OH)vitD), intact parathyroid hormone (iPTH), bone-specific alkaline phosphatase (BALP), and osteocalcin (OC). A Cobas e170 automatic electrochemical luminescence analyzer (Roche, Basel, Switzerland) was used to measure the Type I collagen cross-linked N-terminal peptide (NTx) and type I collagen cross-linked C-terminal peptide (CTx). Corrected Ca levels were calculated using the following formula: Correction Ca = serum Ca + (40-serum Alb) × 0.02. The serum Ca levels in the following text were corrected.
2.4. Parathyroid hyperplasia and bone mineral density (BMD)
A GE Logiq E9 Ultrasound Diagnostic Device (GE Healthcare, Milwaukee, WI, USA) was used to evaluate parathyroid hyperplasia.
Dual-energy X-ray absorptiometry (DEXA) (Discovery W S/N 85065; Hologic, 35 CrosbyDrive BedFord, USA) was used to determine the BMD of the femoral neck and vertebra. Bone density was expressed in terms of area g/cm2. The T-value was calculated as the standard deviation obtained by comparing the KTR’s bone density with the average bone density of healthy young people of the same sex. The Z value was the standard deviation obtained by comparing the KTR bone density with the average bone density of the normal population of the same sex and age.
Diagnostic criteria for osteoporosis [Citation13] were as follows: For males ≥50 years and postmenopausal females, those with a T value ≥ −1.0 were regarded as healthy population, those with −1.0 > T > −2.5 were considered to have osteopenia, and those with T value ≤ −2.5 were considered to have osteoporosis. For males < 50 years old and premenopausal females, those with Z value ≥-2.0 were regarded as a healthy population, and those with Z value < −2.0 were considered to have osteopenia. Osteoporosis and osteopenia are collectively referred to as bone loss.
2.5. Coronary calcification (CAC) and thoracic aorta calcification (TAC) scores
CAC and TAC scores were obtained using 192-slice third-generation dual-source CT (SOMATOM Force, Siemens Healthineers, Forchheim, Germany). Scans were ECG-gated with a tube voltage of 100 kV, tube current automatically adjusted by the machine, 250 ms rotation time, 0.75 mm slice thickness, and display field of view (DFOV) of 25 cm. Patients held their breath during the scan. The CAC and TAC scores were calculated using the Agatston score of the SyngoVia Workstation (Syngo via VA30A, Siemens Healthcare, Forchheim, Germany). Each calcified coronary plaque was evaluated using density and size integrals. The coronary arteries were divided into left main, left anterior descending, left circumflex, and right coronary arteries, and the total CAC score was calculated as the sum of each coronary artery. A score of >100AU was defined as an increase [Citation14].
2.6. Statistical analysis
The SPSS software (version 25.0) was used for data processing. Normally distributed continuous variables were expressed as mean ± standard deviation (±s), and paired comparisons of baseline and follow-up indicators were performed using a paired t-test. Non-normally distributed continuous variables are expressed as medians (P25–P75), and paired comparisons of baseline and follow-up indicators were performed using the Wilcoxon signed-rank test. Categorical variables are expressed as rate or composition ratio % (frequency). The Pearson correlation test or Spearman correlation test was used for correlation analysis between bone metabolism indicators and VC. To explore the factors influencing VC, if the dependent variable was a continuous variable with a normal distribution, univariate and multivariate linear regression analyses were used; if the dependent variable was a continuous variable with a non-normal distribution, the logarithm of the dependent variable was used for linear regression analysis, and if the dependent variable was a binary classification variable, univariate and multivariate binary logistic regression analyses were used. Two-sided p < .05 indicated a statistically significant difference.
3. Results
3.1. Basic clinical data of KTRs
Basic clinical data of the 95 KTRs are shown in . Mean age was 40.2 ± 10.8 years. 28.4% were female and 4.2% were menopausal. Postoperative estimated glomerular filtration rate was 79.96 ± 24.18 mL/min*1.73 m2. Among the 95 transplants, 93 were from cadaveric donors, and two were from living donors. FK506 (90 cases, 94.7%) and cyclosporine (CsA, 5 cases, 5.3%) were used as calcineurin inhibitors (CNIs). Sirolimus was used in 7.4% (7 cases) of KTRs. Perioperative immune induction treatments included basiliximab (92.6%, 88 cases) and anti-thymocyte immunoglobulin (ATG, 7.4%). None of the recipients received cinacalcet before or after the KT.
Table 1. Basic clinical data of enrolled KTRs (n = 95).
3.2. Changes in bone metabolism biochemical markers, BMD and VC in KTRs
Before KT, patients presented with partially decreased serum calcium, elevated serum phosphorus, parathyroid hyperplasia, 25-hydroxyvitamin D deficiency, and elevated levels of bone turnover markers (BTMs) (). One year after KT, serum P, iPTH, OC, NTx, and CTx levels decreased (p < .001), and 25-hydroxyvitamin D level remained low before and after KT. The femoral neck (FN) BMD and lumbar spine (LS) BMD were lower than those before KT (p < .05). CAC and TAC increased one year after KT (p < .05) (). The prevalence of bone loss increased significantly (p < .05) (). The prevalence of increased CAC and TAC were 20.0%(19/95) and 45.2%(43/95) pre-operatively, and 22.1(21/95) and 46.3(44/95) post-operatively. △CAC of increased pre-CAC group [82.8(54.6–327.2)] was higher than that of non-increased pre-CAC group [0.4(0.0–13.5)] (p < .001). △TAC of the increased pre-TAC group and non-increased pre-CAC group were 82.8(54.6–327.2) and 0.4(0.0–13.5) respectively (p = .054).
Figure 1. Prevalence of osteopenia and osteoporosis (%) at various skeletal sites (FN, femoral neck; LS, lumbar spine).
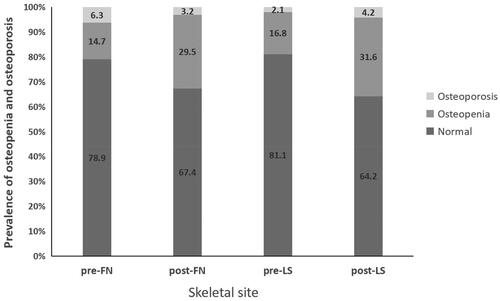
Table 2. Changes of metabolism biochemical markers, BMD and VC in kidney transplant recipients after kidney transplant for 1 year (n = 95).
3.3. Relationship between VC and bone metabolism indicators in KTRs
Postoperative CAC was negatively correlated with preoperative FN BMD (r = −0.451, p = .003). △CAC positively correlated with postoperative Ca (r = 0.275, p = .027) and 25(OH)vitD (r = 0.312, p = .011).
Postoperative TAC was positively correlated with postoperative Ca (r = 0.305, p = .005) and negatively correlated with postoperative P (r = −0.229, p = .042) and preoperative FN BMD (r = −0.422, p = .007). △TAC was positively correlated with postoperative Ca (r = 0.451, p = .001), postoperative 25(OH)vitD (r = 0.392, p = .015), △Ca (r = 0.281, p = .046), and preoperative 25(OH)vitD (r = 0.355, p = .011) and negatively correlated with postoperative P (r = −0.313, p = .025).
3.4. Factors influencing VC in KTRs
3.4.1. Influencing factors of CAC in KTRs
Univariate binary logistic regression analysis showed that increased CAC was positively associated with hemodialysis and preoperative FN osteopenia. The association with preoperative FN osteopenia was still statistically significant in the multivariate analysis (, all demographic and biochemical variables tested, and only significant factors included in the table).
Table 3. Results of logistic regression analysis of influencing factors of increased CAC (n = 95).
Univariate linear regression analysis showed that △CAC was positively associated with preoperative diabetes, postoperative Ca, and preoperative CAC levels, and negatively associated with pre-FN BMD, post-FN BMD, and △NTx. The associations with preoperative diabetes, △NTx, and preoperative CAC were still statistically significant in the multivariate analysis (, all demographic and biochemical variables tested, and only significant factors included in the table).
Table 4. Results of linear regression analysis of influencing factors of △CAC (n = 95).
3.4.2. Influencing factors of TAC in KTRs
Univariate binary logistic regression analysis showed that increased TAC was positively associated with age, preoperative diabetes, preoperative parathyroid hyperplasia/nodule, postoperative Ca, and postoperative FN osteopenia and was negatively associated with postoperative P. The associations between age and preoperative parathyroid hyperplasia/nodule were still statistically significant in the multivariate analysis (, all demographic and biochemical variables tested, and only significant factors included in the table).
Table 5. Results of logistic regression analysis of influencing factors of increased TAC (n = 95).
Univariate linear regression analysis showed that △TAC was positively associated with age, preoperative diabetes, preoperative TG, preoperative TAC, dialysis time, postoperative diabetes, postoperative Ca, postoperative iPTH, and postoperative BALP, and negatively associated with postoperative P and post-FN BMD. The associations between age and preoperative TAC were still statistically significant in the multivariate analysis (, all demographic and biochemical variables tested, and only significant factors included in the table).
Table 6. Results of linear regression analysis of influencing factors of △TAC (n = 95).
4. Discussion
After KT, some recipients suffer from abnormal mineral and bone metabolism, which may develop from not only the underlying bone disease before transplantation but also the long-term use of immunosuppressants and impaired transplanted graft function. Our data indicated that MBD after KT manifested as an increased prevalence of hypophosphatemia and bone loss, persistent 25(OH)vitD deficiency, and partially decreased PTH and BTMs, which is consistent with other studies [Citation15,Citation16].
Cardiovascular events account for 36–55% of deaths among KTRs [Citation3]. Vascular calcification is a common manifestation of CKD-MBD, manifesting as calcium deposition in the intima and media of the arteries and cardiac valve calcification, and is associated with increased cardiovascular events and mortality in KTRs [Citation4,Citation5]. Studies have suggested that calcification progresses more slowly in KTRs than in patients undergoing hemodialysis [Citation17,Citation18]. In the present study, we observed increased CAC and TAC at one year after KT. A follow-up study of 281 KTRs found that CAC and TAC were elevated significantly more than 3.5 years after KT [Citation19]. Mazzaferro et al. compared 41 KTRs with dialysis patients and showed that KT could slow but not stop the progression of CAC, suggesting that the progression was related to inflammation and hyperparathyroidism [Citation18].
VC after RT is closely associated with abnormal calcium and phosphorus metabolism. Our study revealed that TAC was positively associated with postoperative Ca and preoperative parathyroid hyperplasia/nodule, △CAC and △TAC were positively correlated with Ca levels, and △TAC was positively associated with postoperative iPTH. Reynolds et al. suggested that hypercalcemia can increase the risk of soft tissue and vascular calcification in patients with kidney failure [Citation20]. WANG et al. demonstrated that hypercalcemia is an independent risk factor for aortic calcification in CKD patients [Citation21]. Calcium-induced vascular calcification may be achieved by promoting the vascular smooth muscle cell (VSMC) release of stromal vesicles (MVs) and apoptosis [Citation22]. Previous studies on advanced CKD have shown that increased calcium, phosphorus, and PTH levels are associated with accelerated progression of aortic calcification [Citation23–25]. In a study of 150 patients with CKD 4–5 stage, plasma phosphorus was the only repeated laboratory variable independently associated with aortic calcification change [Citation8]. However, in our study, phosphorus level showed a negative correlation with VC, which is inconsistent with a previous study. We hypothesized that this inconsistency was because the correlation between serum phosphorus and serum calcium may have influenced the results. There is experimental evidence that calcium ions may be more potent than phosphate ions in inducing vascular calcification, and the increase in calcium and phosphorus showed a synergistic effect on the induction of vascular calcification [Citation26]. Bleskestad et al. [Citation27] noted that high PTH levels were associated with a 2.6-fold increase (HR = 2.60, 95% CI:1.10–6.16, p = .03) in the risk of the composite endpoint of all-cause mortality, cardiovascular events, and graft loss independent of confounders. Marecha et al. [Citation19] noted that KTRs with advanced age, diabetes, long-term dialysis history, hypertension, low 25(OH)D3 levels, and high PTH levels had a rapid increase in postoperative CAC and aortic calcium (AC) scores. Mazzaferro et al. [Citation18] conducted a 2-year follow-up study of KTRs and suggested that PTH level is closely related to CAC progression. Yilmaz et al. [Citation28] reported that PTH level was closely related to carotid intima-media thickness after KT. Our findings also demonstrated that the associations between TAC and preoperative parathyroid hyperplasia/nodules remained statistically significant in the multivariate analysis. De Boer et al. [Citation29] observed an inverse correlation between vitamin D levels and the incidence of CAC in hemodialysis patients. Nguyen et al. [Citation30] also noted that vitamin D levels were negatively correlated with CAC prevalence in KTRs. However, in another cross-sectional study of 89 KTRs, pulse wave velocity (PWV) was associated with elevated serum levels of 1,25 vitamin D [Citation31]. In our study, we observed a negative correlation between 25(OH)vitD and VC. High or low vitamin D levels can lead to VC formation in CKD patients through complex mechanisms. The mechanism of vitamin D in VC formation is unclear, and the study results are contradictory, indicating that further clinical and experimental research is required [Citation32,Citation33]. However, VC should be considered during calcium and vitamin D supplementation.
Our study also revealed a correlation between osteoporosis and postoperative VC. Our results suggest that increased CAC was positively associated with pre-FN osteopenia, △CAC was negatively associated with pre-FN and post-FN BMD, increased TAC was positively associated with post-FN osteopenia, and △TAC was positively associated with post-FN BMD. Bone loss and VC are common features of patients with kidney failure. Decreased BMD was found to be closely related to VC in kidney failure patients [Citation34]. Low trabecular bone volume and reduced cortical BMD in patients on dialysis are associated with CAC [Citation35], and osteoporosis is an important predictor of CAC progression [Citation36]. A recent study of 678 KTRs suggested that higher BMD was associated with a lower risk of AC [Citation6]. VC is an active cell-mediated process that resembles osteogenic development [Citation37]. Studies have suggested that bone turnover plays a key pathophysiological role in bone diseases and vascular calcification. In our study, △CAC was negatively associated with △NTx and △TAC was positively associated with post-BALP. An evaluation of KTRs showed that BTM levels in the early stages correlated with postoperative arterial stiffness [Citation38]. Pennisi et al. [Citation39] found that bone formation biomarkers are associated with the severity of atherosclerosis. Felon et al. [Citation40] reported that osteocalcin not only participates in bone metabolism but can also regulate blood lipid and arteriosclerosis progression and improve endothelial cell function. In another 7-year follow-up study after KT, no relationship was observed between BTMs and CAC progression [Citation7]. As the mechanisms of VC and bone mineralization share several pathways, it is biologically considered that low bone density may be associated with VC [Citation41].
Abnormal bone mineralization and bone remodeling in patients with CKD promote VC through various mechanisms [Citation9,Citation10], such as inhibition of the Wnt pathway and stimulation of the transition of endothelial cells to mesenchymal cells. During the development of mesenchymal stem cells and early vascular progenitors, dedifferentiated VSMCs are susceptible to osteoblastic transition. The osteoblastic transition of VSMCs produces CKD-stimulated calcification of atherosclerotic plaques and tunica media, resulting in neointimal or medial vascular calcification [Citation42]. Wnt activity stimulated by kidney disease has been reported to have major consequences on the skeletal and cardiovascular systems. Endothelial-to-mesenchymal transition (EndMT) is a physiological process involved in normal cardiac development that can be reactivated in various adult disease states and has been implicated in cardiac, vascular, and kidney fibrosis. Kidney injury stimulates EndMT in the cardiovascular system, which contributes to vascular dedifferentiation, calcification, and cardiac hypertrophy [Citation43]. Wnt inhibitors (Dkk1) are capable of stimulating EndMT in the vasculature through the downregulation of Wnt7b and signaling through activin-like kinase/Smad 1/5 pathways, leading to vascular calcification and fibrosis in both endothelial cell cultures and atherogenic (non-CKD) animal models [Citation44]. In animal models of early CKD, incomplete recovery from acute kidney injury led to increased expression of Wnt inhibitors (e.g. Dkk1 and sclerostin) in the injured kidney and systemic circulation. The cardiovascular system is affected by the dedifferentiation of VSMCs, stimulation of osteoblastic transition, vascular calcification, loss of vascular contractile machinery, and promotion of cardiac hypertrophy. Neutralization of circulating Dkk1 with a monoclonal antibody leads to increased bone formation rates, improved vascular function, and decreased osteoblastic transition and vascular calcification [Citation9]. In the kidney transplant setting, studies have also shown that chronic allograft injury could reactivate kidney repair mechanisms, resulting in increased activin and Wnt expression implicated in early CKD-MBD and cardiovascular disease, which are associated with kidney allograft vasculopathy [Citation45]. The specific mechanism of the kidney-skeletal-cardiovascular axis requires further investigation.
In our results, the preoperative VC level was an independent risk factor for VC progression, even in the multivariate analysis. In a study that followed 113 KTRs for seven years, baseline CAC and time-to-transplantation were the sole variables that predicted CAC evolution over time [Citation7]. Previous studies have also demonstrated that the presence of CAC was a strong predictor of further CAC progression over time in KTRs and non-kidney disease patients [Citation46,Citation47], which suggests the need for strengthened control of VC before KT. In addition, hemodialysis, dialysis time, preoperative diabetes, TG level, and advanced age were associated with VC progression in our study, which is consistent with other studies. This suggests that we should try to minimize the waiting time before KT and actively control risk factors, such as dyslipidemia and hyperglycemia.
Ours is a prospectively designed follow-up study. The strengths of this study are as follows: first, the relationship between bone metabolism indicators and VC were evaluated extensively; second, the factors influencing VC progression were analyzed comprehensively. There also exist some limitations. First, the sample size was relatively small and it was a monocentric study, which limited the identification of risk factors for VC progression and the generalization of the results to other transplant centers. Second, the follow-up time was short. We did not evaluate the long-term changes in bone metabolism and VC after KT and their relationship with long-term survival. Furthermore, most recipients were of the CKD1T-3T stage, and therefore the results could not be representative of bone metabolism in KTRs of the CKD4T-5T stage.
In conclusion, one year after KT, MBD was partially improved, mainly characterized by increased serum calcium, decreased serum phosphorous, partly relieved hyperparathyroidism, persistent 25(OH)vitD deficiency, elevated BTMs, and bone loss. VC progressed one year after the operation. In addition to the traditional risk factors, VC after KT is closely related to mineral and bone disorders. The higher the preoperative iPTH level, serum Ca level, and bone loss, the higher the VC progression. Preoperative VC level was an independent risk factor for VC progression. Therefore, active control of risk factors such as MBD, hyperglycemia, and dyslipidemia; shortened dialysis time before KT; long-term dynamic monitoring of MBD and cardiovascular complications in KTRs; and in-depth exploration of their risk factors and related mechanisms will help improve the long-term survival rate of KTRs.
Acknowledgment
We acknowledged that patients in this study were derived from our previous prospective cohort study (Sun et al. [Citation12]).
Disclosure statement
No potential conflict of interest was reported by the author(s).
Data availability statement
Reasonable requests for data will be accommodated by contacting the corresponding author.
Additional information
Funding
References
- Naylor KL, Li AH, Lam NN, et al. Fracture risk in kidney transplant recipients: a systematic review. Transplantation. 2013;95(12):1–9. doi: 10.1097/TP.0b013e31828eead8.
- Nair SS, Lenihan CR, Montez-Rath ME, et al. Temporal trends in the incidence, treatment and outcomes of hip fracture after first kidney transplantation in the United States. Am J Transplant. 2014;14(4):943–951. doi: 10.1111/ajt.12652.
- Cianciolo G, Capelli I, Angelini ML, et al. Importance of vascular calcification in kidney transplant recipients. Am J Nephrol. 2014;39(5):418–426. doi: 10.1159/000362492.
- Benjamens S, Pol RA, Glaudemans A, et al. A high abdominal aortic calcification score by dual X-ray absorptiometry is associated with cardiovascular events after kidney transplantation. Nephrol Dial Transplant. 2018;33(12):2253–2259. doi: 10.1093/ndt/gfy158.
- Roe P, Wolfe M, Joffe M, et al. Inflammation, coronary artery calcification and cardiovascular events in incident renal transplant recipients. Atherosclerosis. 2010;212(2):589–594. doi: 10.1016/j.atherosclerosis.2010.05.016.
- Sotomayor CG, Benjamens S, Gomes-Neto AW, et al. Bone mineral density and aortic calcification: evidence for a bone-vascular axis after kidney transplantation. Transplantation. 2021;105(1):231–239. doi: 10.1097/TP.0000000000003226.
- Gulcicek S, Zoccali C, Olgun DC, et al. Long-term progression of coronary artery calcification is independent of classical risk factors, C-reactive protein, and parathyroid hormone in renal transplant patients. Cardiorenal Med. 2017;7(4):284–294. doi: 10.1159/000475999.
- Lankinen R, Hakamaki M, Hellman T, et al. Progression of aortic calcification in stage 4-5 chronic kidney disease patients transitioning to dialysis and transplantation. Kidney Blood Press Res. 2022;47(1):23–30. doi: 10.1159/000518670.
- Seifert ME, Hruska KA. The Kidney-Vascular-Bone axis in the chronic kidney Disease-Mineral bone disorder. Transplantation. 2016;100(3):497–505. doi: 10.1097/TP.0000000000000903.
- Thompson B, Towler DA. Arterial calcification and bone physiology: role of the bone-vascular axis. Nat Rev Endocrinol. 2012;8(9):529–543. doi: 10.1038/nrendo.2012.36.
- Asci G, Ok E, Savas R, et al. The link between bone and coronary calcifications in CKD-5 patients on haemodialysis. Nephrol Dial Transplant. 2011;26(3):1010–1015. doi: 10.1093/ndt/gfq491.
- Sun L, Wang Z, Zheng M, et al. Mineral and bone disorder after kidney transplantation: a single-center cohort study. Ren Fail. 2023;45(1):2210231. doi: 10.1080/0886022X.2023.2210231.
- Kanis JA. Assessment of fracture risk and its application to screening for postmenopausal osteoporosis: synopsis of a WHO report. WHO study group. Osteoporos Int. 1994;4(6):368–381. doi: 10.1007/BF01622200.
- He ZX, Hedrick TD, Pratt CM, et al. Severity of coronary artery calcification by electron beam computed tomography predicts silent myocardial ischemia. Circulation. 2000;101(3):244–251. doi: 10.1161/01.cir.101.3.244.
- Jorgensen HS, Behets G, Bammens B, et al. Natural history of bone disease following kidney transplantation. J Am Soc Nephrol. 2022;33(3):638–652. doi: 10.1681/ASN.2021081081.
- Ferreira AC, Mendes M, Silva C, et al. Improvement of mineral and bone disorders after renal transplantation. Transplantation. 2022;106(5):e251–e261. doi: 10.1097/TP.0000000000004099.
- Moe SM, O’Neill KD, Reslerova M, et al. Natural history of vascular calcification in dialysis and transplant patients. Nephrol Dial Transplant. 2004;19(9):2387–2393. doi: 10.1093/ndt/gfh303.
- Mazzaferro S, Pasquali M, Taggi F, et al. Progression of coronary artery calcification in renal transplantation and the role of secondary hyperparathyroidism and inflammation. Clin J Am Soc Nephrol. 2009;4(3):685–690. doi: 10.2215/CJN.03930808.
- Marechal C, Coche E, Goffin E, et al. Progression of coronary artery calcification and thoracic aorta calcification in kidney transplant recipients. Am J Kidney Dis. 2012;59(2):258–269. doi: 10.1053/j.ajkd.2011.07.019.
- Reynolds JL, Joannides AJ, Skepper JN, et al. Human vascular smooth muscle cells undergo vesicle-mediated calcification in response to changes in extracellular calcium and phosphate concentrations: a potential mechanism for accelerated vascular calcification in ESRD. J Am Soc Nephrol. 2004;15(11):2857–2867. doi: 10.1097/01.ASN.0000141960.01035.28.
- Wang XR, Yuan L, Zhang JJ, et al. Serum sclerostin values are associated with abdominal aortic calcification and predict cardiovascular events in patients with chronic kidney disease stages 3-5D. Nephrology. 2017;22(4):286–292. doi: 10.1111/nep.12813.
- Shanahan CM, Crouthamel MH, Kapustin A, et al. Arterial calcification in chronic kidney disease: key roles for calcium and phosphate. Circ Res. 2011;109(6):697–711. doi: 10.1161/CIRCRESAHA.110.234914.
- Naganuma T, Takemoto Y, Uchida J, et al. Hypercalcemia is a risk factor for the progression of aortic calcification in kidney transplant recipients. Kidney Blood Press Res. 2019;44(4):823–834. doi: 10.1159/000501740.
- Yamamoto D, Suzuki S, Ishii H, et al. Predictors of abdominal aortic calcification progression in patients with chronic kidney disease without hemodialysis. Atherosclerosis. 2016;253:15–21. doi: 10.1016/j.atherosclerosis.2016.08.004.
- Meneghini M, Regalia A, Alfieri C, et al. Calcium and osteoprotegerin levels predict the progression of the abdominal aortic calcifications after kidney transplantation. Transplantation. 2013;96(1):42–48. doi: 10.1097/TP.0b013e3182934cee.
- Shroff RC, McNair R, Skepper JN, et al. Chronic mineral dysregulation promotes vascular smooth muscle cell adaptation and extracellular matrix calcification. J Am Soc Nephrol. 2010;21(1):103–112. doi: 10.1681/ASN.2009060640.
- Bleskestad IH, Bergrem H, Leivestad T, et al. Parathyroid hormone and clinical outcome in kidney transplant patients with optimal transplant function. Clin Transplant. 2014;28(4):479–486. doi: 10.1111/ctr.12341.
- Yilmaz MI, Sonmez A, Saglam M, et al. A longitudinal study of inflammation, CKD-mineral bone disorder, and carotid atherosclerosis after renal transplantation. Clin J Am Soc Nephrol. 2015;10(3):471–479. doi: 10.2215/CJN.07860814.
- de Boer IH, Kestenbaum B, Shoben AB, et al. 25-hydroxyvitamin D levels inversely associate with risk for developing coronary artery calcification. J Am Soc Nephrol. 2009;20(8):1805–1812. doi: 10.1681/ASN.2008111157.
- Nguyen PT, Coche E, Goffin E, et al. Prevalence and determinants of coronary and aortic calcifications assessed by chest CT in renal transplant recipients. Am J Nephrol. 2007;27(4):329–335. doi: 10.1159/000102978.
- Bargnoux AS, Vetromile F, Kuster N, et al. Markers of bone remodeling are associated with arterial stiffness in renal transplanted subjects. J Nephrol. 2015;28(6):765–772. doi: 10.1007/s40620-015-0201-5.
- Zhao Y, Guo Y, Jiang Y, et al. Vitamin D suppresses macrophage infiltration by down-regulation of TREM-1 in diabetic nephropathy rats. Mol Cell Endocrinol. 2018;473:44–52. doi: 10.1016/j.mce.2018.01.001.
- Chung S, Kim M, Koh ES, et al. Serum 1,25-dihydroxyvitamin D better reflects renal parameters than 25-hydoxyvitamin D in patients with glomerular diseases. Int J Med Sci. 2017;14(11):1080–1087. doi: 10.7150/ijms.20452.
- Chen Z, Sun J, Haarhaus M, et al. Bone mineral density of extremities is associated with coronary calcification and biopsy-verified vascular calcification in living-donor renal transplant recipients. J Bone Miner Metab. 2017;35(5):536–543. doi: 10.1007/s00774-016-0788-1.
- Cejka D, Weber M, Diarra D, et al. Inverse association between bone microarchitecture assessed by HR-pQCT and coronary artery calcification in patients with end-stage renal disease. Bone. 2014;64:33–38. doi: 10.1016/j.bone.2014.03.048.
- Malluche HH, Blomquist G, Monier-Faugere M, et al. High parathyroid hormone level and osteoporosis predict progression of coronary artery calcification in patients on dialysis. J Am Soc Nephrol. 2015;26(10):2534–2544. doi: 10.1681/ASN.2014070686.
- Mizobuchi M, Towler D, Slatopolsky E. Vascular calcification: the killer of patients with chronic kidney disease. J Am Soc Nephrol. 2009;20(7):1453–1464. doi: 10.1681/ASN.2008070692.
- Cseprekal O, Kis E, Degi AA, et al. Bone metabolism and arterial stiffness after renal transplantation. Kidney Blood Press Res. 2014;39(6):507–515. doi: 10.1159/000368461.
- Pennisi P, Signorelli SS, Riccobene S, et al. Low bone density and abnormal bone turnover in patients with atherosclerosis of peripheral vessels. Osteoporos Int. 2004;15(5):389–395. doi: 10.1007/s00198-003-1550-9.
- Ferron M, Hinoi E, Karsenty G, et al. Osteocalcin differentially regulates beta cell and adipocyte gene expression and affects the development of metabolic diseases in wild-type mice. Proc Natl Acad Sci U S A. 2008;105(13):5266–5270. doi: 10.1073/pnas.0711119105.
- Chen Z, Qureshi AR, Ripsweden J, et al. Vertebral bone density associates with coronary artery calcification and is an independent predictor of poor outcome in end-stage renal disease patients. Bone. 2016;92:50–57. doi: 10.1016/j.bone.2016.08.007.
- Moe SM, Chen NX. Pathophysiology of vascular calcification in chronic kidney disease. Circ Res. 2004;95(6):560–567. doi: 10.1161/01.RES.0000141775.67189.98.
- Hertig A, Gangadhar T, Kalluri R. Renal studies provide an insight into cardiac extracellular matrix remodeling during health and disease. J Mol Cell Cardiol. 2010;48(3):497–503. doi: 10.1016/j.yjmcc.2009.07.022.
- Cheng SL, Shao JS, Behrmann A, et al. Dkk1 and MSX2-Wnt7b signaling reciprocally regulate the endothelial-mesenchymal transition in aortic endothelial cells. Arterioscler Thromb Vasc Biol. 2013;33(7):1679–1689. doi: 10.1161/ATVBAHA.113.300647.
- von Toerne C, Schmidt C, Adams J, et al. Wnt pathway regulation in chronic renal allograft damage. Am J Transplant. 2009;9(10):2223–2239. doi: 10.1111/j.1600-6143.2009.02762.x.
- Seyahi N, Cebi D, Altiparmak MR, et al. Progression of coronary artery calcification in renal transplant recipients. Nephrol Dial Transplant. 2012;27(5):2101–2107. doi: 10.1093/ndt/gfr558.
- Schankel K, Robinson J, Bloom RD, et al. Determinants of coronary artery calcification progression in renal transplant recipients. Am J Transplant. 2007;7(9):2158–2164. doi: 10.1111/j.1600-6143.2007.01903.x.