
Abstract
This study is intended to explore the effect of hypoxia-inducible factor-1α (HIF-1α) activation on lipid accumulation in the diabetic kidney. A type 1 diabetic rat model was established by STZ intraperitoneal injection. Cobalt chloride (CoCl2) and YC-1 were used as the HIF-1α activator and antagonist, respectively. CoCl2 treatment significantly increased HIF-1α expression, accelerated lipid deposition, and accelerated tubular injury in diabetic kidneys. In vitro, CoCl2 effectively stabilized HIF-1α and increased its transportation from the cytoplasm to the nucleus, which was accompanied by significantly increased lipid accumulation in HK-2 cells. Furthermore, results obtained in vivo showed that HIF-1α protein expression in the renal tubules of diabetic rats was significantly downregulated by YC-1 treatment. Meanwhile, lipid accumulation in the tubules of the DM + YC-1 group was markedly decreased in comparison to the DM + DMSO group. Accordingly, PAS staining revealed that the pathological injury caused to the tubular epithelial cells was alleviated by YC-1 treatment. Furthermore, the blood glucose level, urine albumin creatinine ratio, and NAG creatinine ratio in the DM + YC-1 group were significantly decreased compared to the DM + DMSO group. Moreover, the protein expression levels of transforming growth factor β1 (TGF-β1) and connective tissue growth factor (CTGF) in diabetic kidneys were decreased by YC-1 treatment. Our findings demonstrate that the activation of HIF-1α contributed to interstitial injury in a rat model of diabetic nephropathy and that the underlying mechanism involved the induction of lipid accumulation.
Introduction
Diabetic nephropathy (DN) is the main cause of end-stage renal disease (ESRD) in developed countries [Citation1]. An increasing number of studies have documented that diabetic tubulopathy is a pivotal event resulting in albuminuria due to the diminished capacity of albumin reclamation [Citation2]. In turn, albuminuria caused by tubular injury contributes to aggravated diabetic tubulopathy, which is known as ‘albuminuria-associated tubulotoxicity’, thus accelerating the progression of DN [Citation2]. Current therapies aim to optimize blood pressure, decrease the blood glucose level, and inhibit inflammation to slow the progression of the disease to a certain extent, though up to 20% of patients with nephropathy ultimately progress to ESRD, thus requiring renal replacement therapy [Citation3]. For this reason, greater efforts should be devoted to exploring the underlying mechanisms of tubular injury in DN to identify therapeutic targets and develop novel treatment strategies.
Renal tubular ectopic lipid deposition (ELD) refers to the excessive deposition of lipids, especially triglyceride (TG), in renal tubular epithelial cells (RTECs). This phenomenon has recently been considered a key factor that promotes the development of DN [Citation4]. Kidney lipotoxicity caused by ELD in RTECs can cause structural and functional changes that lead to tubular damage via multiple mechanisms pertaining to apoptosis, oxidative stress, chronic inflammation, and extracellular matrix deposition [Citation4–7]. A variety of pathologic factors affecting those with diabetes; such as hyperglycemia, advanced glycation end products, dyslipidemia, hyperinsulinemia, and low levels of adiponectin; have been reported to increase renal lipid deposition by disturbing the balance between the supply and utilization of fatty acids in RTECs [Citation8,Citation9]. In our previous study, we found that excess acetate produced by reprogrammed intestinal microbiota mediated lipid deposition in RTECs by activating G protein-coupled receptor 43, thereby exacerbating the tubular injury of DN [Citation10].
Recently, an increasing body of evidence indicates that the activation of hypoxia-inducible factors under hypoxic conditions mediates lipid deposition in cells. Du et al. demonstrated that HIF appears to drive lipid deposition in clear cell renal cell carcinoma (ccRCC) via the repression of fatty acid metabolism [Citation11]. It has also been demonstrated that HIF-1 can increase lipid storage by directly upregulating acylglycerol-3-phosphate acyltransferase 2 expression in cancer cells [Citation12]. Seo et al. noted that HIF-1 triggers cancer progression by modifying lipid accumulation, β-oxidation, and lipolysis, while the targeting of HIF-1-mediated lipid metabolic reprogramming may comprise a promising cancer therapy [Citation13]. Besides research focusing on cancer, it has also been reported that mitochondrial uncoupling protein 2 mediates lipid accumulation and tubulointerstitial fibrosis in acute kidney injury via regulating HIF-1α stabilization in tubular cells [Citation14].
Previous studies have revealed that hypoxia arises in the early stage of DN, however, the effect of HIF-1α increasement in the RTECs of a diabetic model is controversial, thus requiring further exploration [Citation15–17]. This study aims to determine whether HIF-1α activation exacerbates DN progression and investigate its role in modulating the lipid metabolism of renal tubules.
Materials and methods
Animal studies
Male Sprague-Dawley rats weighing 150–180 g were acquired from Shanghai Bikai Company (Shanghai, China). The rats underwent one week of adaptive feeding and acclimatization in a quarantine room before being transferred to a specific pathogen-free house. All procedures performed on the rats were ratified by the animal ethics review committee of Wannan Medical College (Animal Ethics Approval Number: LLSC-2021-149). A model of type 1 diabetes mellitus was established in the rats by intraperitoneally injecting them with 60 mg/kg streptozotocin (STZ) (S0130, Sigma Aldrich). Rats with blood glucose levels >16.67 mol/L at 72 h after the injection of STZ were considered to be successfully established. Citrate buffer-injected rats served as the nondiabetic controls. For the first in vivo phase, the rats were randomly grouped as follows: group 1, healthy control rats (Control); group 2, diabetic rats (DM); and group 3, diabetic rats receiving 20 mg/kg CoCl2 (C8661, Sigma Aldrich) each day by gavage (DM + CoCl2). To eliminate any intergroup differences solely attributed to the gavage procedure, rats in groups not administered CoCl2 by gavage instead received an equivalent volume of sterile drinking water by gavage every day. For the second in vivo phase, the rats were randomly grouped as follows: group 1, diabetic rats injected with 1% DMSO in phosphate buffer every day (DM + DMSO); and group 2, diabetic rats receiving 4 mg/kg of YC-1 (S7958, Sellect) by intraperitoneal injection every day (DM + YC-1). After receiving the interventions for eight weeks, all rats were euthanized and their samples were collected for subsequent measurements.
Cell culture
The human proximal tubular cell line HK-2 was cultured as described in our previous study [Citation18]. HK-2 cells were grouped as follows: the Control group, MN group (30 mmol/L mannitol), HG group (30 mmol/L glucose), CoCl2 group (100 μmol/L CoCl2), and HG + CoCl2 group (30 mmol/L glucose and 100 μmol/L CoCl2). The cells were collected for experiments after the different interventions were conducted for a period of 24 h. Besides, a specific-sequence siRNA was used to knock down HIF-1α expression, while a nonspecific-sequence siRNA was used as a negative control. All cells were transfected according to the manufacturer’s protocol. They were subsequently incubated with 30 mmol·L−1 glucose and 100 μmol·L−1 CoCl2 for 24 h after the transfection. The siRNA and transfection reagents were purchased from GenePharma.
Serum and urine measurements
The urinary levels of albumin, N-acetyl-β-D-glucosaminidase (NAG), creatinine, blood glucose, and serum lipid profiles were measured applying the method previously described [Citation18].
PAS staining, HE staining and Masson staining
Tubular injury was evaluated by histological staining conducted on 3-μm paraffin sections of rat kidney tissues. PAS staining, HE staining and Masson staining were performed using commercial reagent kits (C0142S, Beyotime; C0105S, Beyotime; KGE1113-8, KeyGEN; respectively) according to the manufacturer’s protocol. For PAS staining, five or more non-overlapping fields were randomly selected and imaged with ×200 amplification for each rat. The damaged area was calculated by Image-Pro Plus Software and then divided by the total area of the field.
Oil red O staining and TG quantitative assays
Oil red O staining and measurements of cellular lipids were performed by applying the previously described methods [Citation18,Citation19]. Samples of kidney tissue or HK-2 cells collected in isopropanol were crushed ultrasonically to isolate the lipids. After the resulting homogenate was centrifugated at 10,000 g, the liquid phase was collected for the TG quantification assay, which was conducted with a commercial reagent kit (E-BC-K261-M, Elabscience). The solid phase was dried in the air and subsequently lysed in 1 mol/L NaOH solution in preparation for the Lowry protein quantification assay. The TG content of each sample was normalized to the total cell protein.
Immunohistochemical and immunofluorescence staining
Immunohistochemical and immunofluorescence staining were performed by applying the method previously described [Citation18]. Primary antibodies of TGF-β1 (bs-0086R, 1:400, Bioss) and CTGF (bs-0743R, 1:400, Bioss) were used for immunohistochemical staining. HIF-1α primary antibody (ab179483, 1:200, Abcam) was used for immunofluorescence staining.
Western blotting
Western blotting was performed according to a previously described method [Citation18]. Primary antibodies against HIF-1α (ab179483, 1:2000, Abcam), CTGF (bs-0743R, 1:1000, Bioss), TGF-β1 (bs-0086R, 1:1000, Bioss), and β-actin (#4970, 1:1000, Cell Signaling Technology) were used.
Statistical analysis
All values are expressed as the mean ± SD. Statistical significance (p < 0.05) was determined either using the t-test for two groups or one-way ANOVA, followed by Tukey’s multiple comparisons test for multiple groups.
Results
HIF-1α activation induced by CoCl2 aggravated lipid accumulation in diabetic kidneys
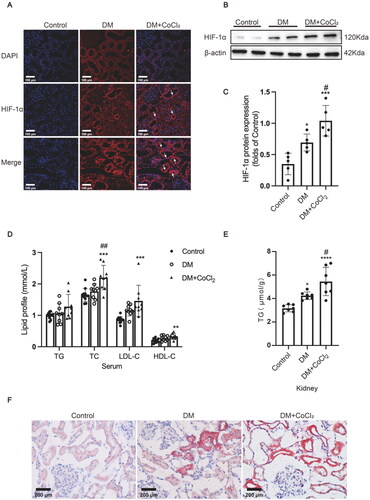
As a previous study indicated that insufficient HIF-1α activation in the early stage of diabetes contributes to tubular injury and DN progression [Citation20], the diabetic rats in the current study were administered 100 μmol/L CoCl2 by gavage every day to explore whether sufficient HIF-1α activation would protect the renal tubules against diabetic injury. HIF-1α protein expression in the tubules was markedly increased in diabetic kidneys, which was further effectively increased after CoCl2 treatment (). The lipid profile measurement results showed that the serum TC (total cholesterol), LDL-C (low-density lipoprotein-cholesterol), and HDL-C (high-density lipoprotein-cholesterol) levels in the rats of the DM + CoCl2 group were significantly increased in comparison to the controls, and CoCl2 treatment markedly increased the serum TC levels of diabetic rats (). The serum TG levels of the DM group were not substantially affected by CoCl2 treatment (), while the TG quantitative assay showed that lipid accumulation in the kidneys of the DM + CoCl2 group was markedly increased in comparison to the DM group (). Oil red O staining further confirmed that excess HIF-1α activation induced by CoCl2 treatment indeed accelerated neutral lipid deposition in the renal tubules of diabetic rats ().
Figure 1. HIF-1α activation induced by CoCl2 aggravated lipid accumulation in diabetic kidneys. (A) The protein expression of HIF-1α was detected by immunofluorescence staining (×400, marked by arrows) and (B and C) Western blotting (n = 5). Densitometry analysis of each protein band was performed using the software Image J, and normalized to β-actin. (D) TG, TC, LDL-C, and HDL-C levels in the serum were measured (n = 9-11). (E) Lipid accumulation in the kidneys of rats was quantified by the TG quantification assay (mean ± SD, n = 7). (F) Oil red O staining (×400) was performed to observe neutral lipid accumulation in kidneys. Data are presented as mean ± SD. *p < 0.05, **p < 0.01, ***p < 0.001, ****p < 0.001 versus Control; #p < 0.05, ##p < 0.01 versus DM.
HIF-1α activation induced by CoCl2 exacerbated tubular injury in diabetic kidneys
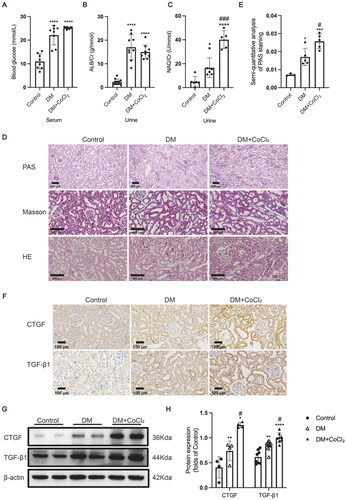
Furthermore, we explored the effect of CoCl2 on the blood glucose level, urinary biochemical indexes, pathological structure, and profibrogenic factor expression levels in the kidneys of diabetic rats. CoCl2 treatment did not affect the blood glucose level or the urine albumin creatinine ratio of diabetic rats (), whereas it did significantly increase the urinary NAG creatinine ratio (a marker of proximal tubular injury) (). Consistent with the increased urinary NAG level, incremental damage of the tubules in the kidneys of the diabetic rats treated with CoCl2 was observed using PAS staining (). HE staining showed that apoptosis of tubular epithelial cells in rats of DM + CoCl2 group was increased when compared to the DM group (), and Masson staining showed that CoCl2 treatment aggravated extracellular matrix deposition of diabetic kidneys (). Furthermore, CoCl2 treatment significantly increased the expression of the two profibrogenic factors TGF-β1 and CTGF in the kidneys of diabetic rats (). These results indicate that HIF-1α activation in the renal tubules exacerbated tubular injury in these diabetic rats.
Figure 2. HIF-1α activation induced by CoCl2 exacerbated tubular injury in diabetic kidneys. (A) The serum blood glucose level (n = 8), (B) urinary albumin/creatinine ratio (n = 9-11), and (C) urinary NAG/creatinine ratio (n = 5-6) were measured. (D) Histological changes in the renal tubules were detected by PAS staining (×100); Renal tubules with increased apoptosis were marked by asterisk in HE staining (×200); Extracellular matrix deposition was detected by Masson staining (blue area, ×200). (E) The damaged area in PAS staining was calculated by the software Image-Pro Plus (n = 3-5). (F) The protein expression of TGF-β1 and CTGF was detected by immunohistochemical staining and (G and H, ×200) Western blotting (n = 4–8). Densitometry analysis of each protein band was performed using the software Image J, and normalized to β-actin. Data are presented as mean ± SD. *p < 0.05, **p < 0.01, ***p < 0.001, ****p < 0.0001 versus Control, #p < 0.05, ###p < 0.001 versus DM.
HIF-1α activation increased lipid accumulation in HK-2 cells
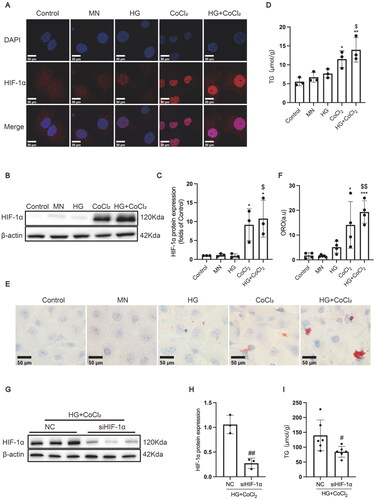
To further investigate the effect of HIF-1α activation on lipid metabolism in renal tubular epithelial cells, HK-2 cells were incubated with or without CoCl2 in either the presence or absence of high glucose. As is shown in , CoCl2 treatment, whether in the absence or presence of high glucose, markedly activated HIF-1α expression in the nucleus of HK-2 cells in comparison to the Control group. Consistently, HIF-1α protein expression was significantly induced by CoCl2 treatment, while HIF-1α expression in the HG + CoCl2 group was slightly higher than that of the CoCl2 group, but without significance (). Additionally, the TG quantitative assay showed that CoCl2 treatment significantly increased the TG content of HK-2 cells (), which was further verified by oil red O staining (). As CoCl2 treatment could also modulate other enzymes and pathways, HIF-1α expression was knocked down by a specific siRNA to exclude the effects on lipid metabolism induced by other molecules. The results showed that HIF-1α silence decreased lipid deposition in HK-2 cells treated with high glucose and CoCl2 (). Those data suggest that HIF-1α activation could exacerbate lipid deposition in the renal epithelial cells of diabetic rats.
Figure 3. HIF-1α activation increased lipid accumulation and profibrogenic factor expression in HK-2 cells. (A) The protein expression of HIF-1α was detected by immunofluorescence staining (×800) and (B-C) Western blotting. (D) Lipid accumulation in HK-2 cells was measured by the TG quantification assay. (E) Oil red O staining (×400) was conducted to observe neutral lipid accumulation in HK-2 cells. (F) Quantification of cellular lipids stained by oil red O using software image J. (G-H) The protein expression of HIF-1α was detected by Western blotting. (I) TG quantification assay. Densitometry analysis of each protein band was performed using the software Image J, and normalized to β-actin. Data are presented as mean ± SD. *p < 0.05, **p < 0.01, ***p < 0.001 versus Control. $p < 0.05, $$p < 0.01 versus HG. #p < 0.05, ##p < 0.01 versus NC.
HIF-1α inhibition by YC-1 treatment decreased lipid accumulation in diabetic kidneys
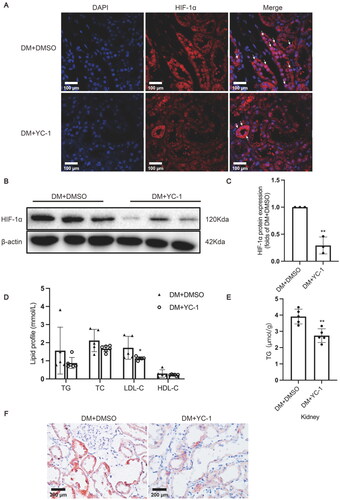
YC-1, also known as 3-(5′-hydroxymethyl-2′-furyl)-1-benzylindazole, is an agent that can inhibit HIF-1α expression both in vitro and in vivo [Citation21]. YC-1 was administered to rats by intraperitoneal injection to explore whether HIF-1α could serve as a potential therapeutic target for DN by decreasing ectopic lipid accumulation in the kidneys. The results showed that YC-1 treatment indeed downregulated HIF-1α expression in the tubule epithelial cells of diabetic rat kidneys in comparison to the DM + DMSO group (). Although the serum TG, TC, and HDL-C levels were comparable, the serum LDL-C level in rats of the DM + YC-1 group was markedly decreased in comparison to that of the DM + DMSO group (). The TG quantitative assay showed that YC-1 treatment significantly reduced lipid deposition in diabetic kidneys, which was again confirmed by oil red O staining (). These results reveal that HIF-1α inhibition could effectively reduce lipid accumulation in the renal tubules of diabetic rats.
Figure 4. HIF-1α inhibition by YC-1 treatment decreased lipid accumulation in diabetic kidneys. (A) The protein expression of HIF-1α was detected by immunofluorescence staining (×400, marked by arrows) and (B-C) Western blotting (n = 3). Densitometry analysis of each protein band was performed using the software Image J, and normalized to β-actin. (D) TG, TC, LDL-C, and HDL-C levels in the serum were measured (n = 5-6). (E) Lipid accumulation in the kidneys of rats was quantified by the TG quantification assay, (n = 5). (F) Oil red O staining (×400) was conducted to observe neutral lipid accumulation in kidneys. Data are presented as mean ± SD. *p < 0.05, **p < 0.01 versus DM + DMSO.
HIF-1α inhibition by YC-1 treatment alleviated tubular injury in diabetic kidneys
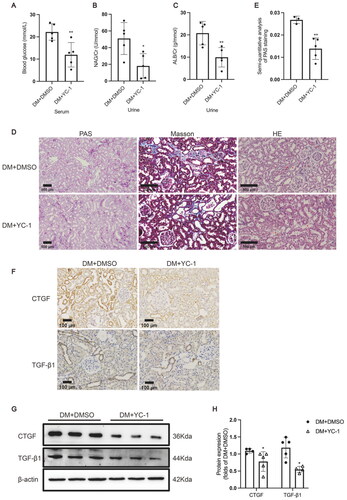
To further investigate whether HIF-1α inhibition improved tubular injury by decreasing excess lipid accumulation in diabetic kidneys, we examined the blood glucose level, urinary biochemical indexes, pathological structure, and profibrotic factor expression levels in the kidneys of the model rats. The blood glucose level in rats of the DM + YC-1 group was markedly decreased in comparison to the DM + DMSO group (). Notably, YC-1 treatment significantly decreased the urinary albumin creatinine ratio and NAG creatinine ratio of diabetic rats (), illustrating that YC-1 treatment reversed the glomerular filtration membrane injury and tubular injury in diabetic rat kidneys, which was further confirmed by the results of PAS staining showing a smaller area of damage in the renal tubules of diabetic rats (). HE staining and Masson staining showed that apoptosis of tubular epithelial cells and extracellular matrix deposition of diabetic kidneys were decreased in rats of DM + YC-1 group when compared to DM group (). As shown by the results of immunohistochemical staining and Western blotting, the expression levels of TGF-β1 and CTGF in the renal tubules of diabetic rats were markedly reduced by YC-1 treatment (), suggesting that HIF-1α activation might be involved in producing a profibrotic effect on renal tubules.
Figure 5. HIF-1α inhibition by YC-1 treatment alleviated tubular injury in diabetic kidneys. (A) The serum blood glucose level (n = 5), (B) urinary albumin/creatinine ratio (n = 5), and (C) urinary NAG/creatinine ratio (n = 5) were measured. (D) Histological changes in the renal tubules were detected by PAS staining (×100); Renal tubules with increased apoptosis were marked by asterisk in HE staining (×200); Extracellular matrix deposition was detected by Masson staining (blue area, ×200). (E) The damaged area in PAS staining was calculated by the software Image-Pro Plus (n = 3-5). (F) The protein expression of TGF-β1 and CTGF was detected by immunohistochemical staining (×200) and (G and H) Western blotting (n = 5). Densitometry analysis of each protein band was performed using the software Image J, and normalized to β-actin. Data are presented as mean ± SD. *p < 0.05, **p < 0.01 versus DM + DMSO.
Discussion
The kidneys are highly metabolically active and demand vast amounts of oxygen to generate sufficient ATP, which is mainly used for the tubules to reabsorb sodium ions and for glomerular filtration [Citation22]. Relative renal hypoxia occurs when the size of the kidneys is larger in early DN. Vinovskis et al. reported that adolescents with type 1 diabetes exhibit relative renal hypoxia in the earliest stage of DN, which is associated with albuminuria, elevated blood pressure, adiposity, and insulin resistance [Citation22]. HIF-1α is reportedly activated in the renal tubules as an adaptive response to hypoxia in the kidneys of STZ-treated diabetic rats [Citation16]. The current study firstly demonstrated that HIF-1α activation in RTECs can aggravate tubular injury in DN by inducing lipid accumulation.
There exists controversy regarding the influence of HIF-1α activation on the progression of DN. It was demonstrated that the conditional knockout of HIF-1α exacerbated kidney injury in diabetic mice, possibly by modulating mitochondrial dynamics by Heme oxygenase 1 upregulation [Citation23]. Persson et al. noted that HIF activation induced by diabetes-induced tissue hypoxia could mediate glomerulosclerosis and play a protective role by improving mitochondrial function, alleviating tubulointerstitial fibrosis, and attenuating proteinuria [Citation24]. Nevertheless, HIF-1α activation in the renal tubules has been associated with deleterious effects in DN progression in some other studies. Nayak et al. revealed that HIF-1α inhibition induced by YC-1 improved renal fibrosis in OVE26 diabetic mice [Citation25]. Compared to nondiabetic kidneys, higher HIF-1α expression and fibrosis were previously induced by unilateral ureteral obstruction in the kidneys of diabetic mice [Citation26], while HIF-1 inhibition attenuated fibronectin expression in vitro. Furthermore, Feng et al. detected increased HIF-1α and heme oxygenase-1 expression levels in the renal tubules of db/db mice, which was decreased by Ferrostatin-1 treatment, indicating that ferroptosis might aggravate injury to the renal tubules in diabetes by modulating the HIF-1α/heme oxygenase-1 pathway [Citation27]. Our study verified that HIF-1α activation induced by CoCl2 treatment worsened tubular injury and contributed to DN progression. We speculate that HIF-1α activation in the early stage of diabetes is protective by assisting the renal tubules to adapt to the hypoxic microenvironment, while persistent activation of HIF-1α caused by chronic hypoxia will inevitably lead to harmful effects due to its effect on energy metabolism.
Several studies using different animal disease models have reported that HIF-1α activation has a facilitatory effect on lipid accumulation. Sundelin et al. revealed that lipid deposition in clear-cell renal cell carcinoma was caused by an increased level of expression of the very low-density lipoprotein receptor, which was regulated by a pathological increase in HIF-1α [Citation28]. Leinonen and colleagues showed that increased HIF-1α expression induced by the knockout of prolyl 4-hydroxylase mediated the accumulation of lipid-containing lamellar bodies in the renal tubules of P4h-tm-/- mice [Citation29]. Ke and colleagues demonstrated that uncoupling protein 2 promoted tubulointerstitial fibrosis during ischemic kidney injury via the stimulation of lipid deposition and extracellular matrix accumulation, which was mediated by inducing the HIF-1α stabilization pathway in tubular cells [Citation14]. Recently, Cai et al. found that increased HIF-1α expression induced a switch from fatty acid utilization to glycolysis and lipid accumulation in the proximal tubules of diabetic kidney disease, which was nearly nullified by the inhibitor of the sodium-dependent glucose transporters 2 known as dapagliflozin, via inhibiting HIF-1α [Citation30]. Consistent with the above findings, the results of the current study confirmed that HIF-1α activation contributed to lipid accumulation in RTECs in both a DN rat model and in HK-2 cells.
Currently, small molecule inhibitors (hypoxia-inducible factor-prolyl hydroxylase inhibitors, HIF-PHIs) targeting prolyl hydroxylase have been used in the clinical treatment of renal anemia [Citation31–33]. HIF-PHIs promote erythropoietin expression by stabilizing HIF-2 so as to improve renal anemia [Citation33]. However, none of the HIF-PHIs are specific for HIF-2 which is the erythropoietic arm of response to hypoxia up till the present moment. Considering that HIF not only directly targets erythropoietin, but also extensively participates in other biological functions (including mitochondrial function, energy metabolism and so on) [Citation34], increasing attention should be paid on the non-erythropoietic effects caused by HIF-PHIs. A recent study reported that HIF stabilizers significantly reduced TC, HDL-C, and LDL-C levels without increasing the risk of death and cardiovascular events (including stroke, myocardial infarction, pulmonary hypertension, and dialysis initiation) in anemic CKD patients [Citation35]. However, it was observed in the present study that HIF-1α activation induced by CoCl2 treatment significantly upregulated the levels of serum TC, HDL-C, and LDL-C in diabetic rats, while also increasing the renal content of TG. It is suggested that the effect of HIF system activation on lipid metabolism may be disease-specific and complex. The effect of HIF stabilizers on blood and renal lipid contents in DN patients requires further study.
In this study, both the HIF-1α activator CoCl2 and its antagonist YC-1 were used to validate the damaging effect of HIF-1α activation on the renal tubules of diabetic rats. It was firstly demonstrated that HIF-1α activation in RTECs could aggravate tubular injury in DN by inducing lipid accumulation. Importantly, on the basis of our findings and those reported by others, we speculate that HIF-1α activation in RTECs might be a beneficial event in the early stage of DM, which then converts to an adverse event as the disease progresses. The limitation of this study is that the hypoxia detection tool (namely, pimonidazole adducts) was not used to observe renal hypoxia.
In conclusion, this study demonstrated that HIF-1α activation contributes to interstitial injury in DN by aggravating lipid accumulation in tubular epithelial cells. The precise mechanism of HIF-1α activation leading to lipid accumulation in diabetic kidneys requires further exploration.
Author contributions
Ze-bo Hu designed the work, performed the research, conducted the data analysis, and wrote the manuscript. Qian-wen Zhu, Ying Wang, Xue Deng and Ming-jun Zhou assisted in cell culture. Hui Yang, Ji-yuan Zhang, Hao Wang, and Hao-sen Wang assisted in conducting the animal experiments. Lin Wang, Cui Zhang, and Shu Li contributed reagents and conducted manuscript polishing.
Disclosure statement
The authors declare no conflicts of interest.
Data availability statement
All data used and analyzed during this study will be available from the corresponding author upon reasonable request.
Additional information
Funding
References
- Molitch ME, DeFronzo RA, Franz MJ, et al. Nephropathy in diabetes. Diabetes Care. 2004;27 Suppl 1: S79–S83. doi:10.2337/diacare.27.2007.s79.
- Heyman SN, Raz I, Dwyer JP, et al. Diabetic proteinuria revisited: updated physiologic perspectives. Cells. 2022;11(18):2917. doi:10.3390/cells11182917.
- Wang L, Chang JH, Buckley AF, et al. Knockout of TRPC6 promotes insulin resistance and exacerbates glomerular injury in Akita mice. Kidney Int. 2019;95(2):321–332. doi:10.1016/j.kint.2018.09.026.
- Su K, Yi B, Yao BQ, et al. Liraglutide attenuates renal tubular ectopic lipid deposition in rats with diabetic nephropathy by inhibiting lipid synthesis and promoting lipolysis. Pharmacol Res. 2020;156:104778. doi:10.1016/j.phrs.2020.104778.
- Cansby E, Caputo M, Gao L, et al. Depletion of protein kinase STK25 ameliorates renal lipotoxicity and protects against diabetic kidney disease. JCI Insight. 2020;5(24):e140483. doi:10.1172/jci.insight.140483.
- Rutledge JC, Ng KF, Aung HH, et al. Role of triglyceride-rich lipoproteins in diabetic nephropathy. Nat Rev Nephrol. 2010;6(6):361–370. doi:10.1038/nrneph.2010.59.
- Opazo-Ríos L, Mas S, Marín-Royo G, et al. Lipotoxicity and diabetic nephropathy: novel mechanistic insights and therapeutic opportunities. Int J Mol Sci. 2020;21(7):2632. doi:10.3390/ijms21072632.
- Thongnak L, Pongchaidecha A, Lungkaphin A. Renal lipid metabolism and lipotoxicity in diabetes. Am J Med Sci. 2020;359(2):84–99. doi:10.1016/j.amjms.2019.11.004.
- Yuan Y, Sun H, Sun Z. Advanced glycation end products (AGEs) increase renal lipid accumulation: a pathogenic factor of diabetic nephropathy (DN). Lipids Health Dis. 2017;16(1):126. doi:10.1186/s12944-017-0522-6.
- Hu ZB, Lu J, Chen PP, et al. Dysbiosis of intestinal microbiota mediates tubulointerstitial injury in diabetic nephropathy via the disruption of cholesterol homeostasis. Theranostics. 2020;10(6):2803–2816. doi:10.7150/thno.40571.
- Du W, Zhang L, Brett-Morris A, et al. HIF drives lipid deposition and cancer in ccRCC via repression of fatty acid metabolism. Nat Commun. 2017;8(1):1769. doi:10.1038/s41467-017-01965-8.
- Triantafyllou EA, Georgatsou E, Mylonis I, et al. Expression of AGPAT2, an enzyme involved in the glycerophospholipid/triacylglycerol biosynthesis pathway, is directly regulated by HIF-1 and promotes survival and etoposide resistance of cancer cells under hypoxia. Biochim Biophys Acta Mol Cell Biol Lipids. 2018;1863(9):1142–1152. doi:10.1016/j.bbalip.2018.06.015.
- Seo J, Yun JE, Kim SJ, et al. Lipid metabolic reprogramming by hypoxia-inducible factor-1 in the hypoxic tumour microenvironment. Pflugers Arch. 2022;474(6):591–601. doi:10.1007/s00424-022-02683-x.
- Ke Q, Yuan Q, Qin N, et al. UCP2-induced hypoxia promotes lipid accumulation and tubulointerstitial fibrosis during ischemic kidney injury. Cell Death Dis. 2020;11(1):26. doi:10.1038/s41419-019-2219-4.
- Sugahara M, Tanaka S, Tanaka T, et al. Prolyl hydroxylase domain inhibitor protects against metabolic disorders and associated kidney disease in obese type 2 diabetic mice. J Am Soc Nephrol. 2020;31(3):560–577. doi:10.1681/ASN.2019060582.
- Rosenberger C, Khamaisi M, Abassi Z, et al. Adaptation to hypoxia in the diabetic rat kidney. Kidney Int. 2008;73(1):34–42. doi:10.1038/sj.ki.5002567.
- Liu H, Li Y, Xiong J. The role of hypoxia-inducible factor-1 alpha in renal disease. Molecules. 2022;27(21):7318. doi:10.3390/molecules27217318.
- Hu ZB, Ma KL, Zhang Y, et al. Inflammation-activated CXCL16 pathway contributes to tubulointerstitial injury in mouse diabetic nephropathy. Acta Pharmacol Sin. 2018;39(6):1022–1033. doi:10.1038/aps.2017.177.
- Mehlem A, Hagberg CE, Muhl L, et al. Imaging of neutral lipids by oil red O for analyzing the metabolic status in health and disease. Nat Protoc. 2013;8(6):1149–1154. doi:10.1038/nprot.2013.055.
- Catrina SB, Zheng X. Hypoxia and hypoxia-inducible factors in diabetes and its complications. Diabetologia. 2021;64(4):709–716. doi:10.1007/s00125-021-05380-z.
- Yeo EJ, Chun YS, Cho YS, et al. YC-1: a potential anticancer drug targeting hypoxia-inducible factor 1. J Natl Cancer Inst. 2003;95(7):516–525. doi:10.1093/jnci/95.7.516.
- Vinovskis C, Li LP, Prasad P, et al. Relative hypoxia and early diabetic kidney disease in type 1 diabetes. Diabetes. 2020;69(12):2700–2708. doi:10.2337/db20-0457.
- Jiang N, Zhao H, Han Y, et al. HIF-1alpha ameliorates tubular injury in diabetic nephropathy via HO-1-mediated control of mitochondrial dynamics. Cell Prolif. 2020;53(11):e12909. doi:10.1111/cpr.12909.
- Persson P, Palm F. Hypoxia-inducible factor activation in diabetic kidney disease. Curr Opin Nephrol Hypertens. 2017;26(5):345–350. doi:10.1097/MNH.0000000000000341.
- Nayak BK, Shanmugasundaram K, Friedrichs WE, et al. HIF-1 mediates renal fibrosis in OVE26 type 1 diabetic mice. Diabetes. 2016;65(5):1387–1397. doi:10.2337/db15-0519.
- Mei S, Li L, Zhou X, et al. Susceptibility of renal fibrosis in diabetes: role of hypoxia inducible factor-1. Faseb J. 2022;36(8):e22477. doi:10.1096/fj.202200845R.
- Feng X, Wang S, Sun Z, et al. Ferroptosis enhanced diabetic renal tubular injury via HIF-1alpha/HO-1 pathway in db/db mice. Front Endocrinol (Lausanne). 2021;12:626390. doi:10.3389/fendo.2021.626390.
- Sundelin JP, Ståhlman M, Lundqvist A, et al. Increased expression of the very low-density lipoprotein receptor mediates lipid accumulation in clear-cell renal cell carcinoma. PLoS One. 2012;7(11):e48694. doi:10.1371/journal.pone.0048694.
- Leinonen H, Rossi M, Salo AM, et al. Lack of P4H-TM in mice results in age-related retinal and renal alterations. Hum Mol Genet. 2016;25(17):3810–3823. doi:10.1093/hmg/ddw228.
- Cai T, Ke Q, Fang Y, et al. Sodium-glucose cotransporter 2 inhibition suppresses HIF-1alpha-mediated metabolic switch from lipid oxidation to glycolysis in kidney tubule cells of diabetic mice. Cell Death Dis. 2020;11(5):390. doi:10.1038/s41419-020-2544-7.
- Chen N, Hao C, Liu BC, et al. Roxadustat treatment for anemia in patients undergoing long-term dialysis. N Engl J Med. 2019;381(11):1011–1022. doi:10.1056/NEJMoa1901713.
- Chen N, Hao C, Peng X, et al. Roxadustat for anemia in patients with kidney disease not receiving dialysis. N Engl J Med. 2019;381(11):1001–1010. doi:10.1056/NEJMoa1813599.
- Fishbane S, El-Shahawy MA, Pecoits-Filho R, et al. Roxadustat for treating anemia in patients with CKD not on dialysis: results from a randomized phase 3 study. J Am Soc Nephrol. 2021;32(3):737–755. doi:10.1681/ASN.2020081150.
- Semenza GL. Oxygen sensing, hypoxia-inducible factors, and disease pathophysiology. Annu Rev Pathol. 2014;9(1):47–71. doi:10.1146/annurev-pathol-012513-104720.
- Takkavatakarn K, Thammathiwat T, Phannajit J, et al. The impacts of hypoxia-inducible factor stabilizers on laboratory parameters and clinical outcomes in chronic kidney disease patients with renal anemia: a systematic review and meta-analysis. Clin Kidney J. 2023;16(5):845–858. doi:10.1093/ckj/sfac271.