
Abstract
Background
In recent years, the research on symptom management in peritoneal dialysis (PD) patients has shifted from a single symptom to symptom clusters and network analysis. This study collected and evaluated unpleasant symptoms in PD patients and explored groups of symptoms that may affect PD patients with a view to higher symptom management.
Methods
The symptoms of PD patients were measured using the modified Dialysis Symptom Index. The symptom network and node characteristics were assessed by network analysis, and symptom clusters were explored by factor analysis.
Results
In this study of 602 PD patients (mean age 47.8 ± 16.8 years, 47.34% male), most had less than 2 years of dialysis experience. Five symptom clusters were obtained from factor analysis, which were body symptom cluster, gastrointestinal symptom cluster, mood symptom cluster, sexual disorder symptom cluster, and skin-sleep symptom cluster. Itching and decreased interest in sex may be sentinel symptoms, and being tired or lack of energy and feeling anxious are core symptoms in PD patients.
Conclusions
This study emphasizes the importance of recognizing symptom clusters in PD patients for better symptom management. Five clusters were identified, with key symptoms including itching, decreased interest in sex, fatigue, and anxiety. Early intervention focused on these symptom clusters in PD patients holds promise for alleviating the burden of symptoms.
Hemodialysis (HD), peritoneal dialysis (PD), and kidney transplantation stand as the principal treatments for kidney failure. While both offer comparable survival rates in the short and long term, PD is often preferred due to its demonstrated benefits in health-related quality of life (HRQoL) and economic advantages over HD, as evidenced in multiple studies [Citation1–3]. This preference for PD is reflected in the policies and financial incentives implemented by various regions, including Thailand, Hong Kong, mainland China, Australia, New Zealand, and the USA, which promote the use of PD over HD [Citation4–6]. Globally, over 272,000 patients are currently undergoing PD, constituting about 11% of the entire dialysis population. Notably, the annual growth rate of PD users, estimated at around 8%, surpasses that of HD, which lingers around 6–7% [Citation7]. The preference for PD varies between patients and medical providers globally, influenced by lifestyle compatibility and healthcare infrastructure [Citation8]. In China, efforts are underway to expand PD access, addressing urban–rural disparities and aiming to enhance care for over 40,000 PD patients, about 20% of its dialysis population [Citation9].
Patients undergoing PD frequently experience a significant burden, not only from their treatment regimen but also from various distressing symptoms, including anorexia, nausea, vomiting, shortness of breath, confusion, and fatigue, among others [Citation10]. These adverse symptom experiences directly impact the patient’s HRQoL, healthcare utilization, and are associated with an increased risk of depression and mortality [Citation11–13]. Therefore, the early identification and effective management of these unpleasant symptoms in PD patients are crucial.
While existing research often focuses on individual symptoms [Citation14,Citation15], it is increasingly recognized that these symptoms frequently occur in clusters. In such clusters, one symptom may be primary, with others being secondary [Citation16]. The 2022 World Kidney Day emphasized the importance of HRQoL over mere quantity, advocating for the management of symptoms in chronic kidney disease (CKD) patients through the lens of symptom clusters [Citation17]. A symptom cluster is defined as the presence of two or more symptoms that are interconnected. These clusters form cohesive symptom sets, which are relatively independent of other clusters, potentially indicating distinct underlying symptom dimensions. Symptoms within a specific cluster tend to have stronger inter-correlations compared to those across different clusters. Importantly, symptoms within a cluster may not necessarily share a common etiological origin [Citation18]. Research has demonstrated that symptom clusters exert a greater impact on health outcomes than individual symptoms due to their synergistic effects on morbidity, mortality, and HRQoL [Citation19,Citation20]. Consequently, identifying and addressing these symptom clusters are a key strategy for implementing effective symptom management in PD patients [Citation21].
Dialysis patients typically report experiencing between 9 and 12 symptoms concurrently. Identifying symptom clusters in these patients is crucial, as it enables physicians to proactively inquire about additional symptoms, thus facilitating active prevention and management of these symptoms rather than merely reacting to them [Citation21]. However, research on symptom clusters in dialysis patients has predominantly focused on those undergoing HD [Citation22,Citation23]. Studies specifically examining symptom clusters in PD patients are less common, often limited by small sample sizes or conflated with HD patient data for analysis [Citation24,Citation25]. Given previous findings that the symptom profiles of PD and HD patients can differ significantly [Citation26,Citation27], it becomes essential to explore symptom clusters in PD patients to enable personalized symptom management.
Additionally, understanding the relationships between symptoms, and distinguishing between primary and secondary symptoms, are vital for targeted and efficient symptom management. Network analysis offers a valuable tool in this regard. It enables the construction of partial correlation models to describe relationships between unpleasant symptoms and their clusters, and visually represents the importance and complex associations of each symptom and cluster within the overall network [Citation28]. Combining factor analysis with network approaches enriches symptom cluster research by identifying clusters and exploring the intricate relationships between symptoms. Factor analysis reveals clusters based on symptom co-occurrence [Citation29], while network analysis provides insights into how individual symptoms within clusters interact and influence each other, identifying key symptoms for targeted management. This integrated approach offers a comprehensive view of symptom dynamics, enhancing our understanding and intervention strategies in clinical practice [Citation30]. Drawing from research on patients with mental health issues or cancer [Citation31,Citation32], this method aids healthcare professionals and researchers in pinpointing core, bridging, and sentinel symptoms. This can improve symptom management strategies, facilitating more focused and impactful interventions [Citation33].
Consequently, this study aims to: (1) gather and evaluate the range of unpleasant symptoms experienced by PD patients; (2) identify and analyze symptom clusters affecting PD patients using factor analysis; and (3) explore the interrelationships between these symptoms through network analysis.
1. Methods
We used STROBE Checklist for more rigorous study design and improved article quality.
1.1. Study design and participants
This study is a multicenter cross-sectional analysis conducted across 22 hospitals located in Sichuan, Gansu, Jiangxi, and the Inner Mongolia Autonomous regions of China. We employed convenience sampling for participant selection. Patients discharged from these hospitals were considered eligible to participate if they met the following inclusion criteria: (a) aged 18 years or older; (b) currently undergoing PD; and (c) able to provide informed consent. However, we excluded patients based on the following criteria: (a) presence of cognitive impairment; (b) diagnosis of functional or organic mental illness; (c) complications of uremia with severe cardiac, pulmonary, or other organ infection or injury; and (d) those who had undergone HD or received continuous kidney replacement therapy within the preceding three months.
1.1.1. Sample size calculation
As the rule of thumb for exploratory factor analysis [Citation34], the required sample size for this study was 5–10 times the number of variables. Considering the investigation of 20–30 symptoms in PD patients, the sample size was determined to be between 200 and 300 cases. The minimum sample size in the network analysis is determined by assuming N symptoms, using the formula N + [N × (n − 1)/2]. Considering symptoms with a prevalence of less than 10%, and assuming N ranges from 20 to 30, the estimated minimum sample size for our study was between 210 and 465 cases. Increasing the sample size can lead to more reliable analysis [Citation28].
1.1.2. Data collection
Data collection for this study occurred between June and September 2023 at the outpatient clinics of hospitals. Alongside sociodemographic data, the main emphasis was on evaluating the symptoms of PD patients, utilizing the Chronic Kidney Disease-Symptom Burden Index (CKD-SBI) for measurement. Trained registered nurses conducted the data collection, while researchers accessed participants’ clinical data through hospital information systems. Before data collection began, participants were informed about the study’s objectives, the anticipated completion time, their rights as participants, among other details. All respondents were required to provide their informed consent. The survey questions were completed independently by the participants and immediately returned to the researcher. In cases where clarification was needed, researchers read out the survey items in a quiet environment and explained the exact meaning of each item. Participants were assured of their right to withdraw from the study at any stage without facing any negative consequences. The participant recruitment flow diagram is shown in Supplementary Figure 1. This study received approval from the Human Research Ethics Committee at Sichuan University (No. 20231848).
1.2. Measurements
1.2.1. Sociodemographic and clinical data
For the collection of sociodemographic data, we utilized a self-designed basic information form. This form was specifically crafted to capture a comprehensive range of participant information. The recorded data included marital status, education level, nationality, gender, and age. Additionally, we collected information on each participant’s employment status, medical insurance coverage, duration of PD treatment, and primary kidney disease.
1.2.2. Symptoms of patients with PD
To assess the symptoms experienced by patients undergoing PD, we utilized the CKD-SBI [Citation35]. This instrument was specifically chosen for its capability to comprehensively evaluate the symptoms encountered by PD patients over the course of the past month. The CKD-SBI employs a prevalence scale to determine the presence or absence of each symptom (yes/no). For symptoms identified as present, the CKD-SBI further evaluates their distress, severity, and frequency. These four dimensions – prevalence, distress, severity, and frequency – are each rated on a 0–10 scale. Specifically, participants rate the ‘distress’ aspect from ‘none’ to ‘very much,’ ‘severity’ from ‘none’ to ‘very severe,’ and ‘frequency’ from ‘never’ to ‘constant.’ The possible scores for each symptom range from 0 to 32, allowing for a maximum total score of 320 for the complete scale (ranging from 0 to 320). The total CKD-SBI score is calculated by summing the scores of each subscale and multiplying by a constant of 0.1008, yielding a total score range from 0 to 100. A score of 100 represents the highest possible symptom burden. Importantly, we also recorded and included in the statistical analysis any additional symptoms reported by patients that were not covered by the CKD-SBI. The reliability of the CKD-SBI in our study was confirmed with Cronbach’s alpha of 0.87.
1.3. Statistical analysis
For statistical analyses, we utilized SPSS Statistics for Windows, version 26.0 (SPSS Inc., Chicago, IL). The sociodemographic characteristics of participants and symptom information were described using means, standard deviations (SDs), and proportions. To ensure the robustness and validity of our analysis, we made a decision to exclude symptoms that had a prevalence of less than 10% from further analysis [Citation36]. As a result of our preliminary analysis, a total of 28 symptoms were identified and selected for more in-depth examination. To ensure the statistical robustness of our factor analysis aimed at identifying symptom clusters, we determined that a sample size of 602 cases would be adequate. The creation of these symptom clusters was based on the total scores of symptom experiences reported by participants. For the factor analysis, we employed the spindle factorization method coupled with the maximum variance rotation method. This approach was used to extract eigenvalues greater than 1. After conducting 25 iterations, symptoms that demonstrated a factor loading higher than 0.45 were categorized into distinct symptom clusters. Ultimately, this process led to the identification of various symptom clusters encompassing 22 symptoms in total.
1.3.1. Network analysis
We followed the statistical procedure described by Fried and coworkers [Citation37] and conducted the analysis in four steps: network estimation, network inference, network stability, and network comparison. All network analyses were carried out in R version 3.3.1 in RStudio 1.0.136. We used the R package qgraph [Citation38] to visualize all networks.
1.3.1.1. Network estimation
To explore and visually depict the relationships between symptoms, a network analysis was carried out using the 22 identified symptoms. In this network analysis framework, each variable (symptom) is represented as a node, and the relationships or associations between these variables are illustrated as edges connecting the nodes. The thickness of each edge in the network corresponds to the strength of the association between the connected nodes. This strength indicates the level of interconnectivity among the symptoms. It is important to note that these connections can manifest in two ways: directly between two variables or indirectly, mediated through other variables in the network. Such an analysis provides a comprehensive view of how symptoms are interrelated in the context of PD.
1.3.1.2. Network inference
In our network analysis, three key node centrality indices – strength, closeness, and betweenness – were computed to quantitatively describe the structural importance of each node (symptom) within the network [Citation39]. The ‘strength’ of a node quantifies its direct connections with other symptoms, representing the node’s potential influence within the network. The ‘closeness’ measures the reciprocal of the average distance from a node to all other nodes, indicating the centrality of a symptom in the network. Meanwhile, ‘betweenness’ is a measure of the number of shortest paths that pass through a node, highlighting its role as a bridge within the network structure. Symptoms that exhibited the highest values in these centrality coefficients were identified as core symptoms in the network. In light of previous research findings that suggest the strength centrality ranking is more reliable, our subsequent analysis in this report primarily focused on the strength centrality of nodes. This approach allows for a more robust understanding of the most influential symptoms within the network of PD patients.
1.3.1.3. Network stability
We utilized the ‘bootnet’ package in R to verify the stability of our symptom networks. This involved bootstrapping 95% confidence intervals for edge weights and calculating the correlation-stability coefficient for centrality metrics, where values above 0.25 indicate moderate stability and above 0.5 strong stability. Additionally, we conducted edge-weights and centrality difference tests to compare networks effectively.
2. Results
2.1. Characteristics of participants
Our study analyzed data from 602 participants. The mean age was 47.8 ± 16.8 years, with 285 males and 317 females. The majority were Han ethnicity (96.35%), married (67.44%), and had been on dialysis for less than 2 years (51.83%). Only a small proportion (1.99%) lacked health insurance and covered medical costs themselves. The mean of total score of symptoms burden was 10.97 ± 9.09 ().
Table 1. Demographic and clinical data of PD patients (N = 602).
2.2. Symptom prevalence, distress, severity, and frequency
Dry skin (40.37%) was the most common symptom, followed by decreased interest in sex (38.70%), and itching (38.54%). The most distressing symptom were difficulty becoming sexually aroused (1.96 ± 2.98) and decreased interest in sex (1.96 ± 3.04), with trouble falling asleep (1.85 ± 3.08) following closely. In terms of severity, difficulty becoming sexually aroused (2.26 ± 3.26) led, followed by decreased interest in sex (2.25 ± 3.30) and dry skin (2.00 ± 2.84). The most frequent symptoms were difficulty becoming sexually aroused (2.38 ± 3.44), decreased interest in sex (2.35 ± 3.42), and dry skin (2.08 ± 2.93). The prevalence rates of shortness of breath (9.14%), chest pain (7.14%), feeling nervous (3.32%), and nocturia (8.97%) were below 10%, leading to their exclusion from further analysis. Further details can be found in .
Table 2. Symptom prevalence, distress, severity, and frequency in PD patients (N = 602).
2.3. Summary of cluster symptoms
The factor loadings of each symptom and final symptom clusters are presented in . According to the results of our principal component analysis, we extract five independent symptom clusters, which were named based on the characteristics of symptoms in these symptom clusters. Other symptoms were not classified, as the burden was low. Cluster 1 was body symptom cluster, which included eight symptoms: muscle cramps, restless legs, numbness or tingling in feet, feeling tired or lack of energy, bone or joint pain, headache, muscle soreness, and difficulty concentrating. Cluster 2 was gastrointestinal (GI) symptom cluster, which included three symptoms: nausea, vomiting, and decreased appetite. Cluster 3 was mood symptom cluster, which included five symptoms: worrying, feeling irritable, feeling sad, feeling anxious, and depression. Cluster 4 was sexual disorder symptom cluster, which included two symptoms: decreased interest in sex, difficulty become sexual aroused. Cluster 5 was skin and sleep symptom cluster, which included four symptoms: dry skin, itching, trouble falling asleep, and trouble staying asleep. Constipation, diarrhea, muscle cramps, swelling in legs, dizziness, and cough exhibited low factor loadings across all clusters, indicating they should be considered individual symptoms rather than components of a symptom cluster [Citation40].
Table 3. Factor loading of total symptom score in PD patients (N = 602).
2.4. Network analysis
2.4.1. Overall network estimation
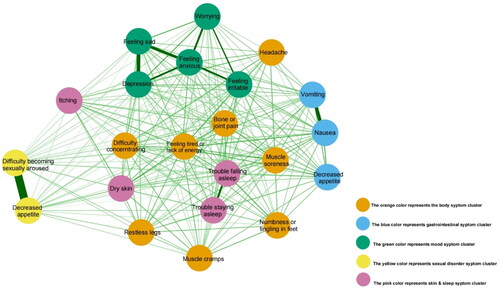
The network model, as depicted in , represents each symptom as a distinct node. Nodes of the same color indicate symptoms belonging to the same cluster, with the exception of items within the body symptom cluster which exhibit wide dispersion. As the network shows, decreased interest in sex had a strong connection with difficulty becoming sexually aroused; nausea had a strong connection with vomiting and a moderate connection with decreased appetite; trouble staying asleep and trouble falling asleep had a moderate connection. Worrying, feeling irritable, feeling sad, feeling anxious, depression identified as mood symptoms cluster, had strong connection with each other’s. Dry skin and itching had moderate connection with each other, but weak connection with trouble falling asleep and trouble staying asleep. Furthermore, the nodes within the cluster of body symptoms showed weak interconnections among each other, including muscle cramps, restless legs, numbness or tingling in feet, feeling tired or lack of energy, and bone or joint, etc.
Figure 1. Network relationship map of symptoms in PD patients. This figure illustrates the network of 22 symptom connections in PD patients, highlighting significant relationships: a strong link between decreased sexual interest and arousal difficulties, foam urine’s strong tie to nocturia and moderate association with itching and dry skin, facial edema’s moderate link to leg swelling, and the moderate connection between frequent waking and sleep initiation troubles. This map offers a concise overview of symptom interactions in PD.
2.4.2. Network inference
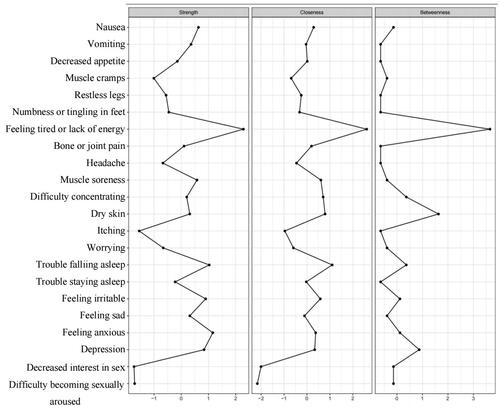
The results of centrality analyses () indicated that based on strength, feeling tired or lack of energy and feeling anxious were the most central symptoms. The result shows that their weights were higher in the network, their influence was strong, and they were the most important symptoms in the symptom network [Citation41].
Figure 2. Centrality analysis of symptoms in PD patients. The figure illustrates centrality analysis results for PD, pinpointing decreased interest in sex and difficulty becoming sexually aroused as the most central and influential symptoms based on strength. These key symptoms are highlighted for their significant roles within the network, marked by high weights and strong influence.
2.4.3. Network stability
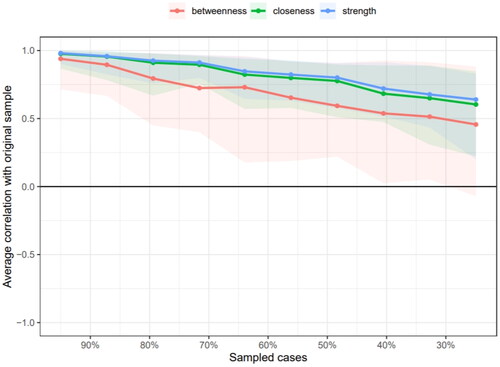
The network stability is shown in and . The red line indicates the edge weight values and the grey area the 95% CIs. Stability analyses indicated that the network was accurately estimated, with small to moderate confidence intervals around the edge weights. The correlation stability coefficients for strength, closeness, and betweenness centrality measures were 0.517, 0.439, and 0.05, respectively. This indicates that the strength and closeness centrality measures exceed the recommended threshold of 0.25 for stable estimation, affirming their reliability [Citation31,Citation42].
Figure 3. Bootstrap analysis results of the edge weights. This figure displays bootstrap analysis results of network in PD patients, with the red line showing sample values and the gray area indicating bootstrapped confidence intervals. The consistent narrow CIs across all edges, ordered by weight, confirm the accuracy of the network’s structure.
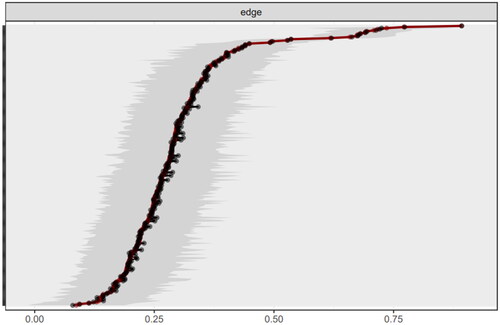
Figure 4. Correlation stability coefficient of symptom network in PD patients. The figure presents the PD symptom network’s stability, with strength correlation coefficients consistently above 0.5, affirming network reliability. It also shows strength centrality’s superior stability over closeness and betweenness measures.
3. Discussion
To our knowledge, this study is the first to explore symptom clusters in Chinese PD patients through network analysis, revealing the associations between various symptoms. Our findings indicate that dry skin was the most prevalent symptom among PD patients. Notably, sexual dysfunction, characterized by difficulty becoming sexually aroused and decreased interest in sex, emerged as the most burdensome symptoms experienced by patients.
The body symptom cluster identified in our study encompassed a range of symptoms: muscle cramps, restless legs, numbness or tingling in the feet, feeling tired or lack of energy, bone or joint pain, headaches, muscle soreness, and difficulty concentrating. These findings align with previous research and could be linked to various factors associated with PD. Potential influences include the adequacy of PD treatment, key biomarkers such as albumin, hemoglobin, and C-reactive protein levels, as well as prevalent comorbidities, notably cardiovascular disease and diabetes [Citation25,Citation43].
Yi et al. discovered that a substantial proportion, at least 82.2%, of PD patients reported experiencing one or more GI symptoms [Citation44]. Our study identified a cluster of GI symptoms, including nausea, vomiting, and decreased appetite, in PD patients. The exact cause of these GI symptoms in PD patients is not fully understood, but it may be linked to PD treatment specifics, such as the presence of glucose dialysate in the peritoneal cavity, which could affect gastric emptying, increase intra-abdominal pressure, and decrease lower esophageal sphincter pressure, thereby impacting GI function [Citation45,Citation46]. It is necessary to further study the influencing factors of GI symptoms in PD patients.
In our study, the mood symptom cluster included worrying, irritability, sadness, anxiety, and depression, likely linked to the substantial burden of disease treatment and symptom management [Citation47]. Prior research indicates that mood significantly predicts both physical and mental aspects of HRQoL more effectively than the number and severity of physical symptoms [Citation48]. Therefore, evaluating the emotional states, particularly depression and anxiety, in kidney disease patients is crucial for developing interventions aimed at mitigating the impact of CKD on HRQoL.
Our study identified a sexual dysfunction symptom cluster in PD patients, notably decreased interest in sex and difficulty becoming sexually aroused. Echoing earlier studies, a multicenter prospective study reported a high prevalence of these symptoms in PD patients: 69% for decreased sexual interest and 68% for difficulty in sexual arousal, marking them as particularly burdensome. Additionally, the prevalence and impact of these sexual symptoms appear to increase with the duration of dialysis treatment [Citation49]. Notably, this study found that decreased interest in sex, despite its high prevalence, had a low centrality index, indicating it might be a sentinel symptom in PD patients. Sexual dysfunction is closely linked with anxiety and depression, significantly impacting the HRQoL of these patients. However, this issue often remains overlooked and is seldom discussed between patients and physicians [Citation50,Citation51]. So, we should pay more attention to the sexual function-related symptoms of PD patients and actively take targeted measures to alleviate them.
The skin-sleep symptom cluster identified in our study includes dry skin, itching, and sleep difficulties. Prior research has linked dry skin and itching [Citation52], noting their impact on sleep quality [Citation53]. Itching, in particular, emerged as a sentinel symptom. Studies indicate that itching is an independent risk factor for depression in end-stage kidney disease patients [Citation54], while also exhibiting a significant association with compromised sleep quality [Citation55]. An international study involving 23,264 dialysis patients across 21 countries revealed that itching is correlated with higher mortality rates, increased cardiovascular and infection-related mortality, hospitalizations, a higher risk of skin infections, more frequent withdrawal from dialysis treatment, and lower HRQoL [Citation56]. Therefore, prioritizing skin care and symptom management, especially for itching, is essential in PD patients, as it can lead to various complications, including sleep disturbances, anxiety, and depression. Additionally, our network analysis revealed a close relationship between the body symptom cluster and the skin-sleep symptom cluster. This finding suggests the possibility of shared mechanisms or correlations between these two clusters, underscoring the need for further research to elucidate these connections.
Network analysis identified ‘feeling tired or lack of energy’ and ‘feeling anxious’ as core symptoms in PD patients. In our study, fatigue was reported by 35.38% of participants, a prevalence significantly lower than the 70–78% reported in other studies [Citation14,Citation57]. This discrepancy in fatigue rates may be attributed to various factors, including sleep quality, nutritional status, and depression of patients [Citation58,Citation59]. Nonetheless, our symptom network analysis identified fatigue as a core symptom in PD patients, aligning with previous findings [Citation60]. The Standardized Outcomes in Nephrology-Peritoneal Dialysis (SONG-PD) Consensus Workshop also recognized fatigue as a critical outcome for PD patients. Fatigue encompasses both physical and mental aspects, including depression, and significantly impacts patients’ daily living capabilities. It is regarded by many patients as a crucial issue to address [Citation60]. The prevalence of anxiety ranges from 22% to 53% [Citation61]. Anxiety might worsen prognosis by affecting health behaviors or altering physiological pathways, such as increasing norepinephrine levels, which can reduce peritoneal ion permeability and potentially lead to PD technique failure [Citation62]. Both fatigue and anxiety are linked to decreased HRQoL and increased hospitalization and mortality rates [Citation59,Citation61,Citation63]. Core symptoms, as opposed to marginal ones, are believed to have a greater overall impact on patient well-being [Citation56]. Therefore, early identification and management of fatigue and anxiety are crucial. Interventions like personalized exercise programs [Citation64], mindfulness therapy [Citation65], and aromatherapy [Citation66] can be effective in alleviating these symptoms in PD patients.
4. Limitations
This study has some limitations. First, this study’s participants were primarily from South-western China, potentially limiting the generalizability of findings to PD patients with different characteristics or from other regions. Future research should aim for a more diverse sample to enhance representativeness. Second, while we examined the association between symptom clusters and symptoms, further investigation is needed to understand the underlying mechanisms. Future studies should consider factors such as comorbidity, medication use, laboratory results, dialysis adequacy, and residual renal function. Third, the reliance on self-report scales may introduce bias or underreporting due to stigma or subjective response skewing. Lastly, the cross-sectional nature of this study constrains our ability to infer causality or generalize findings. Longitudinal studies are recommended to build more dynamic symptom networks.
5. Conclusions
Our findings underscore the importance of evaluating symptom clusters to enhance symptom management in PD patients. We identified five distinct clusters: body, GI, mood, sexual dysfunction, and skin-sleep. Notably, itching and decreased interest in sex emerged as sentinel symptoms, while fatigue and anxiety were identified as core symptoms. These findings aid healthcare providers in evaluating and prioritizing PD patient symptoms, potentially enabling early intervention and enhancing healthcare efficiency to mitigate patient symptom burden. Further research is crucial to understand how these insights can elevate HRQoL of patients and refine symptom management strategies.
Consent form
Informed consent was obtained from all subjects involved in the study.
Supplemental Material
Download MS Word (24.2 KB)Disclosure statement
No potential conflict of interest was reported by the author(s).
Data availability statement
The data that support the findings of this study are available from the corresponding author upon reasonable request.
Additional information
Funding
References
- Shrestha BM. Peritoneal dialysis or haemodialysis for kidney failure? JNMA. 2018;56(210):1–12. doi: 10.31729/jnma.3434.
- Mehrotra R, Devuyst O, Davies SJ, et al. The current state of peritoneal dialysis. J Am Soc Nephrol. 2016;27(11):3238–3252. doi: 10.1681/ASN.2016010112.
- Chuasuwan A, Pooripussarakul S, Thakkinstian A, et al. Comparisons of quality of life between patients underwent peritoneal dialysis and hemodialysis: a systematic review and meta-analysis. Health Qual Life Outcomes. 2020;18(1):191. doi: 10.1186/s12955-020-01449-2.
- Li PK-T, Chow KM. Peritoneal dialysis-first policy made successful: perspectives and actions. Am J Kidney Dis. 2013;62(5):993–1005. doi: 10.1053/j.ajkd.2013.03.038.
- Tantivess S, Werayingyong P, Chuengsaman P, et al. Universal coverage of renal dialysis in Thailand: promise, progress, and prospects. BMJ. 2013;346:f462. doi: 10.1136/bmj.f462.
- Bello AK, Okpechi IG, Osman MA, et al. Epidemiology of peritoneal dialysis outcomes. Nat Rev Nephrol. 2022;18(12):779–793. doi: 10.1038/s41581-022-00623-7.
- Li PK-T, Chow KM, Van de Luijtgaarden MWM, et al. Changes in the worldwide epidemiology of peritoneal dialysis. Nat Rev Nephrol. 2017;13(2):90–103.
- Chan CT, Blankestijn PJ, Dember LM, et al. Dialysis initiation, modality choice, access, and prescription: conclusions from a kidney disease: improving global outcomes (KDIGO) controversies conference. Kidney Int. 2019;96(1):37–47. doi: 10.1016/j.kint.2019.01.017.
- Li P, Cao X, Liu W, et al. Peritoneal dialysis care in mainland China: nationwide survey. JMIR Public Health Surveill. 2023;9:e39568. doi: 10.2196/39568.
- Himmelfarb J, Vanholder R, Mehrotra R, et al. The current and future landscape of dialysis. Nat Rev Nephrol. 2020;16(10):573–585. doi: 10.1038/s41581-020-0315-4.
- Scherer JS, Combs SA, Brennan F. Sleep disorders, restless legs syndrome, and uremic pruritus: diagnosis and treatment of common symptoms in dialysis patients. Am J Kidney Dis. 2017;69(1):117–128. doi: 10.1053/j.ajkd.2016.07.031.
- Kalantar-Zadeh K, Lockwood MB, Rhee CM, et al. Patient-centred approaches for the management of unpleasant symptoms in kidney disease. Nat Rev Nephrol. 2022;18(3):185–198. doi: 10.1038/s41581-021-00518-z.
- Natale P, Ju A, Strippoli GF, et al. Interventions for fatigue in people with kidney failure requiring dialysis. Cochrane Database Syst Rev. 2023;8(8):CD013074. doi: 10.1002/14651858.CD013074.pub2.
- Tian C, Zhang B, Liang W, et al. Fatigue in peritoneal dialysis patients and an exploration of contributing factors: a cross-sectional study. J Pain Symptom Manage. 2020;59(5):1074–1081.e2. doi: 10.1016/j.jpainsymman.2019.12.351.
- Natale P, Ruospo M, Saglimbene VM, et al. Interventions for improving sleep quality in people with chronic kidney disease. Cochrane Database Syst Rev. 2019;5(5):CD012625. doi: 10.1002/14651858.CD012625.pub2.
- Ahdoot RS, Kalantar-Zadeh K, Burton JO, et al. Novel approach to unpleasant symptom clusters surrounding pruritus in patients with chronic kidney disease and on dialysis therapy. Curr Opin Nephrol Hypertens. 2022;31(1):63–71. doi: 10.1097/MNH.0000000000000752.
- Rhee CM, Edwards D, Ahdoot RS, et al. Living well with kidney disease and effective symptom management: consensus conference proceedings. Kidney Int Rep. 2022;7(9):1951–1963. doi: 10.1016/j.ekir.2022.06.015.
- Kim H-J, McGuire DB, Tulman L, et al. Symptom clusters: concept analysis and clinical implications for cancer nursing. Cancer Nurs. 2005;28(4):270–282; quiz 283–284. doi: 10.1097/00002820-200507000-00005.
- Aktas A. Cancer symptom clusters: current concepts and controversies. Curr Opin Support Palliat Care. 2013;7(1):38–44. doi: 10.1097/SPC.0b013e32835def5b.
- Hsu H-T, Lin K-C, Wu L-M, et al. Symptom cluster trajectories during chemotherapy in breast cancer outpatients. J Pain Symptom Manage. 2017;53(6):1017–1025. doi: 10.1016/j.jpainsymman.2016.12.354.
- Lockwood MB, Chung S, Puzantian H, et al. Symptom cluster science in chronic kidney disease: a literature review. West J Nurs Res. 2019;41(7):1056–1091. doi: 10.1177/0193945918808766.
- Shim HY, Cho M-K. Factors influencing the quality of life of haemodialysis patients according to symptom cluster. J Clin Nurs. 2018;27(9–10):2132–2141. doi: 10.1111/jocn.13904.
- Lambert K, Caruana L, Nichols L. Nutrition impact symptom clusters in a cohort of indigenous Australian hemodialysis patients: new insights into the management of malnutrition? J Ren Nutr. 2023;33(3):490–494. doi: 10.1053/j.jrn.2022.06.004.
- Amro A, Waldum B, von der Lippe N, et al. Symptom clusters predict mortality among dialysis patients in Norway: a prospective observational cohort study. J Pain Symptom Manage. 2015;49(1):27–35. doi: 10.1016/j.jpainsymman.2014.04.005.
- Ng MSN, So WKW, Wong CL, et al. Stability and impact of symptom clusters in patients with end-stage renal disease undergoing dialysis. J Pain Symptom Manage. 2020;59(1):67–76. doi: 10.1016/j.jpainsymman.2019.08.013.
- Nadort E, Schouten RW, Luijkx X, et al. Symptom dimensions of anxiety and depression in patients receiving peritoneal dialysis compared to haemodialysis. Perit Dial Int. 2022;42(3):259–269. doi: 10.1177/08968608221086734.
- Dong R, Guo Z-Y, Ding J-R, et al. Gastrointestinal symptoms: a comparison between patients undergoing peritoneal dialysis and hemodialysis. World J Gastroenterol. 2014;20(32):11370–11375. doi: 10.3748/wjg.v20.i32.11370.
- Epskamp S, Fried EI. A tutorial on regularized partial correlation networks. Psychol Methods. 2018;23(4):617–634. doi: 10.1037/met0000167.
- Fu L, Feng X, Jin Y, et al. Symptom clusters and quality of life in gastric cancer patients receiving chemotherapy. J Pain Symptom Manage. 2022;63(2):230–243. doi: 10.1016/j.jpainsymman.2021.09.003.
- Zhou M, Gu X, Cheng K, et al. Exploration of symptom clusters during hemodialysis and symptom network analysis of older maintenance hemodialysis patients: a cross-sectional study. BMC Nephrol. 2023;24(1):115. doi: 10.1186/s12882-023-03176-4.
- Zhu Z, Sun Y, Kuang Y, et al. Contemporaneous symptom networks of multidimensional symptom experiences in cancer survivors: a network analysis. Cancer Med. 2022;12(1):663–673. doi: 10.1002/cam4.4904.
- Elliott H, Jones PJ, Schmidt U. Central symptoms predict posttreatment outcomes and clinical impairment in anorexia nervosa: a network analysis. Clin Psychol Sci. 2020;8:139–154. doi: 10.1177/2167702619865958.
- Zhu Z, Xing W, Hu Y, et al. Paradigm shift: moving from symptom clusters to symptom networks. Asia Pac J Oncol Nurs. 2022;9(1):5–6. doi: 10.1016/j.apjon.2021.12.001.
- Cold S, Cold F, Jensen M-B, et al. Systemic or vaginal hormone therapy after early breast cancer: a Danish Observational Cohort Study. J Natl Cancer Inst. 2022;114(10):1347–1354. doi: 10.1093/jnci/djac112.
- Almutary H, Bonner A, Douglas C. Arabic translation, adaptation and modification of the Dialysis Symptom Index for chronic kidney disease stages four and five. BMC Nephrol. 2015;16:36. doi: 10.1186/s12882-015-0036-2.
- Ye H, Zalesky A, Lv J, et al. Network analysis of symptom comorbidity in schizophrenia: relationship to illness course and brain white matter microstructure. Schizophr Bull. 2021;47(4):1156–1167. doi: 10.1093/schbul/sbab015.
- Epskamp S, Borsboom D, Fried EI. Estimating psychological networks and their accuracy: a tutorial paper. Behav Res Methods. 2018;50(1):195–212. doi: 10.3758/s13428-017-0862-1.
- Epskamp S, Cramer AOJ, Waldorp LJ, et al. Qgraph: network visualizations of relationships in psychometric data. J Stat Softw. 2012;48:1–18.
- Opsahl T, Agneessens F, Skvoretz J. Node centrality in weighted networks: generalizing degree and shortest paths. Social Netw. 2010;32(3):245–251. doi: 10.1016/j.socnet.2010.03.006.
- Zhu Z, Hu Y, Xing W, et al. Identifying symptom clusters among people living with HIV on antiretroviral therapy in China: a network analysis. J Pain Symptom Manage. 2019;57(3):617–626. doi: 10.1016/j.jpainsymman.2018.11.011.
- Feng ZT, S Z, Li X, et al. Relationship between upper-heat and lower-cold syndrome of generalized anxiety disorder based on hierarchical clustering and complex symptom network. J Capital Med Univ. 2022;43(3):398–406.
- Wang K, Diao M, Yang Z, et al. Identification of core symptom cluster in patients with digestive cancer: a network analysis. Cancer Nurs. 2023. doi: 10.1097/NCC.0000000000001280.
- You AS, Kalantar SS, Norris KC, et al. Dialysis Symptom Index burden and symptom clusters in a prospective cohort of dialysis patients. J Nephrol. 2022;35(5):1427–1436. doi: 10.1007/s40620-022-01313-0.
- Yi C, Wang X, Ye H, et al. Patient-reported gastrointestinal symptoms in patients with peritoneal dialysis: the prevalence, influence factors and association with quality of life. BMC Nephrol. 2022;23(1):99. doi: 10.1186/s12882-022-02723-9.
- Zuvela J, Trimingham C, Le Leu R, et al. Gastrointestinal symptoms in patients receiving dialysis: a systematic review. Nephrology. 2018;23(8):718–727. doi: 10.1111/nep.13243.
- Kim DJ, Kang WH, Kim HY, et al. The effect of dialysate dwell on gastric emptying time in patients on continuous ambulatory peritoneal dialysis. Perit Dial Int. 1999;19(Suppl. 2):S176–S178. doi: 10.1177/089686089901902S28.
- Musolino M, Presta P, Cianfrone P, et al. Self-reported physical inactivity and mood disturbances in end-stage kidney disease (ESKD) patients on chronic dialysis treatment. J Clin Med. 2023;12(22):7160.
- Turkmen K, Yazici R, Solak Y, et al. Health-related quality of life, sleep quality, and depression in peritoneal dialysis and hemodialysis patients. Hemodial Int. 2012;16(2):198–206. doi: 10.1111/j.1542-4758.2011.00648.x.
- de Rooij ENM, Meuleman Y, de Fijter JW, et al. Symptom burden before and after dialysis initiation in older patients. Clin J Am Soc Nephrol. 2022;17(12):1719–1729. doi: 10.2215/CJN.09190822.
- Yazıcı R, Yeksan M. Sexual dysfunction in female and male patients undergoing chronic ambulatory peritoneal dialysis. Int J Artif Organs. 2023;46(2):74–80. doi: 10.1177/03913988221145505.
- Theofilou PA. Sexual functioning in chronic kidney disease: the association with depression and anxiety. Hemodial Int. 2012;16(1):76–81. doi: 10.1111/j.1542-4758.2011.00585.x.
- Moniaga CS, Tominaga M, Takamori K. Mechanisms and management of itch in dry skin. Acta Derm Venereol. 2020;100(2):adv00024. doi: 10.2340/00015555-3344.
- Hu L, Ma Y, Wang L, et al. Analysis of nursing effect of comprehensive nursing intervention on hemodialysis patients with uremia. Contrast Media Mol Imaging. 2022;2022:5820707.
- Araujo SMHA, de Bruin VMS, Daher EdF, et al. Risk factors for depressive symptoms in a large population on chronic hemodialysis. Int Urol Nephrol. 2012;44(4):1229–1235. doi: 10.1007/s11255-011-0032-9.
- Trbojević-Stanković J, Stojimirović B, Bukumirić Z, et al. Depression and quality of sleep in maintenance hemodialysis patients. Srp Arh Celok Lek. 2014;142(7–8):437–443.
- Sukul N, Karaboyas A, Csomor PA, et al. Self-reported pruritus and clinical, dialysis-related, and patient-reported outcomes in hemodialysis patients. Kidney Med. 2021;3(1):42–53.e1. doi: 10.1016/j.xkme.2020.08.011.
- Murtagh FE, Addington-Hall J, Higginson IJ. The prevalence of symptoms in end-stage renal disease: a systematic review. Adv Chronic Kidney Dis. 2007;14(1):82–99. doi: 10.1053/j.ackd.2006.10.001.
- Maninet S, Nakrit B, Suttavat P. Prevalence and influencing factors of fatigue among patients undergoing continuous ambulatory peritoneal dialysis: a cross-sectional study. Belitung Nurs J. 2023;9(4):391–398. doi: 10.33546/bnj.2715.
- Guedes M, Wallim L, Guetter CR, et al. Fatigue in incident peritoneal dialysis and mortality: a real-world side-by-side study in Brazil and the United States. PLOS One. 2021;17(6):e0270214. doi: 10.1371/journal.pone.0270214.
- Manera KE, Johnson DW, Craig JC, et al. Establishing a core outcome set for peritoneal dialysis: report of the SONG-PD (Standardized Outcomes in Nephrology-Peritoneal Dialysis) Consensus Workshop. Am J Kidney Dis. 2020;75(3):404–412. doi: 10.1053/j.ajkd.2019.09.017.
- Schouten RW, Nadort E, Harmse V, et al. Symptom dimensions of anxiety and their association with mortality, hospitalization and quality of life in dialysis patients. J Psychosom Res. 2020;133:109995. doi: 10.1016/j.jpsychores.2020.109995.
- Griva K, Kang AWC, Yu ZL, et al. Predicting technique and patient survival over 12 months in peritoneal dialysis: the role of anxiety and depression. Int Urol Nephrol. 2016;48(5):791–796. doi: 10.1007/s11255-015-1191-x.
- Jhamb M, Argyropoulos C, Steel JL, et al. Correlates and outcomes of fatigue among incident dialysis patients. Clin J Am Soc Nephrol. 2009;4(11):1779–1786. doi: 10.2215/CJN.00190109.
- Ju A, Scholes-Robertson N, Johnson DW, et al. Patient-led identification and prioritization of exercise interventions for fatigue on dialysis: a workshop report. Clin Kidney J. 2021;14(3):831–839. doi: 10.1093/ckj/sfz200.
- Heuschkel K, Kuypers KPC. Depression, mindfulness, and psilocybin: possible complementary effects of mindfulness meditation and psilocybin in the treatment of depression. A review. Front Psychiatry. 2020;11:224. doi: 10.3389/fpsyt.2020.00224.
- Itai T, Amayasu H, Kuribayashi M, et al. Psychological effects of aromatherapy on chronic hemodialysis patients. Psychiatry Clin Neurosci. 2000;54(4):393–397. doi: 10.1046/j.1440-1819.2000.00727.x.