
Abstract
Emerging data have revealed that damage to tubular epithelial cell is a driving force in the progression of diabetic kidney disease (DKD). However, the specific mechanisms by which lipotoxicity contributes to the injury of these cells, thereby influencing the development of DKD, are yet to be fully understood. Here, we analyzed the GSE 30529 microarray datasets of human tubulointerstitial tissue samples from the Gene Expression Omnibus database (GEO). Concurrently, we conducted RNA-sequencing on palmitic acid (PA)-treated human renal proximal tubule epithelial cells (HK2 cells). After normalization, the differentially expressed genes (DEGs) were screened by R software and gene ontology (GO) enrichment analysis was conducted, and lysosomal-associated protein transmembrane 5 (LAPTM5) was finally selected. Our findings indicate that the expression of LAPTM5 was obviously increased in DKD patients, and the correlation between LAPTM5, and other clinical parameters of DKD was analyzed using the Spearman correlation analysis. The potential of LAPTM5 as a prognostic biomarker for DKD was further consolidated through receiver operating characteristic (ROC) analysis. To further verify the function of LAPTM5, we established mouse or in vitro systems mimicking DKD. The results showed that a consistent upregulation of LAPTM5, which was also found to be linked with inflammatory mediators within the context of DKD. Additionally, LAPTM5 silencing significantly downregulated mRNA expression of inflammatory factors in PA-treated HK2 cells. These results indicate that LAPTM5 is a potential biomarker and therapeutic treatment target for DKD. This discovery paves the way for future research and development of targeted interventions aimed at mitigating the progression of this prevalent condition.
1. Introduction
Diabetic kidney disease (DKD) is a prevalent complication among individuals with diabetes, with an estimated prevalence ranging from 30% to 40%, and it is a leading cause of end-stage renal disease, accounting for 30% to 50% of all cases [Citation1,Citation2]. The development of novel antidiabetic therapeutics, particularly those targeting newly identified molecules, enzymes, and receptors, represents a vital area of research for the effective management of type 2 diabetes mellitus (T2DM) [Citation3,Citation4]. Despite the implementation of various treatment strategies, such as stringent control of blood glucose, hyperlipidemia, and hypertension, there remains a paucity of effective interventions that can halt the progression of DKD [Citation5,Citation6]. Accumulating evidence suggests that tubular epithelial cells (TECs) are a driving force in DKD progression [Citation7,Citation8]. In the diabetic state, the TECs particularly vulnerable to metabolic disorders, including hyperglycemia and dyslipidemia, as well as inflammatory processes. These conditions can trigger the release of a multitude of cytokines that ultimately impact the trajectory of DKD [Citation9]. It has been observed that TECs are capable of producing a diverse array of cytokines, such as interleukin-1 beta (IL-1β), interleukin-6 (IL-6), and tumor necrosis factor-alpha (TNF-α) [Citation10], which contribute to the complex interplay of factors driving the disease forward. Therefore, the role of lipotoxicity in TECs injury and progression of DKD requires further investigation.
Metabolic disorders, especially glucotoxicity and lipotoxicity, are key factors that cause TECs injury in DKD [Citation11]. Elucidating the mechanisms by which glycolipid toxicity leads to cellular damage represents a significant frontier in diabetes research [Citation12,Citation13]. Previous studies have mainly focused on the role of glucotoxicity in the process of TECs injury and have found that hyperglycemia induced oxidative stress, the production of pro-inflammatory cytokines, and ultimately, cell death within these cells [Citation14–17]. However, lipotoxicity-induced TECs injury, a phenomenon frequently observed in diabetic patients, has not garnered the same level of attention. Few studies have shown that filtered free fatty acids (FFA) can accelerate the dysfunction of tubule by inducing mitochondrial dysfunction [Citation18,Citation19]. This highlights a critical gap in our understanding of DKD pathogenesis, where the contribution of lipotoxicity to TECs injury.
In the present study, we used multiple bioinformatic approaches and RNA sequencing to identify new functional genes associated with DKD. Through this process, we conducted a thorough analysis of differentially expressed genes (DEGs) and performed a Gene Ontology (GO) enrichment analysis. Lysosomal-associated protein transmembrane 5 (LAPTM5), a gene that has seldom been implicated in DKD. Through the use of quantitative real-time PCR (qRT-PCR), we were able to verify the differential expression of LAPTM5, leading to its selection for further study.LAPTM5 is a 30-kDa protein predominantly localized in lysosomes [Citation20] and reported to participate in critical biological processes such as immunity, cell death, and autophagy processes in many diseases [Citation21]. Despite its established roles in these contexts, the function of LAPTM5 within the framework of DKD remains largely unexplored [Citation22]. Previous studies showed that LAPTM5 may play a role in mitigating inflammation [Citation23, Citation24], and a key factor in the pathogenesis of DKD. This finding suggests that LAPTM5 could potentially represent a novel therapeutic target or biomarker for DKD.
DKD is also characterized by a heightened inflammatory burden, which is a critical factor in its pathogenesis [Citation25]. A multitude of inflammatory biomarkers, including C-reactive protein [Citation26], kidney injury molecule-1 [Citation27], omentin [Citation28], serum uric acid [Citation29], hemogram-derived inflammatory markers [Citation30], prognostic nutritional index [Citation31], systemic inflammatory index [Citation32], neuregulin [Citation33] and uric acid/HDL cholesterol ratio [Citation34], have been identified in association with DKD. Our findings extend to the molecular level, where LAPTM5 exhibited a positive correlation with key inflammatory cytokines (IL-1β, IL-6, and TNF-α) in the renal tissues of db/db mice and high-fat diet (HFD) and streptozotocin (STZ)-induced DKD models, as well as in PA-treated HK-2 cells, a human renal proximal tubular epithelial cell line. Moreover, we demonstrated that the silencing of LAPTM5 using small interfering RNA (siRNA) improved the inflammatory status of HK-2 cells. In summary, our study has preliminarily explored the mechanisms underlying lipotoxicity-induced renal TECs injury in DKD. Our results indicate that LAPTM5 is not only a significant diagnostic marker for the disease but also a promising target for therapeutic intervention.
2. Materials and methods
2.1. Microarray data collection
We gained Microarray data from the Gene Expression Omnibus (GEO) database (GEO, https://www.ncbi.nlm.nih.gov/geo/). The search keywords used were “diabetic kidney disease,” “tubulointerstitial,” and “Homo sapiens.” Finally, the microarray dataset GSE30529 was identified for further analysis. We downloaded the dataset from the Affymetrix GPL571 platform and selected 22 human tubulointerstitial tissue samples, including those of 10 DKD patients and 12 controls.
2.2. Identification of DEGs
Preprocessing steps for the data included log2 conversion and normalization. The data were analyzed using the “limma” software program (R software, version 4.0.5) to find genes that were differentially expressed (DEGs) in two groups, p < .05 and |log2FoldChange| > 1 were regarded as significant. Then, using the R software packages, “ggplot2” and “pheatmap” to create the PCA maps, volcano plots, and heat maps, and the Venn diagrams were shown using the Image GP online platform (www.ehbio.com/Cloud_Platform/front/).
2.3. Enrichment analysis
The Gene Ontology (GO) enrichment analysis is a common method for examining biological processes (BP), cellular components (CC), and molecular functions (MF). Following the division of DEGs into two groups, including the up DEGs and the down DEGs. DEG gene ontology analyses were conducted using the “clusterProfiler” package of R software (version 3.14.3).
2.4. Candidate gene validation
To validate the candidate genes, RT–PCR was utilized. The candidate gene’s predictive ability was assessed using ROC analysis, which was quantified by calculating the area under the ROC curve (AUC). The genes with AUC > 0.7 were considered diagnostic. ROC analysis curves were constructed using the HiPlot online platform (https://hiplot.com.cn/).
2.5. Animal study
We bought male C57BL/6J mice that were 8 weeks old from GemPharmatech (Nanjing, China). Every mouse was kept in a specific pathogen-free (SPF) housing with a 12-h light/dark cycle, a 24–26 °C ambient temperature, and a 50%–60% humidity level. Following a week of adaptable feeding, the mice in the DKD group were given a 12-week high-fat diet (HFD; Research Diets, Beijing, China; D12451), with 60% of their calories coming from fat, followed by intraperitoneal injection of 50 mg/kg STZ (streptozocin, Sigma, S0130) for five consecutive days. The control group mice were fed a chow diet (10% of calories derived from fat) and injected with citrate buffer. A Roche Glucose Analyzer was used to monitor blood glucose three days following the previous injection; mice with blood glucose levels above 16.7 mmol/L were considered diabetic. After receiving an injection of STZ for 12 weeks, all mice were euthanized, and samples were collected for further experiments. Using test kits (MIBio, ml025061, ml026283) and following the manufacturer’s protocol, the urine levels of microalbumin (MAU) and creatinine were measured in order to assess the renal function of mice. The total cholesterol (TC) and triglyceride (TG) levels in mouse serum were measured using commercial kits (Jiancheng, China). Furthermore, male db/db mice and db/m mice were purchased from GemPharmatech (Nanjing, China). At 12 weeks of age, the mice were euthanized and their kidneys were used in additional research. The Institutional Animal Care and Use Committee of Jiangnan University’s Medical School gave its approval to every animal experiment (approval number: JN. No 20220315c0301001[079]).
2.6. Histopathological analysis
Kidney tissues were fixed for 48 h in a 4% neutral formaldehyde solution, after which dehydration, transparency, wax dipping, and embedding were used to create 4 μm of paraffin sections for assessment of kidney damage. Finally, paraffin sections were stained with hematoxylin and eosin (H&E) and periodic acid-Schiff (PAS) to detect histopathological abnormalities. Three specimens were randomly selected from each group, and five different regions were observed at 400× magnification.
2.7. Cell culture and treatments
HK-2 cells (human renal proximal tubular cells) were purchased from the China Center for Type Culture Collection (Wuhan, China) and cultured in DMEM/F12 (Thermo Fisher Scientific, 11330032) supplemented with 10% fetal bovine serum (FBS, VivaCell Biotechnology, C04001) at 37 °C with 5% CO2 atmosphere. Palmitic acid (PA) was dissolved in ethanol absolutely by heating at 60 °C to yield a 50 mM stock solution. To investigate the effect of PA, HK-2 cells were incubated with 400 μM PA (PA group) or ethanol (Control group) in a culture medium for 24 h.
2.8. Transfection with small interfering RNA (siRNA)
Acorrding to the manufacturer’s instructions, HK-2 cells were transfected with 110 nM of LAPTM5 small interfering RNA (siRNA) for 48 h with the jetPRIME transfection reagent (Polyplus, 101000046) (siLAPTM5 group). Sequences of human LATPM5 siRNA were used: sence, AAGUGCCCACCUAUCUCAACUUCAA; anti-sence, UUGAAGUUGAGAUAGGUGGGCACUU. The control group (siControl group) was induced using universal negative control siRNA (GenePharma, A06001).
2.9. cDKDA library construction and RNA sequencing (RNA-seq)
Sequencing libraries were constructed using one microgram of RNA per sample. As directed by the reverse transcription kit, RNA was transformed into double-stranded cDKDA. Tn5 transposase was then used to digest and label the cDKDA. Finally, the HiFi PCR Mix for NGS was used to carry out an enrichment PCR. The libraries were measured using an Agilent 2100 bioanalyzer. The Illumina NovaSeq device was used to perform paired-end sequencing of the library (sequencing was carried out by GENEWIZ Biotech). STAR (http://code.google.com/p/rna-star/) was used to map reads to the homogenome. Genes displaying a > 1.5-fold change (p < .05) were judged to be significantly differentially expressed. The “limma” program was used to carry out a Gene Ontology (GO) enrichment analysis of differentially expressed genes (DEGs).
2.10. RNA isolation and qRT-PCR
Using the total RNA Isolation Kit V2 (Vazyme, RC112-01), total RNA was isolated from renal tissues and HK-2 cells in accordance with the manufacturer’s instructions. HiScript III All-in-one RT SuperMix Perfect for qPCR (Vazyme Biotech, R333-01) was employed to reverse-transcribe RNA in order to generate cDKDA. Hieff® qPCR SYBR Green Master Mix (Yeasen Biotech, 11201ES03) was utilized for qRT–PCR using a Roche LightCycler 480 II equipment. The 2−ΔΔCt technique was used to determine the relative mRNA expression levels, which were then adjusted to the β-actin mRNA expression level. and provide a list of the RT-qPCR primers utilized.
Table 1. Primer sequences of Mus musculus used for qRT-PCR.
Table 2. Primer sequences of Homo sapiens used for qRT-PCR.
2.11. Analysis of clinical indexes
The NephroSeq v5 online platform (http://v5.nephroseq.org) supplied the data that were used to investigate the clinical features of gene expression. We conducted a Pearson’s correlation study between glomerular filtration rate (GFR), proteinuria, and gene expression levels in human tubulointerstitial tissues of patients with DKD, as well as a comparison of gene expression between these patients and normal controls.
2.12. Statistical analysis
The data are displayed as the mean ± standard error of the mean (SEM). For data analysis, R 3.6.0, SPSS 19.0, and GraphPad Prism 8.0.1 were utilized. To examine the variations between the two groups, the student’s t-test was employed. At p < .05, statistical significance was established.
3. Results
3.1. Identification of DEGs between DKD and normal controls
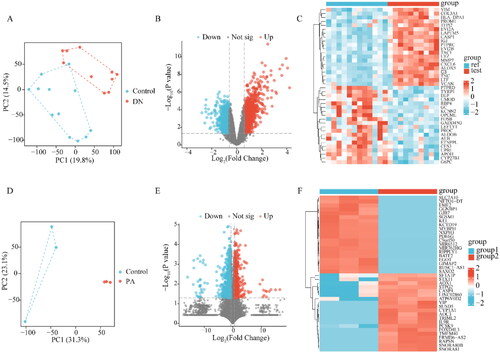
Microarray data were obtained from GSE30529. Between the patients with DKD and the normal controls, there was a discernible difference in the PCA plots (). Next, we identified the DEGs associated with diabetic tubule damage in GSE30529 with log (fold change) >1 or < −1 and p < .05 by using the “limma” software. The GSE30529 dataset contained 1635 DEGs, comprising 664 downregulated and 971 upregulated genes ( and ). Furthermore, to determine the key genes associated with abnormal lipid metabolism in proximal tubule cells, RNA-seq of PA-treated HK-2 and control cells was performed. PCA showed that the two groups were well separated (), 1445 DEGs including 658 up-regulated DEGs and 787 down-regulated DEGs in HK-2 cells were recognized ( and ) in HK-2 cells.
Figure 1. Identification of DEGs. (A) PCA plot of dataset GSE30529. (B) Volcano plot of the GSE30529. (C)The heatmap of the top 20 significant up-regulated and down-regulated DEGs in GSE30529. (D) PCA plot of HK-2. (E) Volcano plot of DEGs in HK-2. (F) The heatmap of DEGs in HK-2. The red data points represent the upregulated genes and the blue data points represent the downregulated genes. DEGs: differentially expressed genes; PCA: principal component analysis; Ref: Control Group; Test: diabetic kidney disease, DKD; group1: Control Group of HK-2; group2: PA-induced Group of HK-2.
3.2. LAPTM5 is significantly increased in DKD
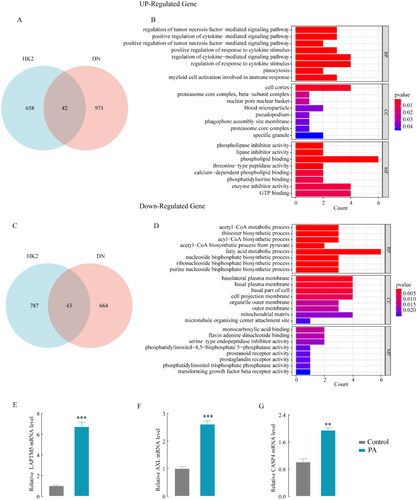
Co-analysis of the two datasets (GSE30529 and RNA-seq data of HK-2) identified 42 co-upregulated () and 43 co-downregulated () mRNAs. These co-upregulated or co-downregulated genes were implicated in tubular epithelial cells rather than in other kidney cells. The DEG functions had shown by GO enrichment analysis. As a result of GO analysis, the upregulated DEGs in BP were mainly enriched in cytokine-mediated signaling pathways (). The downregulated DEGs were mainly enriched in acetyl-CoA metabolic processes in BP (). Currently, siRNA drugs are being developed to treat multiple metabolic diseases, opening new avenues for innovative therapies [Citation35]. To better translate gene targets into clinical treatment, we focused on the GO term “biological process” of upregulated DEGs to identify potential target genes for the main mechanisms of diabetic tubule interstitial, as a result, 3 genes were obtained (LAPTM5, AXL, CASP4). We then explored the mRNA expression of the three genes in PA-treated HK-2 cells and found that the increase in LAPTM5 expression was the highest compared to the control group (). Therefore, LAPTM5 was selected for further analysis.
Figure 2. GO enrichment analysis of the DEGs and hub gene identification. Co-analysis the two datasets (GSE30529 and RNA-seq data of HK-2), co-upregulated genes in Venn diagrams (A) and Gene ontology analysis of the DEGs (B). Co-downregulated genes (C) and gene ontology analysis of the DEGs (D); hub gene LAPTM5 (E), AXL (F), CASP4, and (G) mRNA expression in PA-induced and control HK-2 cells. *p < .05, **p < .01, ***p < .001 and p < .05 was considered statistically significant.
3.3. LAPTM5 is a potential biomarker for the diagnosis of DKD
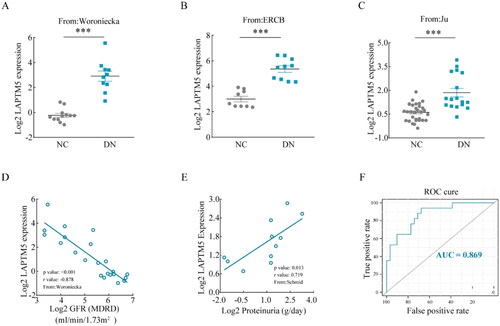
In order to confirm the outcomes of the bioinformatics analysis, relevant analyses were performed using the NephroSeq v5 online platform. DKD patients’ mRNA expression of LAPTM5 was substantially higher than that of normal controls (). In addition, a negative correlation between LAPTM5 and estimated glomerular filtration rate (eGFR) (, p < .001, r = −0.878), and a positive correlation between LAPTM5 and proteinuria (, p = .013, r = 0.719) were observed in patients with DKD, indicating that LAPTM5 could be crucial to the development of DKD. Furthermore, the ROC curve was plotted, the AUC was calculated to determine the diagnostic significance for DKD, and the result showed that the AUC for LAPTM5 was 0.869 (). These results imply that LAPTM5 may be a useful biomarker for DKD diagnosis.
Figure 3. Clinical characteristics of LAPTM5. (A–C) The Log2 mRNA expression of LAPTM5 in DKD patients compared with normal controls from different populations (Woroniecka, ERCB and Ju). Correlation between LAPTM5 mRNA expression with GFR (D) and proteinuria (E) in DKD patients. (F) ROC curve of LAPTM5 gene expression and AUC for DKD diagnosis. NC: normal control; DKD: diabetic kidney disease; eGFR: estimated glomerular filtration rate (eGFR); MDRD: modification of diet in renal disease; ROC: receiver operating characteristic; AUC: area under the curve. *p < .05, **p < .01, ***p < .001 and p < .05 were considered statistically significant.
3.4. Verification of LAPTM5 function in vivo
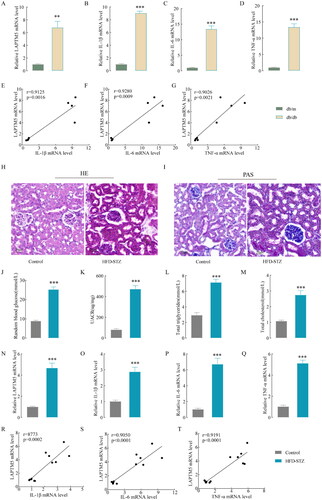
We measured the mRNA expression of LAPTM5 in the renal tissues of diabetic db/db mice in order to learn more about the workings of LAPTM5 in DKD and found that the mRNA expression was strikingly increased (). According to the GO enrichment analysis, LAPTM5 was mainly related to the biological processes of cytokines, tumor necrosis factor, and immune response. So, we examined the mRNA levels of inflammatory factors in renal tissues of db/db mice, including IL-1β, IL-6 and TNF-α (), and found they all increased markedly. Importantly, IL-1β (p = .0016, r = 0.9125), IL-6 (p = .0009, r = 0.9280), TNF-α (p = .0021, r = 0.9026) and LAPTM5 exhibited a positive correlation according to Pearson correlation analysis (). This correlation was further verified in HFD- and STZ-induced DKD mouse models. HE () and PAS () staining showed that glomerular volume and mesangial matrix expansion were increased in DKD mice. Additionally, the levels of blood glucose, UACR, TG, and TC increased significantly (), suggesting renal dysfunction and abnormal lipid metabolism in DKD mice. The mRNA levels of LAPTM5 () and inflammatory factors () were also markedly increased. As expected, Pearson correlation analysis showed a positive correlation between LAPTM5 mRNA level and IL-1β (p = .0002, r = 8773), IL-6 (p < .0001, r = 0.9050), or TNF-α (p < 0.0001, r = 0.9191) (). These results indicate that LAPTM5 is associated with inflammation in DKD.
Figure 4. LAPTM5 and inflammatory factors in DKD mouse models. (A) The renal tissue mRNA level of LAPTM5 in db/db and db/m. (B–D) The renal tissue mRNA level of IL-1β, IL-6 and TNF-α in db/db and db/m. (E–G) Correlation analysis of LAPTM5 and IL-1β, IL-6 and TNF-α in db/db and db/m (n = 4). (H) Representative images of hematoxylin and eosin staining in kidneys. (I) Representative images of periodic acid-Schiff (PAS)-stained kiDKDeys (Scale bar, 20 μm). (J–M) The levels of blood glucose, UACR, TG and TC. (N)The renal tissue mRNA level of LAPTM5 in HFD-STZ and control mice (n = 6). (O–Q) The renal tissue mRNA level of IL-1β, IL-6 and TNF-α in in HFD-STZ and control mice. (R–T) Correlation analysis of LAPTM5 and IL-1β, IL-6 and TNF-α in HFD-STZ and control mice. TG: total cholesterol; TG: total triglyceride; UACR (urine albumin creatine ratio). *p < .05, **p < .01, ***p < .001 and p < .05 was considered statistically significant.
3.5. LAPTM5 silencing markedly alleviates inflammation status in an in-vitro model
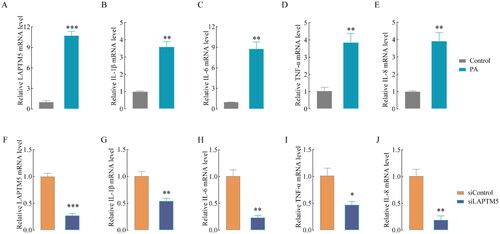
We further investigated whether LAPTM5 mediates lipid metabolism and tubule inflammation in DKD. HK-2 cells were treated with PA for 24 h, as a result, the mRNA levels of LAPTM5 () and inflammatory cytokines (IL-1β, IL-6, TNF-α, and IL-8) () increased dramatically. LAPTM5 knockdown (siLAPTM5 group) and control (siControl) cells were incubated with PA for 24 h. As shown in , LAPTM5 expression in the siLAPTM5 group decreased sharply compared to that in the siControl group, suggesting a high knockdown efficiency. Interestingly, silencing LAPTM5 obviously decreased the levels of IL-1β, IL-6, TNF-α and IL-8 (). These results demonstrate that LAPTM5 is a key gene that promotes the production of pro-inflammatory cytokines and is associated with lipid metabolism in diabetic kidney disease.
Figure 5. LAPTM5 silencing markedly alleviates inflammatory in HK-2 cells. The mRNA level of LAPTM5 (A), IL-1β (B), IL-6 (C), TNF-α (D) and IL-8 (E) in HK-2 cells after treated with or without 400 μM PA. The mRNA level of LAPTM5 (F) and IL-1β (G), IL-6 (H), TNF-α (I) and IL-8 (J) after silencing LAPTM5 or not (siControl). n = 3. *p < .05, **p < .01, ***p < .001 and p < .05 was considered statistically significant.
4. Discussion
In this study, we found that LAPTM5, AXL, and CASP4 were upregulated in the renal tissues of DKD-or PA-treated HK2 cells, highlighting their potential roles in the pathophysiology of DKD. We further verified the high expression of LAPTM5 and its association with eGFR and proteinuria using the Woroniecka, ERCB, and Ju databases. Furthermore, our in vivo studies utilizing HFD and STZ-induced DKD models, as well as db/db mice, demonstrated a consistent upregulation of LAPTM5. This upregulation was positively linked to the expression levels of pro-inflammatory cytokines, including IL-1β, IL-6, TNF-α, and IL-8, underscoring the potential pro-inflammatory role of LAPTM5 in the context of DKD. Our results indicated that the suppression of LAPTM5 significantly attenuated the expression of inflammatory cytokines induced by PA, suggesting a potential anti-inflammatory effect of LAPTM5 downregulation. These insights not only enhance molecular mechanisms but also offer a promising avenue for the development of novel therapeutic strategies targeting LAPTM5 to mitigate the DKD progression.
Several bioinformatic studies have been conducted to explore the role of TECs in DKD progression. Katalin Susztak and colleagues conducted a comprehensive genome-wide transcriptome analysis, revealing that inflammation and metabolic pathways are among the most significantly perturbed in fibrotic human kidney tubule samples [Citation36]. BBOX1 mRNA is mainly expressed in kidney tubular compartments, and bioinformatics-based analysis suggests that urinary BBOX1 is a potential biomarker of DKD [Citation37]. RNA sequencing of renal tissues from DKD mouse models has underscored the fatty acid metabolic process as a key area of enriched variation, highlighting the importance of lipid metabolism in the DKD pathogenesis [Citation38]. Additionally, urine cathepsin D, which is mainly expressed in proximal TECs, is correlated the decline in eGFR in individuals with type 1 diabetes [Citation37]. Bioinformatics analyses have also implicated several genes, including TYROBP, CTSS, LUM, and TLR7, in the regulation of the epithelial-mesenchymal transition (EMT) of TECs. This transition is a critical process that contributes to tubulointerstitial fibrosis, a hallmark of DKD [Citation39]. These bioinformatic studies have collectively expanded our knowledge of the intricate processes that drive progression of TECs injury. Understanding the molecular mechanisms that drive this transition is crucial for developing targeted therapeutic strategies to prevent or mitigate the DKD.
Lipotoxicity is increasingly recognized as a critical factor in the pathogenesis of DKD [Citation40–42]. The kidneys of DKD patients have higher lipid deposition and intracellular lipid droplets compared to those of normal individuals [Citation40, Citation43]. A robust correlation has been identified between dysregulated lipid metabolism and key pathological features of DKD, including inflammation, fibrosis, and a decline in eGFR [Citation40]. The increased uptake of free fatty acids (FFA) by podocytes results in FFA overload within the mitochondria, which in turn precipitates mitochondrial dysfunction and triggers cell apoptosis [Citation44,Citation45]. This process underscores the deleterious impact of lipotoxicity on cellular function and survival within the renal environment, influencing cellular processes, promoting inflammation, and exacerbating renal damage. Additionally, CD36-mediated lipid uptake in podocytes has been shown to activate the NLRP3 inflammasome, leading to the release of the pro-inflammatory cytokine IL-1β [Citation46]. Strategies aimed at inhibiting fatty acid synthesis and mitigating lipid accumulation have demonstrated promise in ameliorating DKD [Citation47,Citation48]. These findings suggest that interventions targeting lipid metabolism could offer a viable approach to improving renal outcomes in patients with diabetes.
In our investigation, we identified a significant positive correlation between LAPTM5 expression in TECs and the presence of proteinuria, as well as a decline in eGFR. Furthermore, our research revealed that LAPTM5 expression was positively linked to the levels of inflammatory cytokines, including IL-1β, IL-6, and TNF-α. In vitro experiments involving the silencing of LAPTM5 in HK2 cells demonstrated an improvement in the inflammatory status. This finding indicates that modulating LAPTM5 expression could potentially ameliorate the inflammatory component of DKD. A recent study also demonstrated that LAPTM5, which increases in obese patients, is a potential therapeutic target for obesity treatment [Citation49]. This observation further expands the potential therapeutic applications of LAPTM5 modulation beyond renal disease. Given the evidence of LAPTM5’s association with lipid toxicity, inflammation, and decreased renal function, it is plausible to consider LAPTM5 as a multifaceted treatment target for DKD. Further research and clinical trials are warranted to explore the therapeutic potential of LAPTM5 modulation in the context of DKD and other metabolic diseases.
LAPTM5, a multifunctional protein, has been implicated in several cellular processes, including autophagy [Citation50], lysosomal stabilization [Citation51], apoptosis [Citation52], and inflammation [Citation23,Citation53]. Its role as a pro-inflammatory factor has been well-established in macrophages [Citation53] and myocardial infarction [Citation23]. In this study, we found that LAPTM5 positively correlated with IL-1β、IL-6, TNF-α, and IL-8 in TECs of DKD. This finding suggests that LAPTM5 may play a pivotal role in the inflammatory processes associated with DKD, and thus, the potential regulatory mechanisms involving LAPTM5 and inflammation in this disease warrant further investigation. Moreover, bioinformatics analysis has identified LAPTM5 as a potential biomarker of left ventricular hypertrophy in hypertensive patients [Citation24]. Extending this insight, our research found that LAPTM5 was increased in DKD renal tissues. This observation opens up new avenues for future studies to examine the relationship between LAPTM5 levels in biological fluids, such as urine or serum, and the presence or severity of DKD.
Our research has demonstrated that silencing LAPTM5 significantly mitigates the inflammatory state induced by PA in HK-2 cells. This finding is further supported by evidence showing that LAPTM5 silencing also ameliorates the inflammatory response following myocardial infarction [Citation23]. These results position LAPTM5 as a potentially crucial intervention molecule in the management of renal inflammation associated in DKD. Given the implications of our findings, it is clear that further in-vivo validation experiments are necessary to substantiate the role of LAPTM5 in DKD pathogenesis and to explore its therapeutic potential fully. In conclusion, our study has unveiled a novel role for LAPTM5 in the context of lipotoxicity-induced injury to TECs in DKD. By delving into the mechanisms of DKD induced by lipotoxicity, we have identified LAPTM5 as a potential diagnostic marker and therapeutic target. This discovery not only enriches our understanding of the complex interplay between lipid metabolism and renal disease but also opens new horizons for the diagnosis and treatment of DKD. Future research endeavors in this area will be instrumental in refining therapeutic strategies and improving clinical outcomes for patients with DKD.
Author contributions
Data curation, Ciyou Huang and Jiayi Liu; Formal analysis, Xin Chen, Shenglong Zhu, Jiayi Liu and Jinbang Wang; Funding acquisition, Siyuan Cui; Investigation, Jiayi Liu; Methodology, Xin Chen and Shenglong Zhu; Project administration, Siyuan Cui; Resources, Ciyou Huang; Software, Xin Chen; Supervision, Siyuan Cui; Visualization, Shenglong Zhu; Writing–original draft, Jinbang Wang; Writing–review & editing, Ciyou Huang.
Ethics approval
The study protocol was approved by the Institutional Animal Care and Use Committee of the Medical School of Jiangnan University (approval number: JN. No 20220315c0301001[079]).
Consent for publication
Not applicable.
Disclosure statement
No potential conflict of interest was reported by the author(s).
Data availability statement
The datasets generated during and/or analyzed during the current study are available from the corresponding author on reasonable request.
Additional information
Funding
References
- Ruiz-Ortega M, et al. Special issue: diabetic kidney disease: diagnosis, prevention and treatment. J Clin Med. 2020;9(3):813. doi: 10.3390/jcm9030813.
- Gupta S, Dominguez M, Golestaneh L. Diabetic kidney disease: an update. Med Clin North Am. 2023;107(4):1–12. doi: 10.1016/j.mcna.2023.03.004.
- Sever B, Altıntop MD, Demir Y, et al. An extensive research on aldose reductase inhibitory effects of new 4H-1,2,4-triazole derivatives. J Mol Struct. 2021;1224:129446. doi: 10.1016/j.molstruc.2020.129446.
- Sever B, et al. Identification of a new class of potent aldose reductase inhibitors: design, microwave-assisted synthesis, in vitro and in silico evaluation of 2-pyrazolines. Chem Biol Interact. 2021;345:109576.
- Demir Y, Köksal Z. Some sulfonamides as aldose reductase inhibitors: therapeutic approach in diabetes. Arch Physiol Biochem. 2022;128(4):979–984.
- Akdağ M, Özçelik AB, Demir Y, et al. Design, synthesis, and aldose reductase inhibitory effect of some novel carboxylic acid derivatives bearing 2-substituted-6-aryloxo-pyridazinone moiety. J Mol Struct. 2022;1258:132675. doi: 10.1016/j.molstruc.2022.132675.
- Liu BC, et al. Renal tubule injury: a driving force toward chronic kidney disease. Kidney Int. 2018;93(3):568–579.
- Tsai Y-C, Kuo M-C, Hung W-W, et al. Proximal tubule-derived exosomes contribute to mesangial cell injury in diabetic kidney disease via miR-92a-1-5p transfer. Cell Commun Signal. 2023;21(1):10. doi: 10.1186/s12964-022-00997-y.
- Chen SJ, et al. Crosstalk between tubular epithelial cells and glomerular endothelial cells in diabetic kidney disease. Cell Prolif. 2020;53(3):e12763.
- Zhi D, Zhang M, Lin J, et al. GPR120 ameliorates apoptosis and inhibits the production of inflammatory cytokines in renal tubular epithelial cells. Inflammation. 2021;44(2):493–505. doi: 10.1007/s10753-020-01346-2.
- Opazo-Ríos L, et al. Lipotoxicity and diabetic kidney disease: novel mechanistic insights and therapeutic opportunities. Int J Mol Sci. 2020;21(7):2632. doi: 10.3390/ijms21072632.
- Palabıyık E, et al. Assessment of hypolipidemic and anti-inflammatory properties of walnut (Juglans regia) seed coat extract and modulates some metabolic enzymes activity in triton WR-1339-induced hyperlipidemia in rat kidney, liver, and heart. J Mol Recognit. 2023;36(3):e3004.
- Sulumer AN, Palabıyık E, Avcı B, et al. Protective effect of bromelain on some metabolic enzyme activities in tyloxapol-induced hyperlipidemic rats. Biotechnol Appl Biochem. 2024;71(1):17–27.
- Eleftheriadis T, Pissas G, Tsogka K, et al. A unifying model of glucotoxicity in human renal proximal tubular epithelial cells and the effect of the SGLT2 inhibitor dapagliflozin. Int Urol Nephrol. 2020;52(6):1179–1189. doi: 10.1007/s11255-020-02481-3.
- Zhao X, Liu G, Shen H, et al. Liraglutide inhibits autophagy and apoptosis induced by high glucose through GLP-1R in renal tubular epithelial cells. Int J Mol Med. 2015;35(3):684–692. doi: 10.3892/ijmm.2014.2052.
- Eleftheriadis T, et al. Dapagliflozin prevents high-glucose-induced cellular senescence in renal tubular epithelial cells. Int J Mol Sci. 2022;23(24):16107. doi: 10.3390/ijms232416107.
- Kim YJ, Kim YA, Yokozawa T. Attenuation of oxidative stress and inflammation by gravinol in high glucose-exposed renal tubular epithelial cells. Toxicology. 2010;270(2-3):106–111. doi: 10.1016/j.tox.2010.02.001.
- Weinberg JM. Lipotoxicity. Kidney Int. 2006;70(9):1560–1566. doi: 10.1038/sj.ki.5001834.
- Ruggiero C, Elks CM, Kruger C, et al. Albumin-bound fatty acids but not albumin itself alter redox balance in tubular epithelial cells and induce a peroxide-mediated redox-sensitive apoptosis. Am J Physiol Renal Physiol. 2014;306(8):F896–906. doi: 10.1152/ajprenal.00484.2013.
- Jiang L, Zhao J, Yang Q, et al. Lysosomal-associated protein transmembrane 5 ameliorates non-alcoholic steatohepatitis by promoting the degradation of CDC42 in mice. Nat Commun. 2023;14(1):2654. doi: 10.1038/s41467-023-37908-9.
- Zhang Z, Wang L, Wang Z, et al. Lysosomal-associated transmembrane protein 5 deficiency exacerbates cerebral ischemia/reperfusion injury. Front Mol Neurosci. 2022;15:971361. doi: 10.3389/fnmol.2022.971361.
- Guo M, Dai Y, Jiang L, et al. Bioinformatics analysis of the mechanisms of diabetic kidney disease via novel biomarkers and competing endogenous RNA network. Front Endocrinol (Lausanne). 2022;13:934022. doi: 10.3389/fendo.2022.934022.
- Song Z, et al. Suppression of lysosomal-associated protein transmembrane 5 ameliorates cardiac function and inflammatory response by inhibiting the nuclear factor-kappa B (NF-κB) pathway after myocardial infarction in mice. Exp Anim. 2022;71(4):415–425.
- Li T, Wang W, Gan W, et al. Comprehensive bioinformatics analysis identifies LAPTM5 as a potential blood biomarker for hypertensive patients with left ventricular hypertrophy. Aging (Albany NY). 2022;14(3):1508–1528. doi: 10.18632/aging.203894.
- Zahid Kocak M, Aktas G, Erkus E, et al. Mean platelet volume to lymphocyte ratio as a novel marker for diabetic kidney disease. J Coll Physicians Surg Pak. 2018;28(11):844–847. doi: 10.29271/jcpsp.2018.11.844.
- Bilgin S, et al. Does C-reactive protein to serum albumin ratio correlate with diabetic kidney disease in patients with type 2 dIabetes MEllitus? The CARE TIME study. Prim Care Diabetes. 2021;15(6):1071–1074.
- Kin Tekce B, et al. Evaluation of the urinary kidney injury molecule-1 levels in patients with diabetic kidney disease. Clin Invest Med. 2014;37(6):E377–83.
- Tekce H, Tekce BK, Aktas G, et al. Serum omentin-1 levels in diabetic and nondiabetic patients with chronic kidney disease. Exp Clin Endocrinol Diabet. 2014;122(8):451–456. doi: 10.1055/s-0034-1375674.
- Kocak MZ, et al. Is uric acid elevation a random finding or a causative agent of diabetic kidney disease? Rev Assoc Med Bras. 1992; 2019. 65(9):1155–1160.
- Kocak MZ, Aktas G, Duman TT, et al. Monocyte lymphocyte ratio as a predictor of diabetic kidney injury in type 2 diabetes mellitus; the MADKID study. J Diabetes Metab Disord. 2020;19(2):997–1002. doi: 10.1007/s40200-020-00595-0.
- Aktas G. Association between the prognostic nutritional index and chronic microvascular complications in patients with type 2 diabetes mellitus. J Clin Med. 2023;12(18):5952. doi: 10.3390/jcm12185952.
- Taslamacioglu Duman T, Ozkul FN, Balci B. Could systemic inflammatory index predict diabetic kidney injury in type 2 diabetes mellitus? Diagnostics (Basel). 2023;13(12):2063. doi: 10.3390/diagnostics13122063.
- Kocak MZ, et al. Is neuregulin-4 a predictive marker of microvascular complications in type 2 diabetes mellitus? Eur J Clin Invest. 2020;50(3):e13206.
- Aktas G, Yilmaz S, Kantarci DB, et al. Is serum uric acid-to-HDL cholesterol ratio elevation associated with diabetic kidney injury? Postgrad Med. 2023;135(5):519–523. doi: 10.1080/00325481.2023.2214058.
- Friedrich M, Aigner A. Therapeutic siRNA: state-of-the-art and future perspectives. BioDrugs. 2022;36(5):549–571. doi: 10.1007/s40259-022-00549-3.
- Kang HM, Ahn SH, Choi P, et al. Defective fatty acid oxidation in renal tubular epithelial cells has a key role in kidney fibrosis development. Nat Med. 2015;21(1):37–46. doi: 10.1038/nm.3762.
- Zhou L-T, Lv L-L, Qiu S, et al. Bioinformatics-based discovery of the urinary BBOX1 mRNA as a potential biomarker of diabetic kidney disease. J Transl Med. 2019;17(1):59. doi: 10.1186/s12967-019-1818-2.
- Zhao J, He K, Du H, et al. Bioinformatics prediction and experimental verification of key biomarkers for diabetic kidney disease based on transcriptome sequencing in mice. PeerJ. 2022;10:e13932. doi: 10.7717/peerj.13932.
- Bai Y, Ma L, Deng D, et al. Bioinformatic identification of genes involved in diabetic kidney disease fibrosis and their clinical relevance. Biochem Genet. 2023;61(4):1567–1584. doi: 10.1007/s10528-023-10336-6.
- Herman-Edelstein M, Scherzer P, Tobar A, et al. Altered renal lipid metabolism and renal lipid accumulation in human diabetic kidney disease. J Lipid Res. 2014;55(3):561–572.
- Bobulescu IA. Renal lipid metabolism and lipotoxicity. Curr Opin Nephrol Hypertens. 2010;19(4):393–402.
- Mitrofanova A, et al. New insights into renal lipid dysmetabolism in diabetic kidney disease. World J Diabetes. 2021;12(5):524–540.
- Mitrofanova A, Merscher S, Fornoni A. Kidney lipid dysmetabolism and lipid droplet accumulation in chronic kidney disease. Nat Rev Nephrol. 2023;19(10):629–645. doi: 10.1038/s41581-023-00741-w.
- Kim JJ, Wilbon SS, Fornoni A. Podocyte lipotoxicity in CKD. Kidney. 2021;360(2(4):755–762.
- Hua W, Huang H-Z, Tan L-T, et al. CD36 mediated fatty acid-induced podocyte apoptosis via oxidative stress. PLoS One. 2015;10(5):e0127507. doi: 10.1371/journal.pone.0127507.
- Zhao J, Rui H-L, Yang M, et al. CD36-mediated lipid accumulation and activation of NLRP3 inflammasome lead to podocyte injury in obesity-related glomerulopathy. Mediators Inflamm. 2019;2019:8247280. doi: 10.1155/2019/8247280.
- Wang XX, et al. The farnesoid X receptor modulates renal lipid metabolism and diet-induced renal inflammation, fibrosis, and proteinuria. Am J Physiol Renal Physiol. 2009;297(6):F1587–96.
- Hou Y, Tan E, Shi H, et al. Mitochondrial oxidative damage reprograms lipid metabolism of renal tubular epithelial cells in the diabetic kidney. Cell Mol Life Sci. 2024;81(1):23. doi: 10.1007/s00018-023-05078-y.
- Yan K, Zhang P, Jin J, et al. Integrative analyses of hub genes and their association with immune infiltration in adipose tissue, liver tissue and skeletal muscle of obese patients after bariatric surgery. Adipocyte. 2022;11(1):190–201. doi: 10.1080/21623945.2022.2060059.
- Pan J, Zhang M, Dong L, et al. Genome-Scale CRISPR screen identifies LAPTM5 driving lenvatinib resistance in hepatocellular carcinoma. Autophagy. 2023;19(4):1184–1198. doi: 10.1080/15548627.2022.2117893.
- Yang X, et al. LCDR regulates the integrity of lysosomal membrane by hnRNP K-stabilized LAPTM5 transcript and promotes cell survival. Proc Natl Acad Sci U S A. 2022;119(5):e2110428119. doi: 10.1073/pnas.2110428119.
- Wang Y, et al. LAPTM5 mediates immature B cell apoptosis and B cell tolerance by regulating the WWP2-PTEN-AKT pathway. Proc Natl Acad Sci U S A. 2022;119(36):e2205629119.
- Glowacka WK, et al. LAPTM5 protein is a positive regulator of proinflammatory signaling pathways in macrophages. J Biol Chem. 2012;287(33):27691–27702.