
Abstract
Background
Osteoporosis in pre-dialysis chronic kidney disease (CKD) patients has been overlooked, and the risk factors of osteoporosis in these patients have not been adequately studied.
Objective
To identify risk factors for osteoporosis in pre-dialysis CKD patients and develop predictive models to estimate the likelihood of osteoporosis.
Methods
Dual-energy X-ray absorptiometry was used to measure bone mineral density, and clinical examination results were collected from 326 pre-dialysis CKD patients. Binary logistic regression was employed to explore the risk factors associated with osteoporosis and develop predictive models.
Results
In this cohort, 53.4% (n = 174) were male, 46.6% (n = 152) were female, and 21.8% (n = 71) were diagnosed with osteoporosis. Among those diagnosed with osteoporosis, 67.6% (n = 48) were female and 32.4% (n = 23) were male. Older age and low 25-(OH)-Vitamin D levels were identified as risk factors for osteoporosis in males. For females, older age, being underweight, higher bone alkaline phosphatase (NBAP), and advanced CKD (G5) were significant risk factors, while higher iPTH was protective. Older age, being underweight, and higher NBAP were risk factors for osteoporosis in the G1-4 subgroup. In the G5 subgroup, older age and higher NBAP increased the risk, while high 25-(OH)-Vitamin D or iPTH had protective effects. Nomogram models were developed to assess osteoporosis risk in pre-dialysis patients based on gender and renal function stage.
Conclusion
Risk factors for osteoporosis vary by gender and renal function stages. The nomogram clinical prediction models we constructed may aid in the rapid screening of patients at high risk of osteoporosis.
Introduction
With the increasing prevalence of chronic kidney disease (CKD) in China, there is growing recognition of the impact of CKD mineral bone disorder (CKD-MBD) among CKD patients. About 18% to 32% of CKD patients have combined osteoporosis. The risk of fracture is at least two times higher than in the general population, and eight times higher in patients with end-stage kidney disease [Citation1]. Research studies, including the Dialysis Outcomes and Practice Patterns Study (DOPPS), have revealed the heightened risk of fractures in individuals undergoing hemodialysis compared to the general population [Citation2–4]. In fact, the unadjusted relative risk of death for hemodialysis patients who sustained a fracture was 3.7 times higher than that of hemodialysis patients who did not sustain a fracture [Citation4]. Numerous epidemiological investigations have demonstrated that the progressive decline in bone mineral density among CKD patients significantly increases the risk of osteoporosis and fractures, resulting in greater morbidity, mortality, hospitalization costs, and overall economic burden [Citation5,Citation6]. However, the majority of studies have focused on dialysis patients, and there is a dearth of relevant data regarding pre-dialysis CKD patients [Citation7].
Within the CKD patients, bone biopsy is considered the gold standard for diagnosing and categorizing CKD-MBD. Nevertheless, its clinical utilization is limited due to concerns surrounding invasiveness, cost, and patient acceptance. In line with the 2017 KDIGO guidelines, bone densitometry plays a pivotal role in assessing fracture risk among CKD patients [Citation8], for the perturbations in bone and mineral metabolism precipitated by CKD represent additional contributory factors to the risk of fractures [Citation9–11]. Dual-energy X-ray absorptiometry (DXA) is the most commonly employed method for detecting bone mineral density and diagnosing osteoporosis. However, not all hospitals and patients have access to DXA, prompting the exploration of alternative clinical measures to predict the risk of osteoporosis.
For these reasons, we conducted a retrospective study on pre-dialysis CKD patients at the First Affiliated Hospital of Jinan University to investigate the risk factors for osteoporosis in pre-dialysis CKD patients in Guangzhou. Additionally, we formulated a clinical prediction model to help healthcare practitioners promptly identify CKD patients with an elevated propensity for developing osteoporosis.
Methods
Study population
The study participants were chosen from among the inpatients at the First Affiliated Hospital of Jinan University between September 2019 and September 2022. To be included in the study, subjects had to meet the following inclusion criteria simultaneously: (1) Age 18 years or older. (2) Diagnosis of CKD without undergoing dialysis. According to the KDIGO 2012 Clinical Practice Guideline for the Evaluation and Management of Chronic Kidney Disease, CKD was defined as the persistence of kidney structure or function abnormalities for more than 3 months, with implications for health. (3) Consent for the use of their clinical data and biological samples for research was obtained at the time of admission, and informed consent was signed.
The following exclusion criteria were applied: (1) patients diagnosed with acute renal decline during hospitalization; (2) history of malignancy; (3) patients who have used glucocorticoids or immunosuppressants for a prolonged period of time (>3 months) within the last 5 years; (4) regular hemodialysis or peritoneal dialysis treatment or previous kidney transplantation; (5) previous history of parathyroidectomy.
Measurement method
The retrospective analysis encompassed clinical and laboratory data, comprising blood routine examination, liver and renal function parameters, total cholesterol, triglyceride levels, calcium (Ca), phosphorus (P), serum magnesium (Mg), serum iron (Fe), transferrin, alkaline phosphatase (ALP), serum bone alkaline phosphatase (NBAP), plasma 25-(OH)-vitamin D, and intact parathyroid hormone (iPTH). Additionally, the estimated glomerular filtration rate (eGFR) was determined using the chronic kidney disease epidemiology collaboration creatinine (CKD-EPI) equation. The optimal PTH level in pre-dialysis patients with G3-G5 CKD is unclear [Citation12,Citation13], we defined iPTH >88 pg/mL as elevated by referring to the upper normal limit of the assay in our center. Based on the recommendations of the Institute of Medicine(US), 25-(OH)-vitamin D < 12ng/ml is defined as deficient, 12–20 ng/ml is defined as insufficient, and the normal range is ≥20ng/ml [Citation14]. According to China’s overweight and obesity guidelines, the Body Mass Index (BMI) categories are defined as follows: individuals falling within the range of 18.5 kg/m2 to less than 24.0 kg/m2 are classified as having a normal weight, those with a BMI less than 18.5 kg/m2 are considered underweight, and those with a BMI of 24 kg/m2 or greater are classified as overweight or obese [Citation15].
DXA scans were conducted utilizing a Lunar iDXA scanner (GE Healthcare, Chicago, IL, USA) in accordance with established imaging and positioning protocols. Quality control procedures according to manufacturer’s instructions prior to daily scanning. The acquisition and evaluation of the scans were carried out by a single trained technician. Our laboratory had previously documented precision, as determined from an assessment involving 30 volunteers, yielding a root mean square coefficient of variance of less than 0.8% [Citation16]. For postmenopausal women (≥50 years old) and men over 50 years old, low bone mass was considered with reference to the WHO bone mass diagnostic criteria, −2.5 < T-value < −1.0. T-value ≤ −2.5 was considered as osteoporosis. For premenopausal women (<50 years of age) and men under 50 years old, bone mineral density (BMD) levels were judged according to the ISCD osteoporosis diagnostic criteria using an ethnicity-specific Z-value, with a Z-value of ≤-2.0 being ‘below the expected range for the age group’ or low bone mass.
To facilitate subsequent analyses, patients were divided into different groups based on specific criteria. Following the KDIGO 2012 clinical practice guideline for the evaluation and management of CKD, patients were categorized into two groups: G1-G4 (eGFR ≥ 15 mL/min/1.73m2) and G5 (eGFR < 15 mL/min/1.73m2).
Statistical methods
The statistical analysis in this study was executed utilizing SPSS 27.0 software. For categorical variables, the χ2 test was employed, whereas continuous variables were subjected to analysis through the t-test for two independent samples. The indicators were analyzed by single-factor analysis, while referring to the actual clinical significance, relevant factors were selected after comprehensive consideration, and multivariable binary logistic regression analysis and prediction model were established, with a significance threshold of p < 0.05. Based on the results of multivariable binary logistic regression analyses, a nomograms model of the risk of developing osteoporosis in pre-dialysis patients was plotted using R studio software. The score of each independent influence factor was determined from the patient’s clinical data, and the predicted probability corresponding to its sum was the fracture risk for that patient. The effectiveness of the prediction model in predicting osteoporosis in pre-dialysis CKD patients was evaluated by plotting the receiver operating characteristic (ROC) curve. The model was externally validated using Bootstrap with a repeat sampling of 1000 and calibration curves were plotted on the basis of the validation results to assess the calibration of the model. Decision curve analysis evaluated the clinical benefits of the predictive models.
Result
Baseline characteristics of subjects
This investigation recruited 326 pre-dialysis CKD patients from Southern China, 174 (53.4%) were male and 152(46.6%) were female, and their clinical characteristics are delineated in Table S1. Within the cohort, a total of 71 patients were diagnosed with osteoporosis, 67.6% (n = 48) were female and 32.4% (n = 23) were male. The average age of the entire pre-dialysis cohort was 64 ± 15 years, with a mean BMI of 24.39 ± 5.63 kg/m2. Among the participants, 78.2% exhibited hypertension, while 50.9% were diagnosed with diabetes mellitus. The whole-body BMD averaged 1.06 ± 0.14 g/cm3, L1-L4 BMD is 1.06 ± 0.19 g/cm3, and femoral BMD is 0.78 ± 0.15 g/cm3 (as shown in ).
Table 1. Baseline characteristics of patients.
Osteoporosis was diagnosed in 71 (21.8%) patients in our cohort, including 48 (67.6%) females and 23 (32.4%) males. Basic characteristics of non-osteoporotic and osteoporotic patients are delineated in . There were significant differences in age and BMI between two groups, and no significant differences in the prevalence of comorbid hypertension or diabetes. ALP and D-dimer levels were higher in the osteoporosis group compared to the non-osteoporosis group (p < 0.05). In contrast, osteoporotic patients showed statistically significant reductions in TG, TCHOL and HGB.
In addition, Table S1 demonstrates there were no significant differences between genders concerning age, BMI, and the prevalence of combined hypertension or diabetes. Male patients displayed higher levels of creatinine (CREA), URIC, and cystatin-C (Cys-C) compared to their female counterparts (p < 0.05). The median 25-(OH)-Vitamin D level was 18.50 ng/ml in males and 19.50 ng/ml in females (no significant difference). The median iPTH levels were 63.27 pg/ml in females and 72.14 pg/ml in males (no significant difference). Conversely, female patients exhibited higher Ca levels (p < 0.05). DXA measurements revealed statistically significant reductions in whole-body BMD, lumbar BMD (L1-L4), and femoral BMD among female patients compared to males (p < 0.05). In the context of CKD progression, the primary consequence is the loss of cortical bone mass [Citation17,Citation18]. The femoral neck, which is rich in cortical bone, is particularly relevant in this regard. Taking this into consideration, we have designated femoral BMD as the dependent variable for our subsequent analysis.
Prediction model establishment in different genders
We employed binary logistic regression analysis to develop a predictive model for osteoporosis risk factors. The dependent variable in this study was defined as the presence of osteoporosis, with age, sex, BMI, Ca, P, 25-(OH)-vitamin D, eGFR staging, iPTH, and NBAP as independent variables (). Our analysis revealed that among male patients, age was identified as a risk factor for osteoporosis (OR: 1.11, 95% CI: 1.00–1.23), while 25-(OH)-vitamin D emerged as a key protective factor (OR: 0.83, 95% CI: 0.69–0.99). For female patients, age (OR: 1.18, 95% CI: 1.05–1.34), underweight (OR: 36.40, 95% CI: 1.15–1151.54), NBAP (OR: 1.44, 95% CI: 1.10–1.89), and G5 (OR: 11.04, 95% CI: 1.27–96.35) were identified as risk factors for osteoporosis. Among them, the higher the age and NBAP level, the higher the risk of renal osteoporosis. Additionally, iPTH was recognized as a protective factor for osteoporosis (OR: 0.98, 95% CI: 0.96–1.00).
Table 2. Binary logistic regression analysis of the correlation between relevant indicators and osteoporosis in pre-dialysis patients of different genders.
It is worth emphasizing that ALP contains several isoforms, with NBAP being one of them. Unlike ALP, NBAP more effectively reflects the formation and activity of osteoblasts. Meanwhile, ALP was included in the model analysis instead of NBAP (Tables S2, S3, Figures S1, and S2). The results indicated that the model constructed with NBAP significantly outperformed the one constructed with ALP.
Figure 1. The ROC curves and nomogram of predictive models for osteoporosis in patients of different genders. (A, B) The ROC curves and nomogram for male pre-dialysis patients. (C, D) The ROC curves and nomogram for female pre-dialysis patients. In the line corresponding to BMI, the number 1 represents normal weight (18.5 kg/m2≤BMI < 24.0 kg/m2), the number 2 represents underweight (BMI < 18.5 kg/m2), the number 3 represents overweight or obese (BMI ≥24 kg/m2). In the line segment corresponding to the stage of renal function, the number 1 represents the early stage of CKD (G1-G4), the number 2 represents the late stage of CKD (G5).
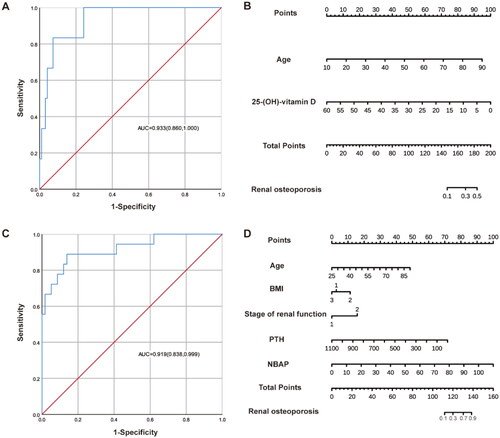
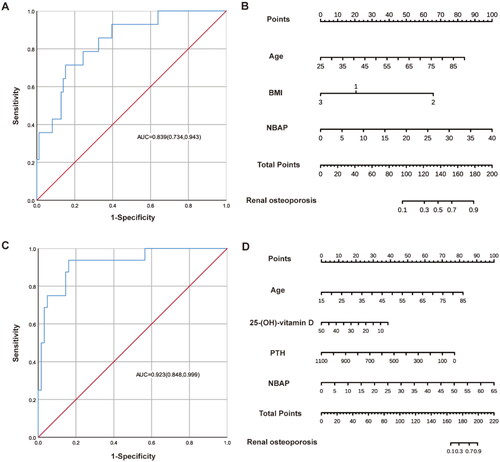
Figure 2. The ROC curves and nomograms of predictive models for osteoporosis in patients with different renal function stages. (A, B) The ROC curves and nomograms for G1-G4 patients. In the line corresponding to BMI, the number 1 represents normal weight (18.5 kg/m2≤BMI < 24.0 kg/m2), the number 2 represents underweight (BMI < 18.5 kg/m2), the number 3 represents overweight or obese (BMI ≥24 kg/m2). (C, D) The ROC curves and nomograms for G5 patients.
Prediction model establishment in patients with different renal function
Subsequently, we categorized patients based on their renal function and analyzed their risk factors separately (). Age (OR: 1.07, 95% CI: 1.01–1.13), NBAP (OR: 1.14, 95% CI: 1.02–1.28), and underweight (OR: 10.88, 95% CI: 1.28–92.46) were identified as risk factors for osteoporosis in G1-G4 pre-dialysis patients. Similarly, age (OR: 1.14, 95% CI: 1.04–1.24) and NBAP (OR: 1.32, 95% CI: 1.05–1.65) were found to be risk factors for osteoporosis in G5 pre-dialysis patients. The risk of renal osteoporosis increases with age and NBAP level. Moreover, 25-(OH)-vitamin D (OR: 0.85, 95% CI: 0.73–1.00) and iPTH (OR: 0.99, 95% CI: 0.97–1.00) were negatively associated with osteoporosis and acted as protective factors in G5 pre-dialysis patients.
Table 3. Binary logistic regression analysis on the correlation between related indicators and osteoporosis in pre-dialysis patients with different renal function stages.
Construction and evaluation of nomograms models
Based on the results of binary logistic regression analyses, nomogram models depicting the risk of osteoporosis in pre-dialysis patients of different genders and renal function stages were generated using R studio software (, and ). The scores of the independent influences were determined based on the clinical data of the patients, and the predicted probability corresponding to the sum of the independent influences represented the risk of osteoporosis for each patient. The results indicated that the area under the curve (AUC) of the ROC was 0.93 (95% CI: 0.86–1.00) for male patients and 0.92 (95% CI: 0.84–1.00) for female patients. In patients with different renal function stages, the AUC was 0.84 (95% CI: 0.73–0.94) for those with early CKD (G1–G4) and 0.92 (95% CI: 0.85–1.00) for patients with advanced CKD (G5).
As shown in Figures S3A, C, S4A, and C, the original model performance represented by the red line is basically the same as the model performance after bootstrap resampling represented by the blue line, and there is also consistency with the actual curve trend, so the model calibration is good. The results of the decision curves analysis showed that interventions for patients based on the predictions of the model yielded better clinical benefits up to a certain threshold probability (Figures S3B, D, S4B, and D).
Discussion
Conflicting reports have emerged regarding the factors related to BMD and the associated risk of fractures in patients with CKD [Citation19,Citation20]. Most studies have primarily focused on individuals undergoing dialysis, with limited attention paid to pre-dialysis CKD patients. Hence, the primary objective of this study was to investigate the factors associated with osteoporosis in pre-dialysis CKD patients residing in Guangzhou. Furthermore, we aimed to develop a nomogram prediction model tailored to different genders and renal function grades. The ultimate goal is to facilitate the identification of high-risk individuals for osteoporosis within primary healthcare settings where DXA measurement is not accessible, enabling timely intervention and treatment strategies.
In our research, we chose DXA to measure BMD in pre-dialysis CKD patients based on prior literature [Citation21,Citation22]. DXA is currently considered the gold standard for evaluating osteoporosis. Additionally, Carvalho et al. established a significant correlation between BMD measured by DXA and bone histomorphometric data obtained through bone biopsy in a pre-dialysis population [Citation23]. This strong correlation underscores the precision and accuracy of DXA in assessing BMD in patients with kidney disease. It is important to note that other techniques, such as quantitative ultrasound (QUS), high-resolution peripheral quantitative computed tomography (HR-pQCT), and bone biopsy, are available for assessing BMD. However, these imaging techniques have limitations, including bulky equipment, high costs, limited accessibility or invasiveness, which hinder their widespread use in primary medical examinations [Citation24]. In addition to imaging techniques, other methods remain crucial for the early and accurate assessment of osteoporosis, contributing to improved prevention and treatment of the condition.
Our study revealed lower BMD in female pre-dialysis patients compared to their male counterparts, which is unsurprising given the average age of the female patients being 66 years old. Gender is an important influence on the development of osteoporosis [Citation25], and menopausal or postmenopausal women are more likely to develop postmenopausal osteoporosis because of a decrease in estrogen levels and osteoclast activity and an increase in osteoblast activity [Citation26–28]; however, in the male population, a decrease in testosterone levels may have a similar, but less significant, effect. Our study identified age as a risk factor for osteoporosis in both gender-specific subgroups and subgroups with varying degrees of renal function. In the female patient subgroup, deteriorating renal function was linked to an increased risk of osteoporosis. A large body of previous evidence for the female CKD population also suggests that decreased renal function is positively associated with decreased BMD [Citation29–32]. Kidney failure affects bones in various ways, such as elevated parathyroid hormone levels, abnormal calcium and phosphate metabolism, and vitamin D deficiency. Early identification of elderly pre-dialysis female patients at high risk of renal osteoporosis and targeted prevention is therefore important to improve clinical outcomes.
Our research has unveiled that being underweight poses a risk factor for osteoporosis in patients with early-stage renal impairment (G1–G4) and in female patients. The investigation into the impact of BMI on fractures in CKD patients has been extensive; a lower BMI is widely acknowledged as a risk factor for fractures in CKD patients [Citation33–36]. The influence of obesity on fractures remains a topic of debate. Some argue that adipose tissue provides a protective ‘cushion effect’, shielding obese individuals from fractures due to increased muscle mass and heightened mechanical strain [Citation37]. Others suggest that the protective role of obesity may be specific to certain sites; in postmenopausal women, obesity is protective against hip and pelvis fractures but linked to proximal humerus fractures [Citation38,Citation39]. Data from the Global Longitudinal Study of Osteoporosis in Women (GLOW) has indicated a significant increase in the risk of peripheral fractures among obese individuals [Citation40]. Obesity can lead to complications such as type 2 diabetes mellitus and vitamin D deficiency, consequently heightening the long-term risk of osteoporosis [Citation37]. In essence, both being overweight and underweight may elevate the risk of osteoporosis and fractures.
Our results also showed that NBAP was predictive of renal osteoporosis in a subgroup of women and a subgroup of pre-dialysis patients with advanced CKD, with higher levels associated with a higher risk of osteoporosis. Similar to our findings, several studies involving dialysis patients have shown a negative correlation between BMD and NBAP levels [Citation21,Citation41]. NBAP plays a key role in the proliferation of tissue mineralization and its increase may indicate increased bone turnover which induces further bone loss [Citation42]. In addition, reduced levels of NBAP may indicate the presence of adynamic bone disease, characterized by a decrease in osteoblasts and osteoclasts, no osteoid accumulation, and low bone turnover [Citation43]. The KDIGO guidelines use NBAP as one of the indicators to guide pharmacological treatment of CKD-MBD. NBAP is thought to reflect bone turnover better than iPTH, but there is some consensus that combining them is more accurate for bone turnover assessment [Citation44–49].
We have also conducted further studies on iPTH, and analyses of a subgroup of women and a subgroup with advanced CKD found that iPTH may be a protective factor against renal osteoporosis. Regarding the relationship between circulating iPTH levels and osteoporosis, many previous cross-sectional studies in dialysis patients have observed that high iPTH and very low iPTH levels are associated with fracture risk [Citation21,Citation50–53]. In CKD patients on dialysis, when fractures occur in patients with low levels of iPTH, the histological changes may be due to the presence of low-turnover bone disease (non-dynamic bone disease or osteochondritis dissecans); in patients with higher levels of iPTH, the main cause of fractures may be high-turnover bone disease (hyperparathyroidism) [Citation21]. The study by Jansz et al. suggested that there may be a ‘U’-shaped association between iPTH and vertebral fracture in patients with end-stage renal disease [Citation54]. In our study, the female subgroup and the subgroup of patients with advanced renal function also appeared to show a ‘U’ shaped relationship between iPTH and osteoporosis (Table S4). We believe that lowering iPTH and avoiding high iPTH plays a protective role against renal osteoporosis. However, the data collected in this study can only reflect the bone metabolism of patients at a specific point in time before dialysis, and it is not possible to dynamically assess the evolution of the metabolism or to determine the optimal range in which to maintain iPTH levels. Further studies are needed on the range within which iPTH should be maintained for the prevention of renal osteoporosis.
It is noteworthy that vitamin D deficiency or insufficiency is prevalent among the CKD population, with rates ranging from 40.7% in CKD stage 3 to 61.5% in stage 4, and notably increasing to 85.7% in stage 5 [Citation55]. A study involving pre-dialysis patients found that only 29% of CKD stage 3 patients and a mere 17% of CKD stage 4 patients exhibited serum vitamin D levels considered adequate [Citation56]. Endogenous vitamin D may provide a modest contribution to hip fracture prevention [Citation57,Citation58]. It has been demonstrated that correcting vitamin D deficiency can in lowering serum iPTH and bone turnover markers in early stages of CKD [Citation59]. Our study found that maintaining vitamin D at adequate levels and avoiding vitamin D insufficiency or deficiency has a positive impact on reducing the risk of renal osteoporosis in men and G5 non-dialysis patients.
In this study, we constructed prediction models for osteoporosis in pre-dialysis CKD patients of different genders and renal function stages. The evaluation of its performance indicates a certain level of practicality for clinicians to assess the risk of osteoporosis promptly. However, it must be acknowledged that this study was a single-center retrospective study with a small sample size and the strength of evidence was not as strong as in prospective studies. To enhance the significance of our findings and to make the model more widely applicable, future research endeavors should focus on conducting multi-center and prospective studies involving larger cohorts. Additionally, due to constraints imposed by the sample size, we were unable to perform an in-depth analysis or construct prediction models based on gender-specific characteristics in pre-dialysis CKD patients with varying degrees of renal impairment. Moreover, although we diligently excluded patients who had prolonged usage of glucocorticoids and immunosuppressants, it remains uncertain whether other medications influencing bone metabolism were utilized by the subjects.
Conclusion
Age, underweight status, renal impairment, NBAP, iPTH levels, and 25-(OH)-vitamin D concentrations may influence osteoporosis in pre-dialysis CKD patients. Our study developed nomogram-based clinical prediction models that facilitate osteoporosis screening in pre-dialysis patients across various gender and renal function classifications.
Authors’ contributions
CY. Kuang made significant contributions to the data analysis and manuscript drafting processes. JJ. Shang played a crucial role in the data collection, interpretation, and discussion. MM. Ma, SL. Huang, B. Yan and YZ. Zhong provided valuable assistance in the data collection phase. BZ. Guan and J Gong contributed to the writing and editing of the manuscript. FN. Liu effectively coordinated the project and served as the guarantor. LM. Chen developed the hypothesis, provided joint supervision throughout the project and secured the necessary funding. Furthermore, all authors diligently participated in the revision and editing of the paper.
Ethics approval and consent to participate
Our study received approval from the institutional review board of The First Affiliated Hospital of Jinan University (KY-2023-053) and was registered with the Chinese Clinical Trial Registry (ChiCTR2300068179). All participants signed an informed consent form and agreed to the use of their clinical data for research purposes.
Supplemental Material
Download MS Word (4.6 MB)Disclosure statement
The authors declare no competing interests.
Additional information
Funding
References
- Abdalbary M, Sobh M, Elnagar S, et al. Management of osteoporosis in patients with chronic kidney disease. Osteoporos Int. 2022;33(11):2259–2274. doi:10.1007/s00198-022-06462-3.
- Aggarwal HK, Jain D, Yadav S, et al. Bone mineral density in patients with predialysis chronic kidney disease. Ren Fail. 2013;35(8):1105–1111. doi:10.3109/0886022X.2013.815102.
- Mittalhenkle A, Gillen DL, Stehman-Breen CO. Increased risk of mortality associated with hip fracture in the dialysis population. Am J Kidney Dis. 2004;44(4):672–679. doi:10.1016/S0272-6386(04)00958-8.
- Tentori F, McCullough K, Kilpatrick RD, et al. High rates of death and hospitalization follow bone fracture among hemodialysis patients. Kidney Int. 2014;85(1):166–173. doi:10.1038/ki.2013.279.
- Vilaca T, Salam S, Schini M, et al. Risks of hip and nonvertebral fractures in patients with CKD G3a-G5D: a systematic review and meta-analysis. Am J Kidney Dis. 2020;76(4):521–532. doi:10.1053/j.ajkd.2020.02.450.
- Burge R, Dawson-Hughes B, Solomon DH, et al. Incidence and economic burden of osteoporosis-related fractures in the United States, 2005-2025. J Bone Mineral Res. 2007;22(3):465–475. doi:10.1359/jbmr.061113.
- Hyun YY, Lee K-B, Han SH, et al. Risk factors and renal outcomes of low bone mineral density in patients with non-dialysis chronic kidney disease. Osteoporos Int. 2020;31(12):2373–2382. doi:10.1007/s00198-020-05531-9.
- KDIGO. Clinical practice guideline update for the diagnosis, evaluation, prevention, and treatment of chronic kidney disease-mineral and bone disorder (CKD-MBD). Kidney Int Suppl. 2017;7(1):1–59. doi:10.1016/j.kisu.2017.04.001.
- Jadoul M, Albert JM, Akiba T, et al. Incidence and risk factors for hip or other bone fractures among hemodialysis patients in the dialysis outcomes and practice patterns study. Kidney Int. 2006;70(7):1358–1366. doi:10.1038/sj.ki.5001754.
- Yamamoto S, Fukagawa M. Uremic toxicity and bone in CKD. J Nephrol. 2017;30(5):623–627. doi:10.1007/s40620-017-0406-x.
- Danese MD, Kim J, Doan QV, et al. PTH and the risks for hip, vertebral, and pelvic fractures among patients on dialysis. Am J Kidney Dis. 2006;47(1):149–156. doi:10.1053/j.ajkd.2005.09.024.
- Chen W, Bushinsky DA. Chronic kidney disease: KDIGO CKD-MBD guideline update: evolution in the face of uncertainty. Nat Rev Nephrol. 2017;13(10):600–602. doi:10.1038/nrneph.2017.118.
- Burton JO, Goldsmith DJ, Ruddock N, et al. Renal association commentary on the KDIGO (2017) clinical practice guideline update for the diagnosis, evaluation, prevention, and treatment of CKD-MBD. BMC Nephrol. 2018;19(1):240. doi:10.1186/s12882-018-1037-8.
- Institute of Medicine Committee to Review Dietary Reference Intakes for Vitamin, D. and Calcium, The National Academies Collection: reports funded by National Institutes of Health, in Dietary Reference Intakes for Calcium and Vitamin D. A.C. Ross, et al. Editors. 2011, National Academies Press (US) Copyright © 2011, National Academy of Sciences.: Washington (DC).
- Chen C, Lu FC. The guidelines for prevention and control of overweight and obesity in chinese adults. Biomed Environ Sci. 2004;17(Suppl):1–36.
- Wu H-H, Wu B, Zhang S-J, et al. Establishing age-adjusted trabecular bone score curves using dual-energy X-ray absorptiometry in chinese women and men: a cross-sectional study. Quant Imaging Med Surg. 2023;13(4):2478–2485. doi:10.21037/qims-22-550.
- Nickolas TL, Stein EM, Dworakowski E, et al. Rapid cortical bone loss in patients with chronic kidney disease. J Bone Mineral Res. 2013;28(8):1811–1820. doi:10.1002/jbmr.1916.
- Silva BC, et al. Catabolic and anabolic actions of parathyroid hormone on the skeleton. J Endocrinol Investig. 2011;34(10):801–810.
- Elliott MJ, James MT, Quinn RR, et al. Estimated GFR and fracture risk: a population-based study. Clin J Am Soc Nephrol: CJASN. 2013;8(8):1367–1376. doi:10.2215/CJN.09130912.
- Fujita Y, Iki M, Tamaki J, et al. Renal function and bone mineral density in community-dwelling elderly japanese men: the fujiwara-kyo osteoporosis risk in men (FORMEN) study. Bone. 2013;56(1):61–66. doi:10.1016/j.bone.2013.05.004.
- Iimori S, et al. Diagnostic usefulness of bone mineral density and biochemical markers of bone turnover in predicting fracture in CKD stage 5D patients–a single-center cohort study. Nephrol Dialysis Transplant. 2012;27(1):345–351.
- Naylor KL, Garg AX, Zou G, et al. Comparison of fracture risk prediction among individuals with reduced and normal kidney function. Clin J Am Soc Nephrol: CJASN. 2015;10(4):646–653. doi:10.2215/CJN.06040614.
- Carvalho C, Magalhães J, Neto R, et al. Cortical bone analysis in a predialysis population: a comparison with a dialysis population. J Bone Miner Metab. 2017;35(5):513–521. doi:10.1007/s00774-016-0781-8.
- Kuo TR, Chen CH. Bone biomarker for the clinical assessment of osteoporosis: recent developments and future perspectives. Biomark Res. 2017;5(1):18. doi:10.1186/s40364-017-0097-4.
- Camacho PM, et al. American association of clinical endocrinologists/American college of endocrinology clinical practice guidelines for the diagnosis and treatment of postmenopausal osteoporosis-2020 update. Endocrine Pract. 2020;26(Suppl 1):1–46.
- Khosla S, Oursler MJ, Monroe DG. Estrogen and the skeleton. Trends Endocrinol Metab. 2012;23(11):576–581. doi:10.1016/j.tem.2012.03.008.
- Qian D, Wang Z-F, Cheng Y-C, et al. Early menopause may associate with a higher risk of CKD and all-cause mortality in postmenopausal women: an analysis of NHANES, 1999-2014. Front Med (Lausanne). 2022;9:823835. doi:10.3389/fmed.2022.823835.
- Li Q, Zheng D, Lin H, et al. High circulating Follicle-stimulating hormone level is a potential risk factor for renal dysfunction in Post-Menopausal women. Front Endocrinol (Lausanne). 2021;12:627903. doi:10.3389/fendo.2021.627903.
- Kim H-L, Park IY, Choi JM, et al. A decline in renal function is associated with loss of bone mass in korean postmenopausal women with mild renal dysfunction. J Korean Med Sci. 2011;26(3):392–398. doi:10.3346/jkms.2011.26.3.392.
- Sheng Y-H, Chen J-H, Chiou J-M, et al. Association of renal function and menopausal status with bone mineral density in Middle-aged women. Sci Rep. 2015;5(1):14956. doi:10.1038/srep14956.
- Chen H, Lips P, Vervloet MG, et al. Association of renal function with bone mineral density and fracture risk in the longitudinal aging study amsterdam. Osteoporos Int. 2018;29(9):2129–2138. doi:10.1007/s00198-018-4592-8.
- Kaji H, Yamauchi M, Yamaguchi T, et al. Mild renal dysfunction is a risk factor for a decrease in bone mineral density and vertebral fractures in japanese postmenopausal women. J Clin Endocrinol Metab. 2010;95(10):4635–4642. doi:10.1210/jc.2010-0099.
- Shapses SA, Riedt CS. Bone, body weight, and weight reduction: what are the concerns? J Nutr. 2006;136(6):1453–1456. doi:10.1093/jn/136.6.1453.
- Watts NB, Camacho PM, Lewiecki EM, et al. American association of clinical endocrinologists/American college of endocrinology clinical practice guidelines for the diagnosis and treatment of postmenopausal osteoporosis-2020 update. Endocrine Pract. 2021;27(4):379–380. doi:10.1016/j.eprac.2021.02.001.
- Yoshimura N, Muraki S, Oka H, et al. Do sarcopenia and/or osteoporosis increase the risk of frailty? A 4-year observation of the second and third ROAD study surveys. Osteoporos Int. 2018;29(10):2181–2190. doi:10.1007/s00198-018-4596-4.
- Ahmadi S-F, Zahmatkesh G, Ahmadi E, et al. Association of body mass index with clinical outcomes in non-dialysis-dependent chronic kidney disease: a systematic review and meta-analysis. Cardiorenal Med. 2015;6(1):37–49. doi:10.1159/000437277.
- Fassio A, Idolazzi L, Rossini M, et al. The obesity paradox and osteoporosis. Eat Weight Disord. 2018;23(3):293–302. doi:10.1007/s40519-018-0505-2.
- Prieto-Alhambra D, Premaor MO, Fina Avilés F, et al. The association between fracture and obesity is site-dependent: a population-based study in postmenopausal women. J Bone Miner Res. 2012;27(2):294–300. doi:10.1002/jbmr.1466.
- Premaor MO, Compston JE, Fina Avilés F, et al. The association between fracture site and obesity in men: a population-based cohort study. J Bone Miner Res. 2013;28(8):1771–1777. doi:10.1002/jbmr.1878.
- Watts NB. Insights from the global longitudinal study of osteoporosis in women (GLOW). Nat Rev Endocrinol. 2014;10(7):412–422. doi:10.1038/nrendo.2014.55.
- Marques IDB, Araújo MJCLN, Graciolli FG, et al. Biopsy vs. peripheral computed tomography to assess bone disease in CKD patients on dialysis: differences and similarities. Osteoporos Int. 2017;28(5):1675–1683. doi:10.1007/s00198-017-3956-9.
- Haarhaus M, et al. Alkaline phosphatase: a novel treatment target for cardiovascular disease in CKD. Nat Rev Nephrol. 2017;13(7):429–442.
- Garrett G, Sardiwal S, Lamb EJ, et al. PTH–a particularly tricky hormone: why measure it at all in kidney patients? Clin J Am Soc Nephrol: CJASN. 2013;8(2):299–312. doi:10.2215/CJN.09580911.
- Coen G. Bone markers in the diagnosis of low turnover osteodystrophy in haemodialysis patients. Nephrol Dialysis Transplant. 1998;13(9):2294–2302. doi:10.1093/ndt/13.9.2294.
- Moore C, Yee J, Malluche H, et al. Relationship between bone histology and markers of bone and mineral metabolism in African-American hemodialysis patients. Clin J Am Soc Nephrol: CJASN. 2009;4(9):1484–1493. doi:10.2215/CJN.01770408.
- Ureña P, Hruby M, Ferreira A, et al. Plasma total versus bone alkaline phosphatase as markers of bone turnover in hemodialysis patients. J Am Soc Nephrol: JASN. 1996;7(3):506–512. doi:10.1681/ASN.V73506.
- Jørgensen HS, Winther S, Bøttcher M, et al. Bone turnover markers are associated with bone density, but not with fracture in end stage kidney disease: a cross-sectional study. BMC Nephrol. 2017;18(1):284. doi:10.1186/s12882-017-0692-5.
- Ureña P, De Vernejoul MC. Circulating biochemical markers of bone remodeling in uremic patients. Kidney Int. 1999;55(6):2141–2156. doi:10.1046/j.1523-1755.1999.00461.x.
- Sprague SM, Bellorin-Font E, Jorgetti V, et al. Diagnostic accuracy of bone turnover markers and bone histology in patients with CKD treated by dialysis. Am J Kidney Dis. 2016;67(4):559–566. doi:10.1053/j.ajkd.2015.06.023.
- Fishbane S, Hazzan AD, Jhaveri KD, et al. Bone parameters and risk of hip and femur fractures in patients on hemodialysis. CJASN. 2016;11(6):1063–1072. doi:10.2215/CJN.09280915.
- Malluche HH, Davenport DL, Cantor T, et al. Bone mineral density and serum biochemical predictors of bone loss in patients with CKD on dialysis. Clin J Am Soc Nephrol: CJASN. 2014;9(7):1254–1262. doi:10.2215/CJN.09470913.
- Atsumi K, Kushida K, Yamazaki K, et al. Risk factors for vertebral fractures in renal osteodystrophy. Am J Kidney Dis. 1999;33(2):287–293. doi:10.1016/S0272-6386(99)70302-1.
- Coco M, Rush H. Increased incidence of hip fractures in dialysis patients with low serum parathyroid hormone. Am J Kidney Dis. 2000;36(6):1115–1121. doi:10.1053/ajkd.2000.19812.
- Jansz TT, Goto NA, van Ballegooijen AJ, et al. The prevalence and incidence of vertebral fractures in end-stage renal disease and the role of parathyroid hormone. Osteoporos Int. 2020;31(3):515–524. doi:10.1007/s00198-019-05187-0.
- Kim SM, Choi HJ, Lee JP, et al. Prevalence of vitamin D deficiency and effects of supplementation with cholecalciferol in patients with chronic kidney disease. J Renal Nutr. 2014;24(1):20–25. doi:10.1053/j.jrn.2013.07.003.
- LaClair RE, Hellman RN, Karp SL, et al. Prevalence of calcidiol deficiency in CKD: a cross-sectional study across latitudes in the United States. Am J Kidney Dis. 2005;45(6):1026–1033. doi:10.1053/j.ajkd.2005.02.029.
- LeBlanc ES, Zakher B, Daeges M, et al. Screening for vitamin D deficiency: a systematic review for the U.S. Preventive services task force. Ann Intern Med. 2015;162(2):109–122. doi:10.7326/M14-1659.
- Bischoff-Ferrari HA, Willett WC, Orav EJ, et al. A pooled analysis of vitamin D dose requirements for fracture prevention. N Engl J Med. 2012;367(1):40–49. doi:10.1056/NEJMoa1109617.
- Yadav AK, Kumar V, Kumar V, et al. The effect of vitamin D supplementation on bone metabolic markers in chronic kidney disease. J Bone Miner Res. 2018;33(3):404–409. doi:10.1002/jbmr.3314.