Abstract
Purpose
To investigate the dietary nutrient intake of Maintenance hemodialysis (MHD) patients, identify influencing factors, and explore the correlation between dietary nutrient intake and nutritional and disease control indicators.
Methods
This was a multicenter cross-sectional study. A dietary survey was conducted using a three-day dietary record method, and a self-designed diet management software was utilized to calculate the daily intake of dietary nutrients. The nutritional status and disease control indicators were assessed using subjective global assessment, handgrip strength, blood test indexes, and dialysis adequacy.
Results
A total of 382 MHD patients were included in this study. Among them, 225 (58.9%) and 233 (61.0%) patients’ protein and energy intake did not meet the recommendations outlined in the National Kidney Foundation’s Kidney Disease Outcomes Quality Initiative Clinical Practice Guideline for Nutrition in Chronic Kidney Disease (2020 update). The average protein and energy intake for these patients were 0.99 ± 0.32 g/kg/d and 29.06 ± 7.79 kcal/kg/d, respectively. Multiple linear regression analysis showed that comorbidity-diabetes had a negative influence on normalized daily energy intake (nDEI = DEI / ideal body weight) (B = −2.880, p = 0.001) and normalized daily protein intake (nDPI = DPI / ideal body weight) (B = −0.109, p = 0.001). Pearson correlation analysis revealed that dietary DPI (r = −0.109, p < 0.05), DEI (r = −0.226, p < 0.05) and phosphorus (r = −0.195, p < 0.001) intake were statistically correlated to Kt/V; dietary nDPI (r = 0.101, p < 0.05) and sodium (r = −0.144, p < 0.001) intake were statistically correlated to serum urea nitrogen; dietary DPI (r = 0.200, p < 0.001), DEI (r = 0.241, p < 0.001), potassium (r = 0.129, p < 0.05), phosphorus (r = 0.199, p < 0.001), and fiber (r = 0.157, p < 0.001) intake were statistically correlated to serum creatinine; dietary phosphorus (r = 0.117, p < 0.05) and fiber (r = 0.142, p < 0.001) intake were statistically correlated to serum phosphorus; dietary nDPI (r = 0.125, p < 0.05), DPI (r = 0.135, p < 0.05), nDEI (r = 0.116, p < 0.05), DEI (r = 0.125, p < 0.05), potassium (r = 0.148, p < 0.001), and phosphorus (r = 0.156, p < 0.001) intake were statistically correlated to subjective global assessment scores; dietary nDPI (r = 0.215, p < 0.001), DPI (r = 0.341, p < 0.001), nDEI (r = 0.142, p < 0.05), DEI (r = 0.241, p < 0.001), potassium (r = 0.166, p < 0.05), phosphorus (r = 0.258, p < 0.001), and fiber (r = 0.252, p < 0.001) intake were statistically correlated to handgrip strength in males; dietary fiber (r = 0.190, p < 0.05) intake was statistically correlated to handgrip strength in females.
Conclusions
The dietary nutrient intake of MHD patients need improvement. Inadequate dietary nutrient intake among MHD patients could have a detrimental effect on their blood test indexes and overall nutritional status. It is crucial to address and optimize the dietary intake of nutrients in this patient population to enhance their health outcomes and well-being.
Introduction
Chronic kidney disease (CKD) has a global prevalence of approximately 14.3% [Citation1], with China reporting a prevalence of about 10.8% [Citation2]. CKD has emerged as a significant public health concern [Citation3], and as the condition advances, it can progress to end-stage renal disease (ESRD) [Citation4]. Maintenance hemodialysis (MHD) serves as the primary treatment option for ESRD, effectively replacing kidney function, enhancing overall patient health, and extending survival. However, MHD treatment is associated with challenges such as nutrient loss, increased catabolism, and electrolyte imbalances [Citation5]. Addressing these issues is crucial in optimizing the care and outcomes of individuals undergoing MHD.
Nutrition plays a crucial role in the disease progression and prognosis of CKD patients. Malnutrition has been identified as an independent risk factor for mortality and a significant predictor of outcomes in individuals with ESRD [Citation6,Citation7]. Inadequate caloric intake leading to malnutrition is a common complication among those undergoing MHD treatment [Citation8]. Hyperphosphatemia is directly linked to increase mortality rates in CKD patients [Citation9]. Traditionally, it is recommended to maintain phosphorus intake between 800 mg/d and 1000 mg/d for individuals on MHD therapy [Citation10]. Studies have shown that restricting dietary phosphorus intake can effectively reduce serum phosphate levels in hemodialysis patients with hyperphosphatemia [Citation11]. However, the reduction in serum phosphate levels achieved solely through dietary restrictions is modest [Citation10] and given the higher bioavailability of phosphorus in certain food products, phosphate binders are often prescribed to manage phosphorus levels [Citation12]. In addition to phosphorus, other micronutrients such as calcium, potassium, and sodium also play crucial roles in the nutritional status of patients undergoing MHD. Previous research has indicated that higher dietary potassium [Citation13] and sodium [Citation14] intake, as well as elevated serum calcium concentrations [Citation15], are associated with a negative impact on CKD progression and mortality. Therefore, ensuring appropriate dietary nutrient intake is essential for the well-being and management of MHD patients.
Dietary nutrient intake is closely intertwined with various social, cultural, environmental, economic, and traditional factors [Citation16]. Chinese and Western food cultures exhibit significant differences in the perception of food, serving practices, meal timing, and composition [Citation17–19]. Chinese culture tends to prioritize food flavor over nutritional concern [Citation17], emphasizes communal dining experiences with round tables symbolizing unity and harmony [Citation17,Citation18], and typically follows a meal structure consisting of three main meals without additional snacks [Citation19]. Previous studies investigating the nutritional status and influencing factors among MHD patients have shown a lack of comprehensive surveys conducted in China. Most studies have focused on sociodemographic information, disease conditions, and blood test results, with limited attention given to dietary nutrient intake [Citation20]. Understanding the cultural nuances and dietary habits specific to the Chinese population is essential for developing tailored nutritional interventions and improving the overall health outcomes of MHD patients in China.
In the dietary surveys of MHD patients [Citation21–23], the use of 24h dietary recall methods has been common practice. However, the short recording period in these methods may introduce randomness in dietary data and reduce the accuracy of reflecting patients’ daily dietary nutrient intake. Both the National Kidney Foundation’s Kidney Disease Outcomes Quality Initiative (KDOQI) Clinical Practice Guideline for Nutrition in CKD (2020 update) [Citation10] and the Updated Clinical Practice Guidelines for the Treatment of Chronic Kidney Disease Nutrition in China (2021 Edition) [Citation24] recommend the use of the 3-day dietary record method, which provides a more comprehensive assessment of nutrient intake and aligns with standard nutrient intake guidelines for CKD patients. Therefore, a multicenter cross-sectional survey was conducted to: (1) investigate the dietary nutrient intake of Chinese MHD patients by using the 3-day dietary record method and compare the results with guideline recommendations to assess patients’ adherence to dietary nutrient intake guidelines; (2) analyze the factors influencing the dietary nutrient intake of MHD patients; (3) examine the correlations between dietary nutrient intake and disease control indicators (including blood test indexes and dialysis adequacy indicators that can reflect patient disease control condition) as well as the nutritional status of MHD patients to understand the impact of dietary nutrient intake on disease management. This study aims to provide a more comprehensive and scientific understanding of the dietary nutrient intake and nutritional status of MHD patients in China.
Materials and methods
Study design
In this multicenter cross-sectional study, convenience sampling was employed to recruit MHD patients from six hospitals in Beijing, China, between April 2021 to October 2021. The study protocol was approved by the Medical Ethical Committee of Peking University Third Hospital (IRB2021-084-02), ensuring that the research adhered to ethical standards and guidelines for conducting studies involving human participants.
Participants and settings
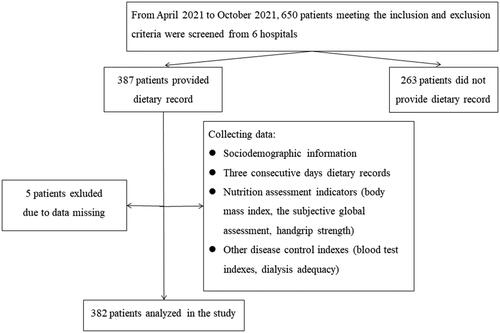
In this study, a total of 382 patients undergoing MHD were ultimately recruited, with informed consent obtained from all participants. Inclusion criteria for the study required patients to be 18 years or older, clinically diagnosed with ESRD, receiving MHD treatment for a minimum of 3 months and at least twice a week, capable of independent oral feeding without chewing and swallowing disorders, and having unimpaired consciousness and communication abilities. Patients were excluded if they were taking nutritional supplements, undergoing dietician intervention, or had acute comorbidities, malignant tumors, cachexia, or other severe consumptive diseases during the data collection period. The study’s research flowchart can be referenced in the provided .
Figure 1. The research flowchart of the research.
Data collection
Sociodemographic information
Sociodemographic data, including age, gender, marital status, education, professional status, dialysis duration, duration of dialysis session, dialysis frequency, payment method, and comorbidity-diabetes, were collected through a self-designed questionnaire.
Dietary survey
Considering the potential differences in dietary nutrient intake between weekdays and weekends, with individuals having simple meals on weekdays and family meals on weekends. Collecting dietary records form patients for 3 consecutive days, including at least one weekday and one weekend day. Patients received regular dialysis on Monday-Wednesday-Friday or Tuesday-Thursday-Saturday within a week, so the 3 days would cover one dialysis day and two non-dialysis days. Upon recruitment, nurses provided patients with a self-designed food recording paper (see Appendix 1) and explained the recording method. Patients then recorded their food intake (see Appendix 2) and brought it to the nurses on the next dialysis day. Dietitians would use food models to verify the records with patients and input them into the “Patient diet analysis system” (see Appendix 3), a diet management software developed by the Department of Nephrology at Peking University Third Hospital. This software is designed based on the Chinese Food Composition Table 2019 and calculates the daily intake of calories, protein, fat, carbohydrate, water, dietary fiber, potassium, sodium, calcium, and phosphorus. Daily protein intake (DPI) and daily energy intake (DEI) were calculated based on the protein and energy content of the foods consumed by patients each day. DPI and DEI were then normalized to nDEI and nDPI by ideal body weight (IBW), calculated as body height (cm) minus 105 using the modified Broca method [Citation25].
Nutrition assessment indicators
Body mass index (BMI): BMI = post-dialysis body weight (kg) / height (m) 2, the unit is kg/m2.
Subjective global assessment (SGA): A generic clinical nutritional status assessment tool recommended by the American Society for Parenteral and Enteral Nutrition (ASPEN) [Citation26], the 7-point SGA includes history and physical examination, with grades of A (6–7 points), B (3–5 points), and C (1–2 points) indicating good nutrition, mild-moderate malnutrition, and severe malnutrition, respectively. A higher SGA score reflects better nutritional status.
Handgrip strength (HGS): Patients with arteriovenous fistulas were measured using the non-fistula side, while patients with central lines were measured using the sharpshooter side. The patient stands upright with arms naturally down and pulls the grip strength meter with maximum force. Three measurements of HGS were taken for each patient, with each measurement was taken at 15-second intervals, and the mean value was recorded [Citation10].
Other disease control indexes
Blood test indexes: Primary hemodialysis nurses collected patients’ pre-dialysis blood specimens before the second dialysis of the week to obtain information on serum albumin, potassium, phosphorus, and urea nitrogen using standard clinical laboratory methods.
Dialysis adequacy: Collect post-dialysis and pre-dialysis blood specimens from patients to obtain urea nitrogen data, then calculate Kt/V using the Daugirdas single chamber model formula[Citation27]: Kt/V = − ln(R−0.008T) + (4−3.5R) * ΔBW / BW. R is the post-dialysis urea nitrogen / pre-dialysis urea nitrogen, T is the treatment time, ΔBW is the ultrafiltration volume, and BW is the post-dialysis body weight. Kt/V ≥1.2 indicates adequate dialysis, while Kt/V <1.2 indicates inadequate dialysis.
Statistical analysis
Data were analyzed using SPSS25.0. Categorical data were presented as numbers (percentages). The chi-square test was used to evaluate differences in categorical variables between groups. The normality of continuous data was tested using Probability–Probability Plot. Normally distributed continuous data were presented as the mean ± standard deviation (SD). The independent sample t-test was used to evaluate differences in variables between two groups, while the one-way analysis of variance was used for three or more groups. Post hoc tests were conducted using Bonferroni correlation. Non-normally distributed continuous variables were expressed as median [interquartile range (IQR)], and differences between groups were evaluated using the Mann-Whitney U test. Covariates with p < 0.05 in univariates analysis were included in multiple linear regression analysis to identify independent factors associated with patients’ dietary nutrient intake. The correlation between dietary nutrient intake, blood test indexes, dialysis adequacy, and nutritional status was analyzed using Pearson correlation analysis. A two-tailed p-value <0.05 was considered statistically significant.
Results
A total of 382 MHD patients were recruited, with 229 (59.9%) male patients and 153 (40.1%) female patients. The mean age was (58.7 ± 13.22) years (range 25 ∼ 88). Among the patients, 135 (36.7%) had comorbidity-diabetes and 233 (63.3%) did not. The quartile of patients’ dialysis duration was 61.5 (36.0, 109.0) months, the duration of dialysis session was 4.0 (4.0, 4.0) hours, and the dialysis frequency was 3.0 (3.0, 3.0) times per week. Among the total monthly blood purification modalities, hemodialysis filtration (HDF) accounted for 14.8%, hemodialysis plus hemoperfusion (HD + HP) accounted for 17.2%, and hemodialysis alone (HD) accounted for 68%. Low-permeability membrane (1.5 ∼ 1.8 m2) was used by 57.1% of patients, while 42.9% used high-permeability membrane (1.4 ∼ 1.8 m2).
Guideline recommended intake levels were as follows: nDPI 1.0 g/kg/d ≤ DPI ≤1.2 g/kg/d, nDEI 30 kcal/kg/d ≤ DEI ≤35 kcal/kg/d, dietary phosphorus intake 800 ∼ 1000 mg/d, and dietary sodium intake < 2300 mg/d. The distribution among the patients was as follows: nDPI <1.0 g/kg/d (inadequate-nDPI) in 225 (58.9%) patients, 1.0 g/kg/d ≤ nDPI ≤1.2 g/kg/d (adequate-nDPI) in 71 (18.6%) patients, and nDPI >1.2 g/kg/d (overload-nDPI) in 86 (22.5%) patients; nDEI < 30 kcal/kg/d (inadequate-nDEI) in 233 (61.0%) patients, 30 kcal/kg/d ≤ nDEI ≤ 35 kcal/kg/d (adequate-nDEI) in 63 (16.5%) patients, and nDEI > 35 kcal/kg/d (overload-nDEI) in 86 (22.5%) patients. Dietary phosphorus intake < 800 mg/d (inadequate phosphorus intake) in 168 (44.0%) patients, 800 ∼ 1000 mg/d (adequate phosphorus intake) in 131 (34.3%) patients, and > 1000 mg/d (overload phosphorus intake) in 83 (21.7%) patients. Dietary sodium intake was < 2300 mg/d (appropriate sodium intake) in 89 (23.3%) patients and ≥ 2300 mg/d (overload sodium intake) in 293 (76.7%) patients. The Kt/V of 332 patients ranged from 0.47 to 2.71 (1.47 ± 0.29), with 50 (15.1%) patients having Kt/V < 1.2 (low-Kt/V) and 282 (84.9%) patients having Kt/V ≥ 1.2 (acceptable-Kt/V). In terms of nutritional status, 329 (86.1%) patients were classified as SGA A (good nutrition) and 53 (13.9%) as SGA B (mild-moderate malnutrition); serum albumin levels were < 35 g/L (malnutrition) in 28 (7.3%) patients and ≥ 35 g/L (good nutrition) in 354 (92.7%) patients (see ). The correlations among disease control indexes were shown in .
Table 1. Dietary nutrient intake, blood test indexes and nutritional status in maintenance hemodialysis patients.
Table 2. Correlations among disease control indexes in maintenance hemodialysis patients.
Independent t-test results indicated that DPI, DEI, dietary potassium intake, dietary phosphorus intake, and dietary calcium intake were significantly higher in male patients compared to female patients (p < 0.05). Additionally, nDPI, nDEI, and dietary fiber intake were significantly lower in patients with comorbidity-diabetes than those without diabetes (p < 0.05) (see ). Pearson correlation analysis revealed a negative correlation between age and DEI (r = −0.207, p < 0.001), nDEI (r = − 0.110, p = 0.032), DPI (r = − 0.221, p < 0.001), dietary fiber intake (r = − 0.302, p < 0.001), dietary phosphorus intake (r = − 0.229, p < 0.001), dietary potassium intake (r = − 0.232, p < 0.001), and dietary sodium intake (r = − 0.139, p = 0.006). Furthermore, dialysis duration was positively correlated with nDPI (r = 0.108, p = 0.035) and nDEI (r = 0.124, p = 0.016).
Table 3. Influence of gender and comorbidity-diabetes on dietary nutrient intake in maintenance hemodialysis patients.
The stepwise method for conducting multiple linear regression analysis revealed that DEI was statistically associated with gender, age, and comorbidity-diabetes (p < 0.05); nDEI was statistically associated with comorbidity-diabetes (p < 0.05); DPI showed statistical association with gender, age, and comorbidity-diabetes (p < 0.05); nDPI was statistically associated with comorbidity-diabetes (p < 0.05) (see ).
Table 4. Multiple linear regression analysis of factors associated with dietary nutrient intake in maintenance hemodialysis patients.
Pearson correlation analysis showed that Kt/V, serum urea nitrogen, serum creatinine, and serum phosphorus were significantly associated with specific dietary nutrient intake (p < 0.05). Among the nutritional indicators, most dietary nutrient intake was significantly linked to SGA and male patients’ HGS (p < 0.05) (see ).
Table 5. Correlation between dietary nutrient intake and blood test indexes and nutritional status in maintenance hemodialysis patients.
Patients were categorized into three groups based on their nDEI: (1) nDEI < 25 kcal/kg/d (low-nDEI), (2) 25 kcal/kg/d ≤ nDEI ≤ 30 kcal/kg/d (slightly low-nDEI), (3) nDEI > 30 kcal/kg/d (adequate-nDEI), and nDPI: (1) nDPI < 0.8 g/kg/d (low-nDPI), (2) 0.8 g/kg/d ≤ nDPI ≤ 1.0 g/kg/d (slightly low-nDPI), (3) nDPI > 1.0 g/kg/d (adequate-nDPI). Significant differences were observed in SGA score (p < 0.05) among patients and HGS (p < 0.01) in male patients across different nDEI groups (see ). Post hoc test revealed that SGA score was notably lower in patients with nDEI < 25 kcal/kg/d (low-nDEI) compared to those with 25 kcal/kg/d ≤ nDEI ≤ 30 kcal/kg/d (slightly low-nDEI) (p = 0.034) and nDEI >30 kcal/kg/d (adequate-nDEI) (p = 0.009); SGA score was also significantly lower in patients with nDPI < 0.8 g/kg/d (low-nDPI) compared to those with 0.8 g/kg/d ≤ nDPI ≤ 1.0 g/kg/d (slightly low-nDPI) (p = 0.046) and nDPI > 1.0 g/kg/d (adequate-nDPI) (p = 0.020); HGS was notably lower in male patients with nDEI < 25 kcal/kg/d (low-nDEI) compared to those with 25 kcal/kg/d ≤ nDEI ≤ 30 kcal/kg/d (slightly low-nDEI) (p = 0.009) and nDEI > 30 kcal/kg/d (adequate-nDEI) (p = 0.001).
Table 6. Differences in nutritional status of maintenance hemodialysis patients in different nDEI and nDPI groups.
Discussion
No comprehensive survey has been conducted to investigate dietary nutrient intake and its influencing factors in Chinese MHD patients. Due to cultural differences, there are dietary cultural and opinion disparities between Western and Chinese individuals [Citation17–19]. Many studies typically rely on 24h dietary recall to estimate dietary nutrient intake, and DPI is often indirectly calculated using equations based on nitrogen balance studies [Citation28], which may lead to inaccurate results due to various influencing factors. Therefore, we utilized the guideline-recommended 3-day dietary record method to conduct a multicenter dietary survey in Chinese MHD patients.
The results indicated that over half of the patients had insufficient protein and energy intake, consistent with previous studies [Citation29,Citation30]. Compared to Cupisti et al.’s study [Citation31], the dietary potassium intake of MHD patients in this study was significantly lower, possibly due to different dietary habits regarding potassium-rich foods in China. Additionally, 76.7% of patients in this study had excessive sodium intake, which is strongly linked to a higher risk of mortality [Citation14]. Limiting sodium intake (salt < 5 g/d) could aid in improving volume management [Citation32] and should therefore be a focus for MHD patients. The average dietary fiber intake in this group was much lower than the recommended 25 ∼ 35 g/d for healthy adults by the Chinese Nutrition Society, likely due to a lower consumption of green leafy vegetables to prevent hyperkalemia. Increasing dietary fiber intake could help reduce the incidence of CKD complications [Citation33] and should be emphasized.
The findings indicated that MHD patients with comorbidity-diabetes had lower nDPI and nDEI, which differed from the studies by Boaz et al. [Citation34] and Hoppe et al. [Citation35]. In the Boaz et al. study [Citation34], patients at high risk of malnutrition had already received dietary interventions. Therefore, healthcare professionals should proactively implement dietary interventions for MHD patients. The Hoppe et al. study [Citation35] focused on Type 2 diabetes, a systemic metabolic disease linked to overnutrition and obesity. Variations in diabetes types, the causal relationship between kidney disease and diabetes, and the duration of diabetes could affect patients’ dietary nutrient intake and explain the discrepancies between the studies. Additionally, the results indicated that male and younger patients consumed more nutrients, possibly due to lifestyle and physical differences. Based on these findings, healthcare professionals should offer personalized dietary intervention and create individualized meal plans for each patient.
This study showed that not all dietary nutrients were statistically correlated with disease control indicators in MHD patients, with correlations generally below 0.4. This could be due to various factors affecting blood test results [Citation36], such as disease progression, kidney function, and medications. The interrelationships among disease control indicators (refer to ) suggest that dietary nutrient intake is closely linked to these indicators. The findings highlight the importance of a proper dietary nutrient balance for disease control and emphasize the need for healthcare professionals to monitor disease control indicators comprehensively in MHD patients. When certain blood test results are not well controlled, dietary factors should be taken into consideration.
The results showed a significant association between dietary nutrient intake and HGS in male MHD patients. Previous studies have demonstrated that in men, serum albumin and muscle mass are positively correlated, while in women, they are negatively correlated [Citation37]. Additionally, muscle mass is positively correlated with strength in men but not in women [Citation38,Citation39]. A study by Do [Citation40] on peritoneal dialysis patients revealed that nutritional status was linked to HGS in male patients through muscle mass, but no such correlation was found in female patients. Unlike men, women’s strength more closely correlates with other factors rather than muscle mass, such as neural factors or change in muscle quality, because of their limited muscle volume [Citation38, Citation41]. Therefore, interventions other than dietary modifications should be considered for preventing malnutrition in female patients. The underlying mechanism of this gender difference requires further investigation. In terms of other nutritional indicators, no correlations were found between dietary nutrient intake and BMI or serum albumin, suggesting that HGS and SGA may be more specific indicators of nutritional status in MHD patients.
More than 85% of MHD patients had good nutritional status (level A by SGA), but over half did not meet the guideline recommendations for protein and energy intake. The study revealed that only patients with the lowest nDEI (< 25 Kcal/kg/d) or the lowest nDPI (< 0.8 g/kg/d) had lower SGA scores. Previous research [Citation42,Citation43] also indicated that a lower-than-recommended protein intake could still maintain good nutritional status in MHD patients. Additionally, a longitudinal study [Citation44] suggested that nDPI ≥ 0.8 g/kg/d was beneficial for the long-term outcome of peritoneal dialysis patients. This study contributes further insights into nutritional status of MHD patients. Further research is needed to determine if nDPI ≥ 0.8 g/kg/d has long-term benefits for MHD patients. Moreover, there was no significant difference in HGS between patients in different nDPI subgroups, and only male patients with the lowest nDEI (< 25 Kcal/kg/d) had lower HGS. This implies that adequate energy intake may be more crucial for the nutritional status of male MHD patients than female patients.
The patients included in this study were individuals with MHD in Beijing, China. Given potential variations in dietary preferences among patients from different regions, the study was designed as a multicenter investigation across hospitals of varying levels. Additionally, the study could benefit from additional details on factors such as C-reactive protein levels, residual kidney function, medications, and comorbidities. Furthermore, the purpose of this study was to reflect regular dietary intake conditions of patients, therefore holiday meals were not considered in the dietary recording. Moreover, since the food was recorded by patients themselves, the accuracy of the food amount may be compromised. To address this, dietitians checked the food amount using food models. It is important to note that the cross-sectional nature of the study limits the ability to establish causal relationships. Future research should focus on large-scale, multicenter, longitudinal, and interventional studies to validate these findings and explore causal links.
Conclusion
This study utilized the 3-day dietary record method to assess the dietary nutrient intake of Chinese MHD patients. The findings revealed that over 85% of MHD patients maintained good nutritional status, while more than half did not meet the recommended dietary nutrient intake guidelines. Older, female, and having comorbid-diabetic MHD patients exhibited lower dietary nutrient intake. Suboptimal dietary nutrient intake in MHD patients could adversely affect their blood test results and overall nutritional status. Therefore, healthcare providers should consider these associations comprehensively when designing personalized dietary intervention for MHD patients in clinical practice.
Acknowledgments
We would like to express our gratitude to the patients who participated in this study and the dialysis room staff for their tremendous cooperation.
Disclosure statement
No potential conflict of interest was reported by the author(s).
Data availability statement
Data are available from the corresponding author upon reasonable request.
Additional information
Funding
References
- Ene-Iordache B, Perico N, Bikbov B, et al. Chronic kidney disease and cardiovascular risk in six regions of the world (ISN-KDDC): a cross-sectional study. Lancet Glob Health. 2016;4(5):1–14. doi:10.1016/S2214-109X(16)00071-1.
- Zhang L, Wang F, Wang L, et al. Prevalence of chronic kidney disease in China: a cross-sectional survey. Lancet. 2012;379(9818):815–822. doi:10.1016/S0140-6736(12)60033-6.
- Russo D, Morrone L, Di Iorio B, et al. Parathyroid hormone may be an early predictor of low serum hemoglobin concentration in patients with not advanced stages of chronic kidney disease. J Nephrol. 2015;28(6):701–708. doi:10.1007/s40620-014-0129-1.
- Guha A, Maddox WR, Colombo R, et al. Cardiac implantable electronic device infection in patients with end-stage renal disease. Heart Rhythm. 2015;12(12):2395–2401. doi:10.1016/j.hrthm.2015.08.003.
- Cao M, Zheng S, Zhang W, et al. Progress in the study of nutritional status and selenium in dialysis patients. Ann Med. 2023;55(1):2197296. doi:10.1080/07853890.2023.2197296.
- Hou Y, Li X, Hong D, et al. Comparison of different assessments for evaluating malnutrition in Chinese patients with end-stage renal disease with maintenance hemodialysis. Nutr Res. 2012;32(4):266–271. doi:10.1016/j.nutres.2012.02.006.
- Guney I, Atalay H, Solak Y, et al. Poor quality of life is associated with increased mortality in maintenance hemodialysis patients: a prospective cohort study. Saudi J Kidney Dis Transpl. 2012;23(3):493–499. doi:10.1097/GOX.0000000000005071.
- Kang SS, Chang JW, Park Y. Nutritional status predicts 10-year mortality in patients with end-stage renal disease on hemodialysis. Nutrients. 2017;9(4):399. doi:10.3390/nu9040399.
- Fernández-Martín JL, Martínez-Camblor P, Dionisi MP, et al. Improvement of mineral and bone metabolism markers is associated with better survival in haemodialysis patients: the COSMOS study. Nephrol Dial Transplant. 2015;30(9):1542–1551. doi:10.1093/ndt/gfv099.
- Ikizler TA, Burrowes JD, Byham-Gray LD, et al. KDOQI Clinical Practice Guideline for nutrition in CKD: 2020 Update. Am J Kidney Dis. 2020;76(3 Suppl 1):S1–S107. doi:10.1053/j.ajkd.2020.05.006.
- Lou LM, Caverni A, Gimeno JA, et al. Dietary intervention focused on phosphate intake in hemodialysis patients with hyperphosphoremia. Clin Nephrol. 2012;77(6):476–483.
- Scialla JJ, Kendrick J, Uribarri J, et al. State-of-the-art management of hyperphosphatemia in patients with CKD: an NKF-KDOQI controversies perspective. Am J Kidney Dis. 2021;77(1):132–141. doi:10.1053/j.ajkd.2020.05.025.
- Noori N, Kalantar-Zadeh K, Kovesdy CP, et al. Dietary potassium intake and mortality in long-term hemodialysis patients. Am J Kidney Dis. 2010;56(2):338–347. doi:10.1053/j.ajkd.2010.03.022.
- Mc Causland FR, Waikar SS, Brunelli SM. Increased dietary sodium is independently associated with greater mortality among prevalent hemodialysis patients. Kidney Int. 2012;82(2):204–211. doi:10.1038/ki.2012.42.
- Floege J, Kim J, Ireland E, et al. Serum iPTH, calcium and phosphate, and the risk of mortality in a European haemodialysis population. Nephrol Dial Transplant. 2011;26(6):1948–1955. doi:10.1093/ndt/gfq219.
- Plackett B. Changing diets at scale. Nature. 2020;588(7837):S70–S72. doi:10.1038/d41586-020-03450-7.
- Zili X. The differences of chinese and western food cultures. Chin Lang Lit Cult. 2017;2:6–9.
- Li C, Carolino E, Sousa J. Dietary acculturation and food habit changes among Chinese immigrants in Portugal. Nutrients. 2023;15(8):1886. doi:10.3390/nu15081886.
- Ma G. Food, eating behavior, and culture in Chinese society. J Ethn Foods. 2015;2(4):195–199. doi:10.1016/j.jef.2015.11.004.
- Qiu S, Yang J, Wang B. The nutritional status of maintenance hemodialysis patients and its influencing factors. S Chin J Prev Med. 2022;48:81–83. doi:10.12183/j.scjpm.2022.0081 (in Chinese).
- Gluba-Brzózka A, Franczyk B, Rysz J. Vegetarian diet in chronic kidney disease-a friend or foe. Nutrients. 2017;9(4):374. doi:10.3390/nu9040374.
- Bogacka A, Sobczak-Czynsz A, Kucharska E, et al. Analysis of nutrition and nutritional status of haemodialysis patients. Rocz Panstw Zakl Hig. 2018;69(2):165–174.
- Saglimbene VM, Su G, Wong G, et al. dietary nutrient intake in adults on hemodialysis compared with guideline recommendations. J Nephrol. 2021;34(6):1999–2007. doi:10.1007/s40620-020-00962-3.
- Nephrologist Branch of Chinese Medical Association, Expert Collaborative Group on Nutritional Treatment Guidelines of the Renal Disease Committee of the Chinese Society of Integrative Medicine. Clinical Practice Guidelines for the Treatment of Chronic Kidney Disease Nutrition in China (2021 Edition). Chin Med J. 2021;101:539–559. doi:10.3760/cma.j.cn112137-20201211-03338 (in Chinese).
- Wu G. Practical clinical nutrition. Shanghai, China Fudan University Press; 2006 (in Chinese).
- Mueller C, Compher C, Ellen DM. A.S.P.E.N. clinical guidelines: nutrition screening, assessment, and intervention in adults. JPEN J Parenter Enteral Nutr. 2011;35(1):16–24. doi:10.1177/0148607110389335.
- Hemodialysis Adequacy Collaborative Group of the Nephrologists Branch of the Chinese Medical Doctor Association. Clinical Practice Guidelines for Adequacy of Hemodialysis in China. Chin Med J. 2015;95:2748–2753. doi:10.3760/cma.j.issn.0376-2491.2015.34.004 (in Chinese).
- Su C, Wang T, Wang P, et al. The estimation of protein equivalents of total nitrogen in Chinese CAPD patients: an explanatory study. Ren Fail. 2022;44(1):14–22. doi:10.1080/0886022X.2021.2014886.
- Yang Y, Qin X, Li Y, et al. The association between dietary energy intake and the risk of mortality in maintenance haemodialysis patients: a multi-centre prospective cohort study. Br J Nutr. 2020;123(4):437–445. doi:10.1017/S0007114519002861.
- Chen MY, Ou SH, Yen MC, et al. Vegetarian diet in dialysis patients: a significant gap between actual intake and current nutritional recommendations. Medicine (Baltimore). 2021;100(6):e24617. doi:10.1097/MD.0000000000024617.
- Cupisti A, D’Alessandro C, Valeri A, et al. Food intake and nutritional status in stable hemodialysis patients. Ren Fail. 2010;32(1):47–54. doi:10.3109/08860220903391234.
- Kayikcioglu M, Tumuklu M, Ozkahya M, et al. The benefit of salt restriction in the treatment of end-stage renal disease by haemodialysis. Nephrol Dial Transplant. 2009;24(3):956–962. doi:10.1093/ndt/gfn599.
- Lin Z, Qin X, Yang Y, et al. Higher dietary fibre intake is associated with lower CVD mortality risk among maintenance haemodialysis patients: a multicentre prospective cohort study. Br J Nutr. 2021;126(10):1510–1518. doi:10.1017/S0007114521000210.
- Boaz M, Azoulay O, Kaufman-Shriqui V, et al. Status of Nutrition In Hemodialysis Patients Survey (SNIPS): Malnutrition risk by diabetes status. Diabet Med. 2021;38(6):e14543. doi:10.1111/dme.14543.
- Hoppe K, Schwermer K, Dopierała M, et al. Can overnutrition lead to wasting?-The paradox of diabetes mellitus in end-stage renal disease treated with maintenance hemodialysis. Nutrients. 2022;14(2):247. doi:10.3390/nu14020247.
- Ramos CI, González-Ortiz A, Espinosa-Cuevas A, et al. Does dietary potassium intake associate with hyperkalemia in patients with chronic kidney disease? Nephrol Dial Transplant. 2021;36(11):2049–2057. doi:10.1093/ndt/gfaa232.
- Chen Z, Song C, Yao Z, et al. Associations between albumin, globulin, albumin to globulin ratio and muscle mass in adults: results from the national health and nutrition examination survey 2011-2014. BMC Geriatr. 2022;22(1):383. doi:10.1186/s12877-022-03094-4.
- Hayashida I, Tanimoto Y, Takahashi Y, et al. Correlation between muscle strength and muscle mass, and their association with walking speed, in community-dwelling elderly Japanese individuals. PLoS One. 2014;9(11):e111810. doi:10.1371/journal.pone.0111810.
- Guerra RS, Fonseca I, Pichel F, et al. Handgrip strength and associated factors in hospitalized patients. JPEN J Parenter Enteral Nutr. 2015;39(3):322–330. doi:10.1177/0148607113514113.
- Do JY, Kang SH. Sex difference in the association among nutrition, muscle mass, and strength in peritoneal dialysis patients. Sci Rep. 2022;12(1):17900. doi:10.1038/s41598-022-22722-y.
- Maltais ML, Desroches J, Dionne IJ. Changes in muscle mass and strength after menopause. J Musculoskelet Neuronal Interact. 2009;9(4):186–197. PMID: 19949277.
- Zhang Y, Zhang J, Wang M, et al. Protein intake and nutrition assessment in patients on maintenance hemodialysis. Chin. J. Blood Purif. 2014;13:810–814. doi:10.3969/j.issn.1671-4091.2014.12.002 (in Chinese).
- Kloppenburg WD, Stegeman CA, Hovinga TK, et al. Effect of prescribing a high protein diet and increasing the dose of dialysis on nutrition in stable chronic haemodialysis patients: a randomized, controlled trial. Nephrol Dial Transplant. 2004;19(5):1212–1223. doi:10.1093/ndt/gfh044.
- Bi SH, Wang X, Tang W, et al. Longitudinal association between dietary protein intake and survival in peritoneal dialysis patients. Ren Fail. 2023;45(1):2182605. doi:10.1080/0886022X.2023.2182605.
Appendix 1
Appendix 2
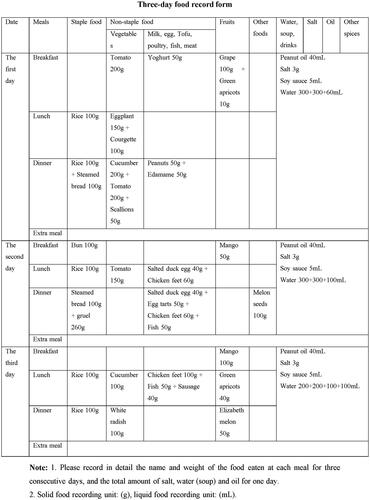
Three-day food record
Here we present an example of a 3-day food record from a patient. shows the handwritten Chinese version of the form filled out by the patient (patients handwriting was black, and the dietitian checked with blue one), and we have provided the English translation in below.
Figure 2.1. Handwritten Chinese version of a 3-day food record form.
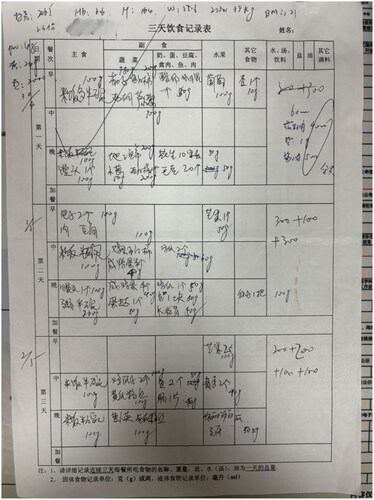
Figure 2.2. English version of the 3-day food record form.
Appendix 3
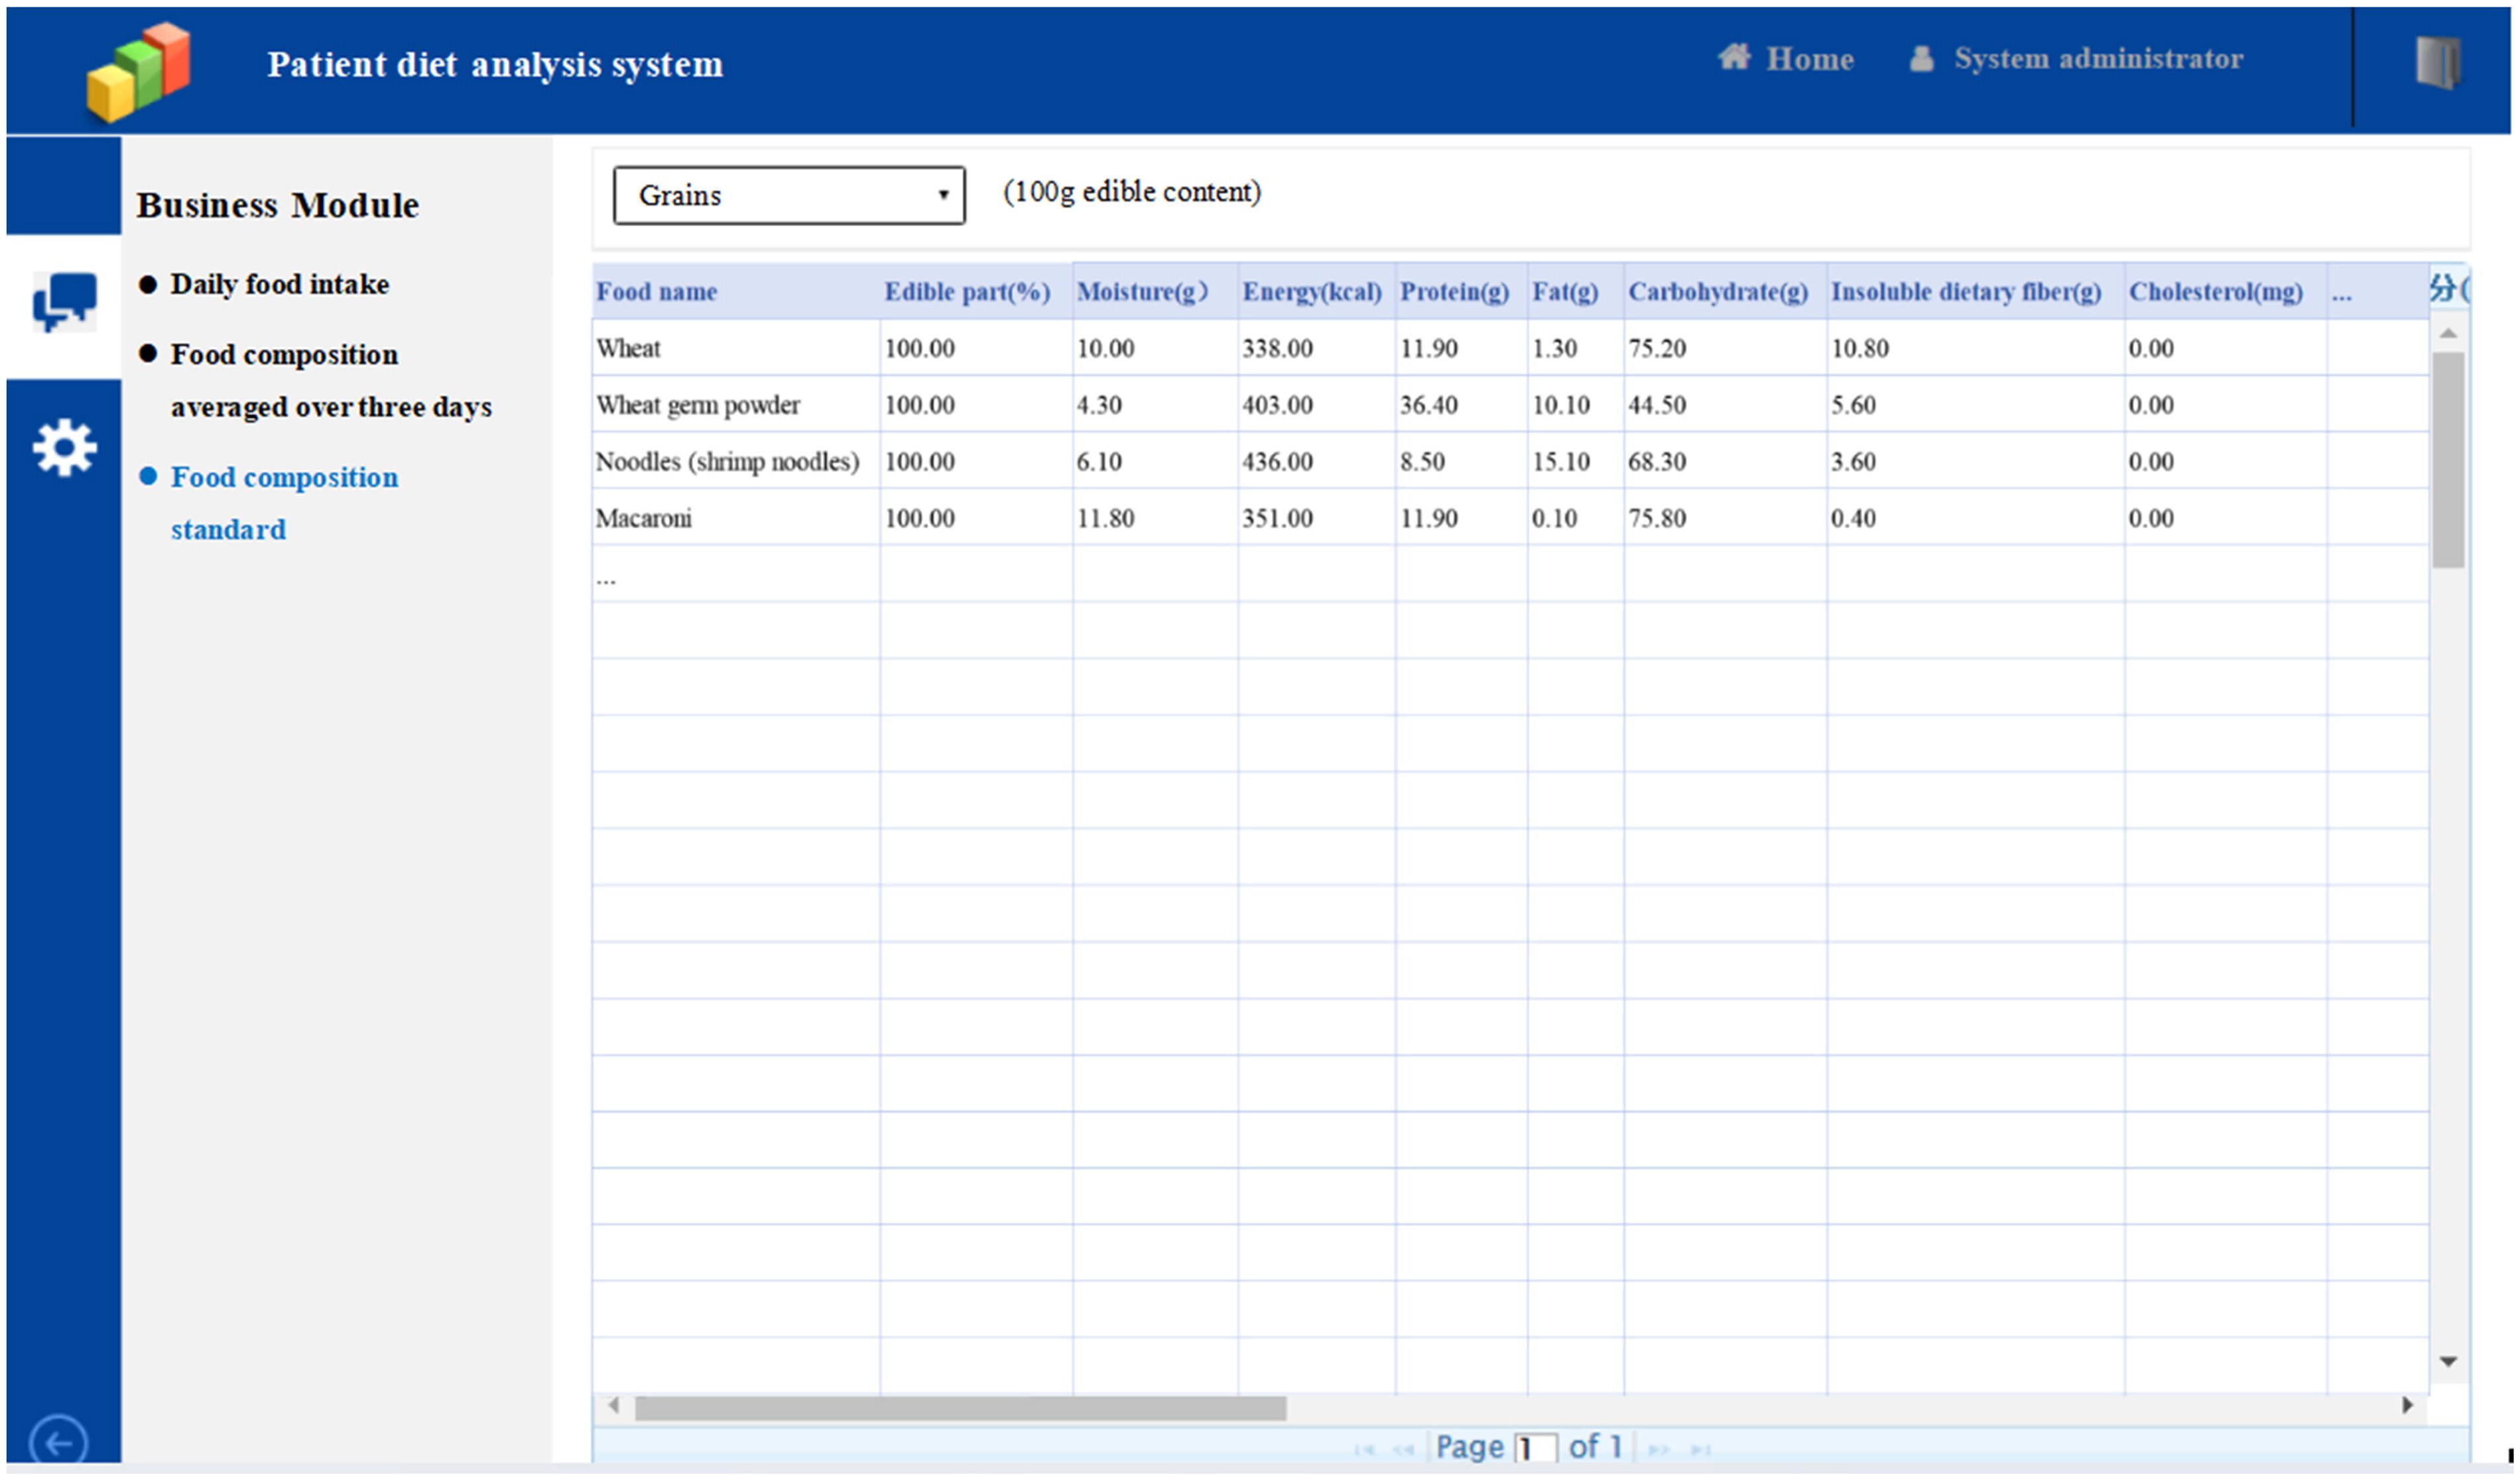
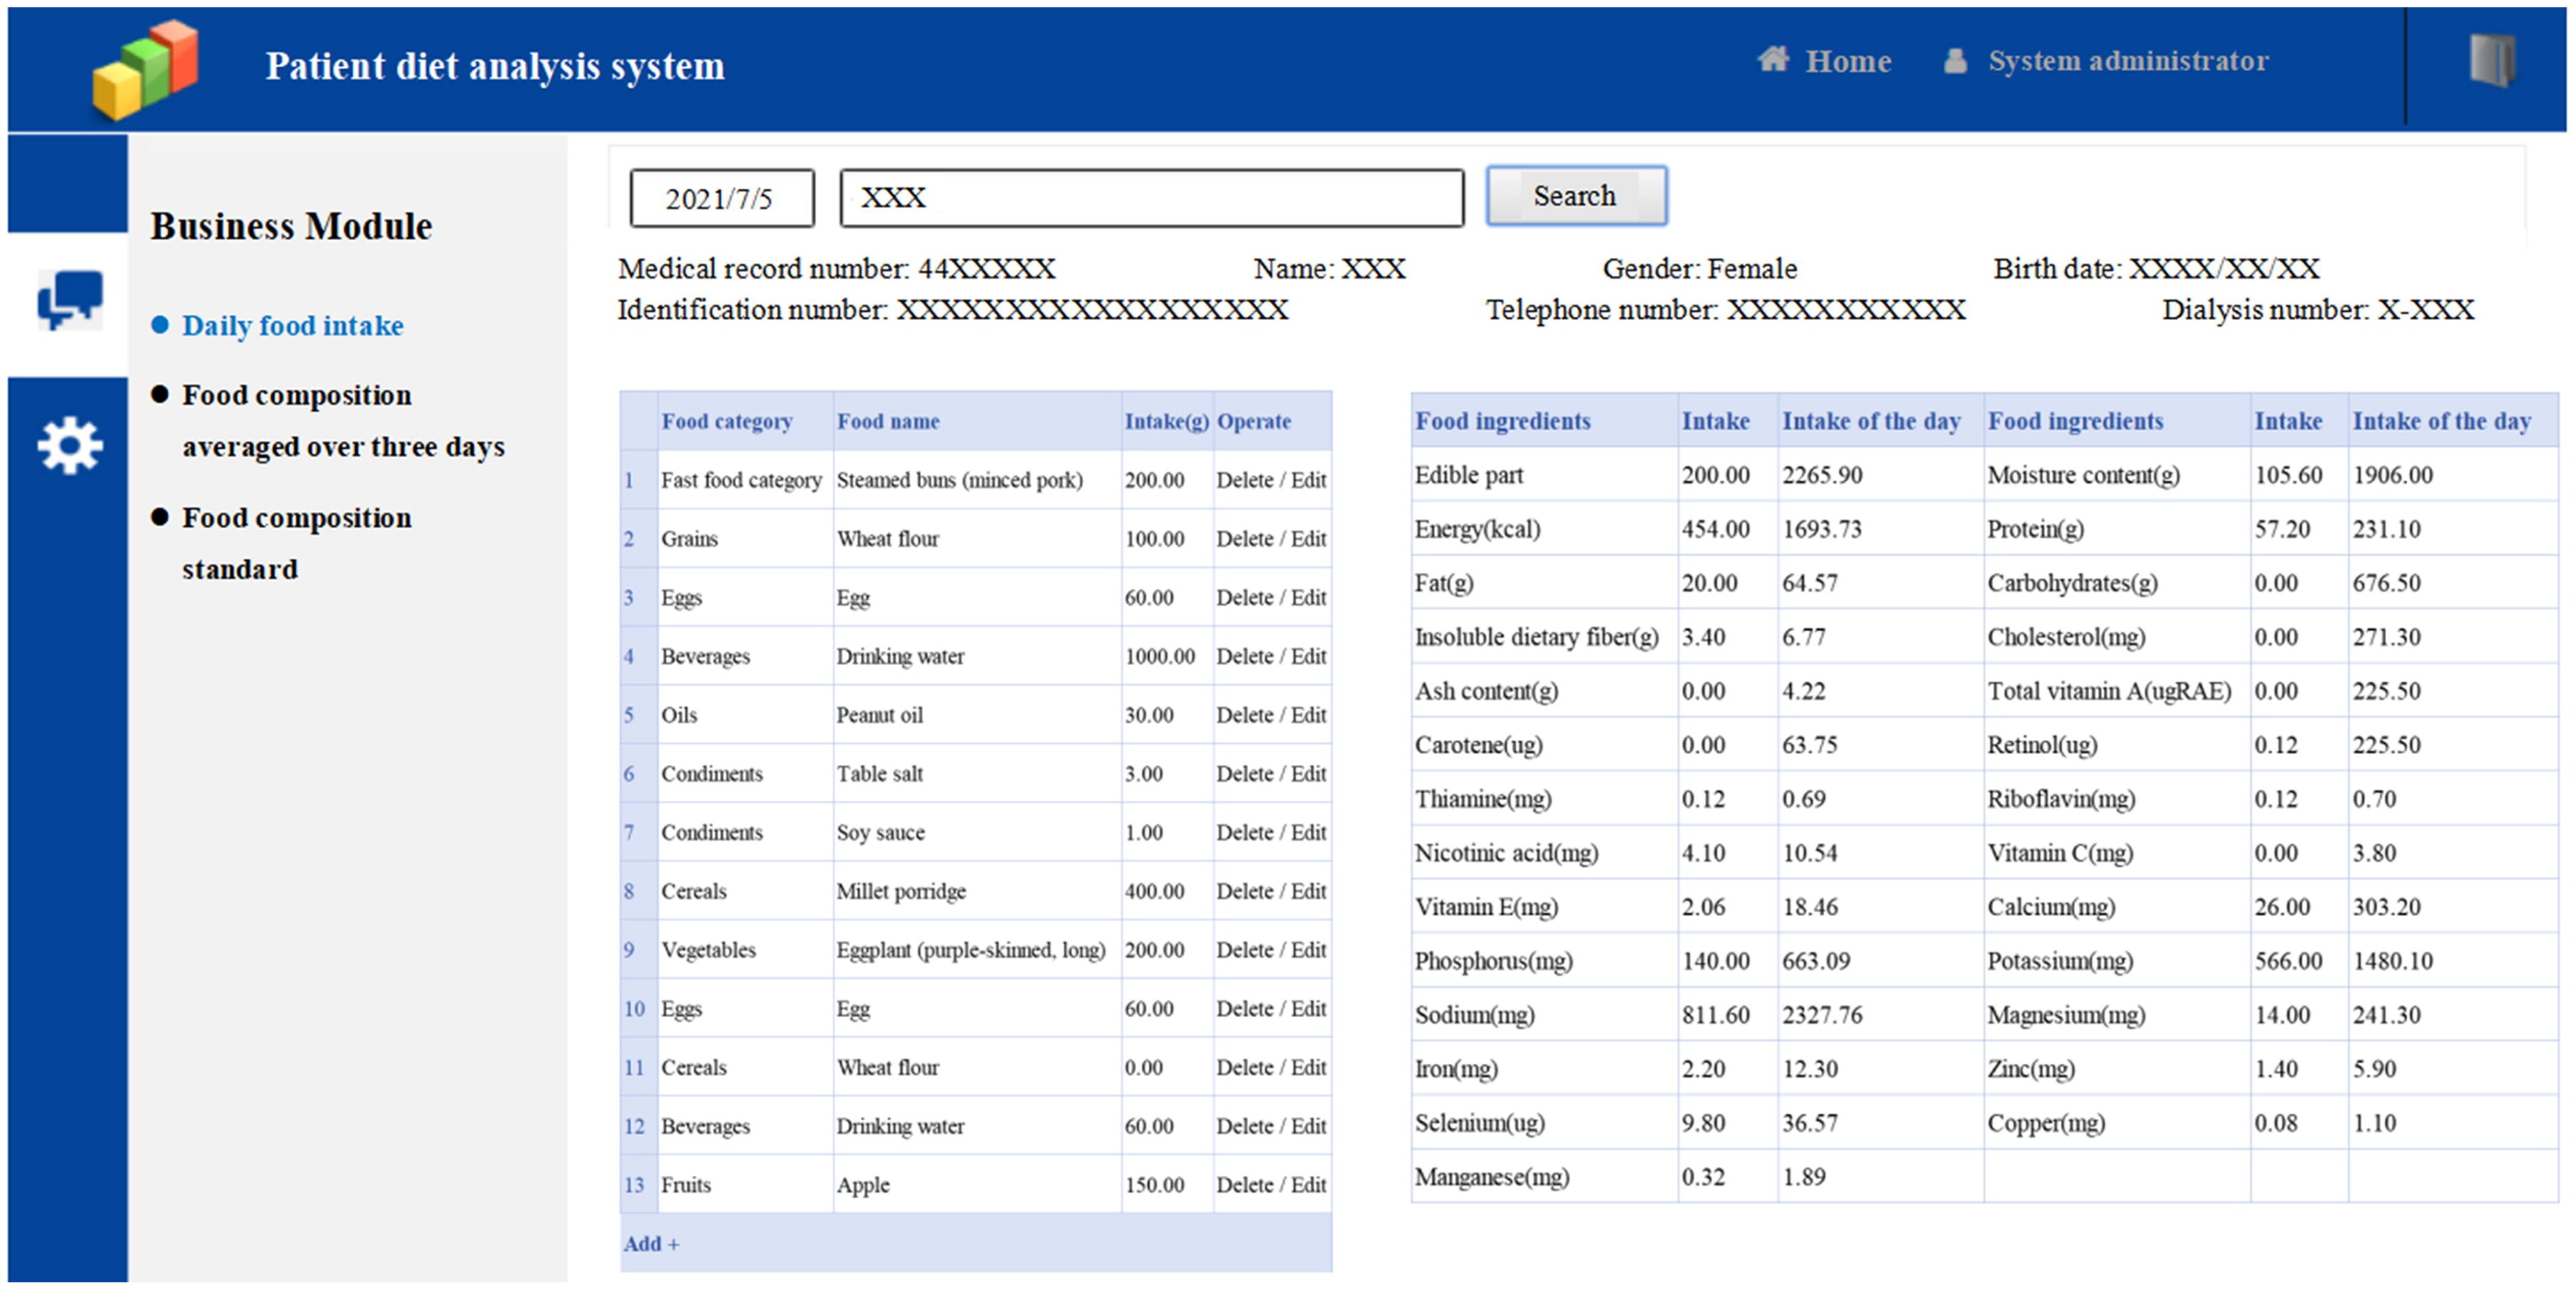
Patient diet analysis system
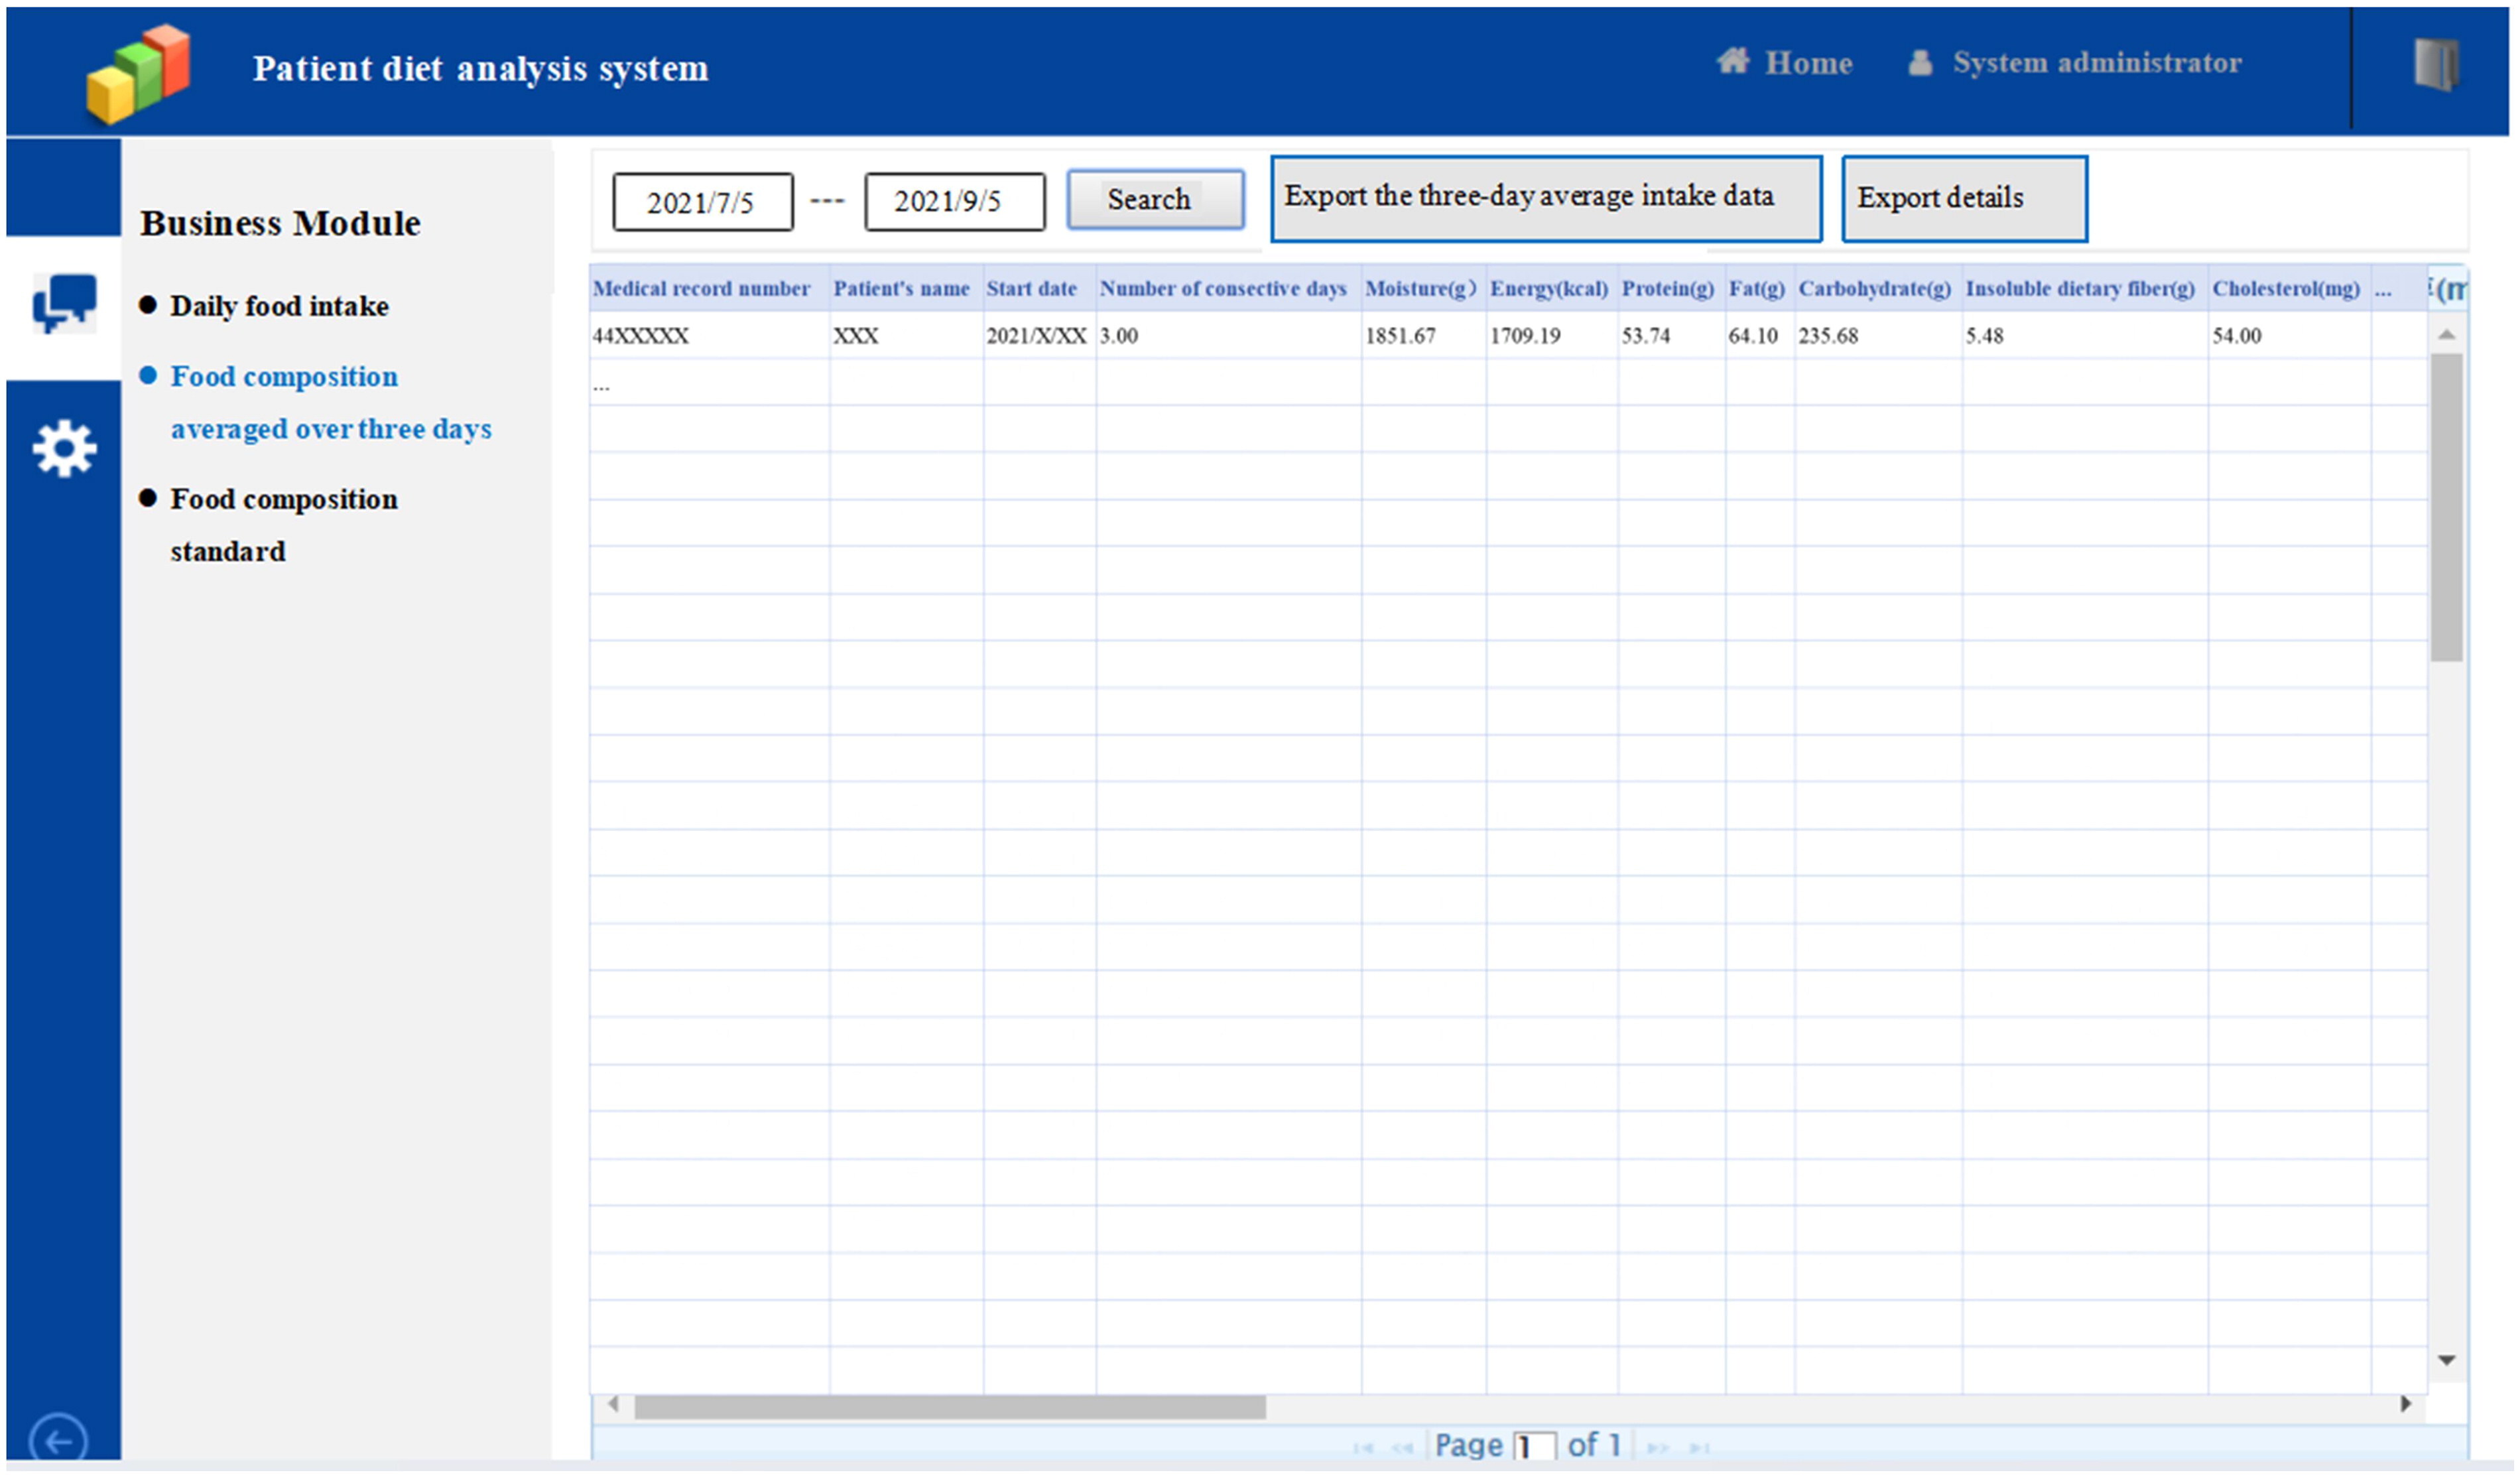
In this study, the self-designed patient diet analysis system was used to record the dietary intake of patients over 3 consecutive days. The system consists of three parts: “Daily food intake”, “Food composition averaged over three days”, and “Food composition standard”. Here is an example of using this system to record a patient’s 3 consecutive days of diet.
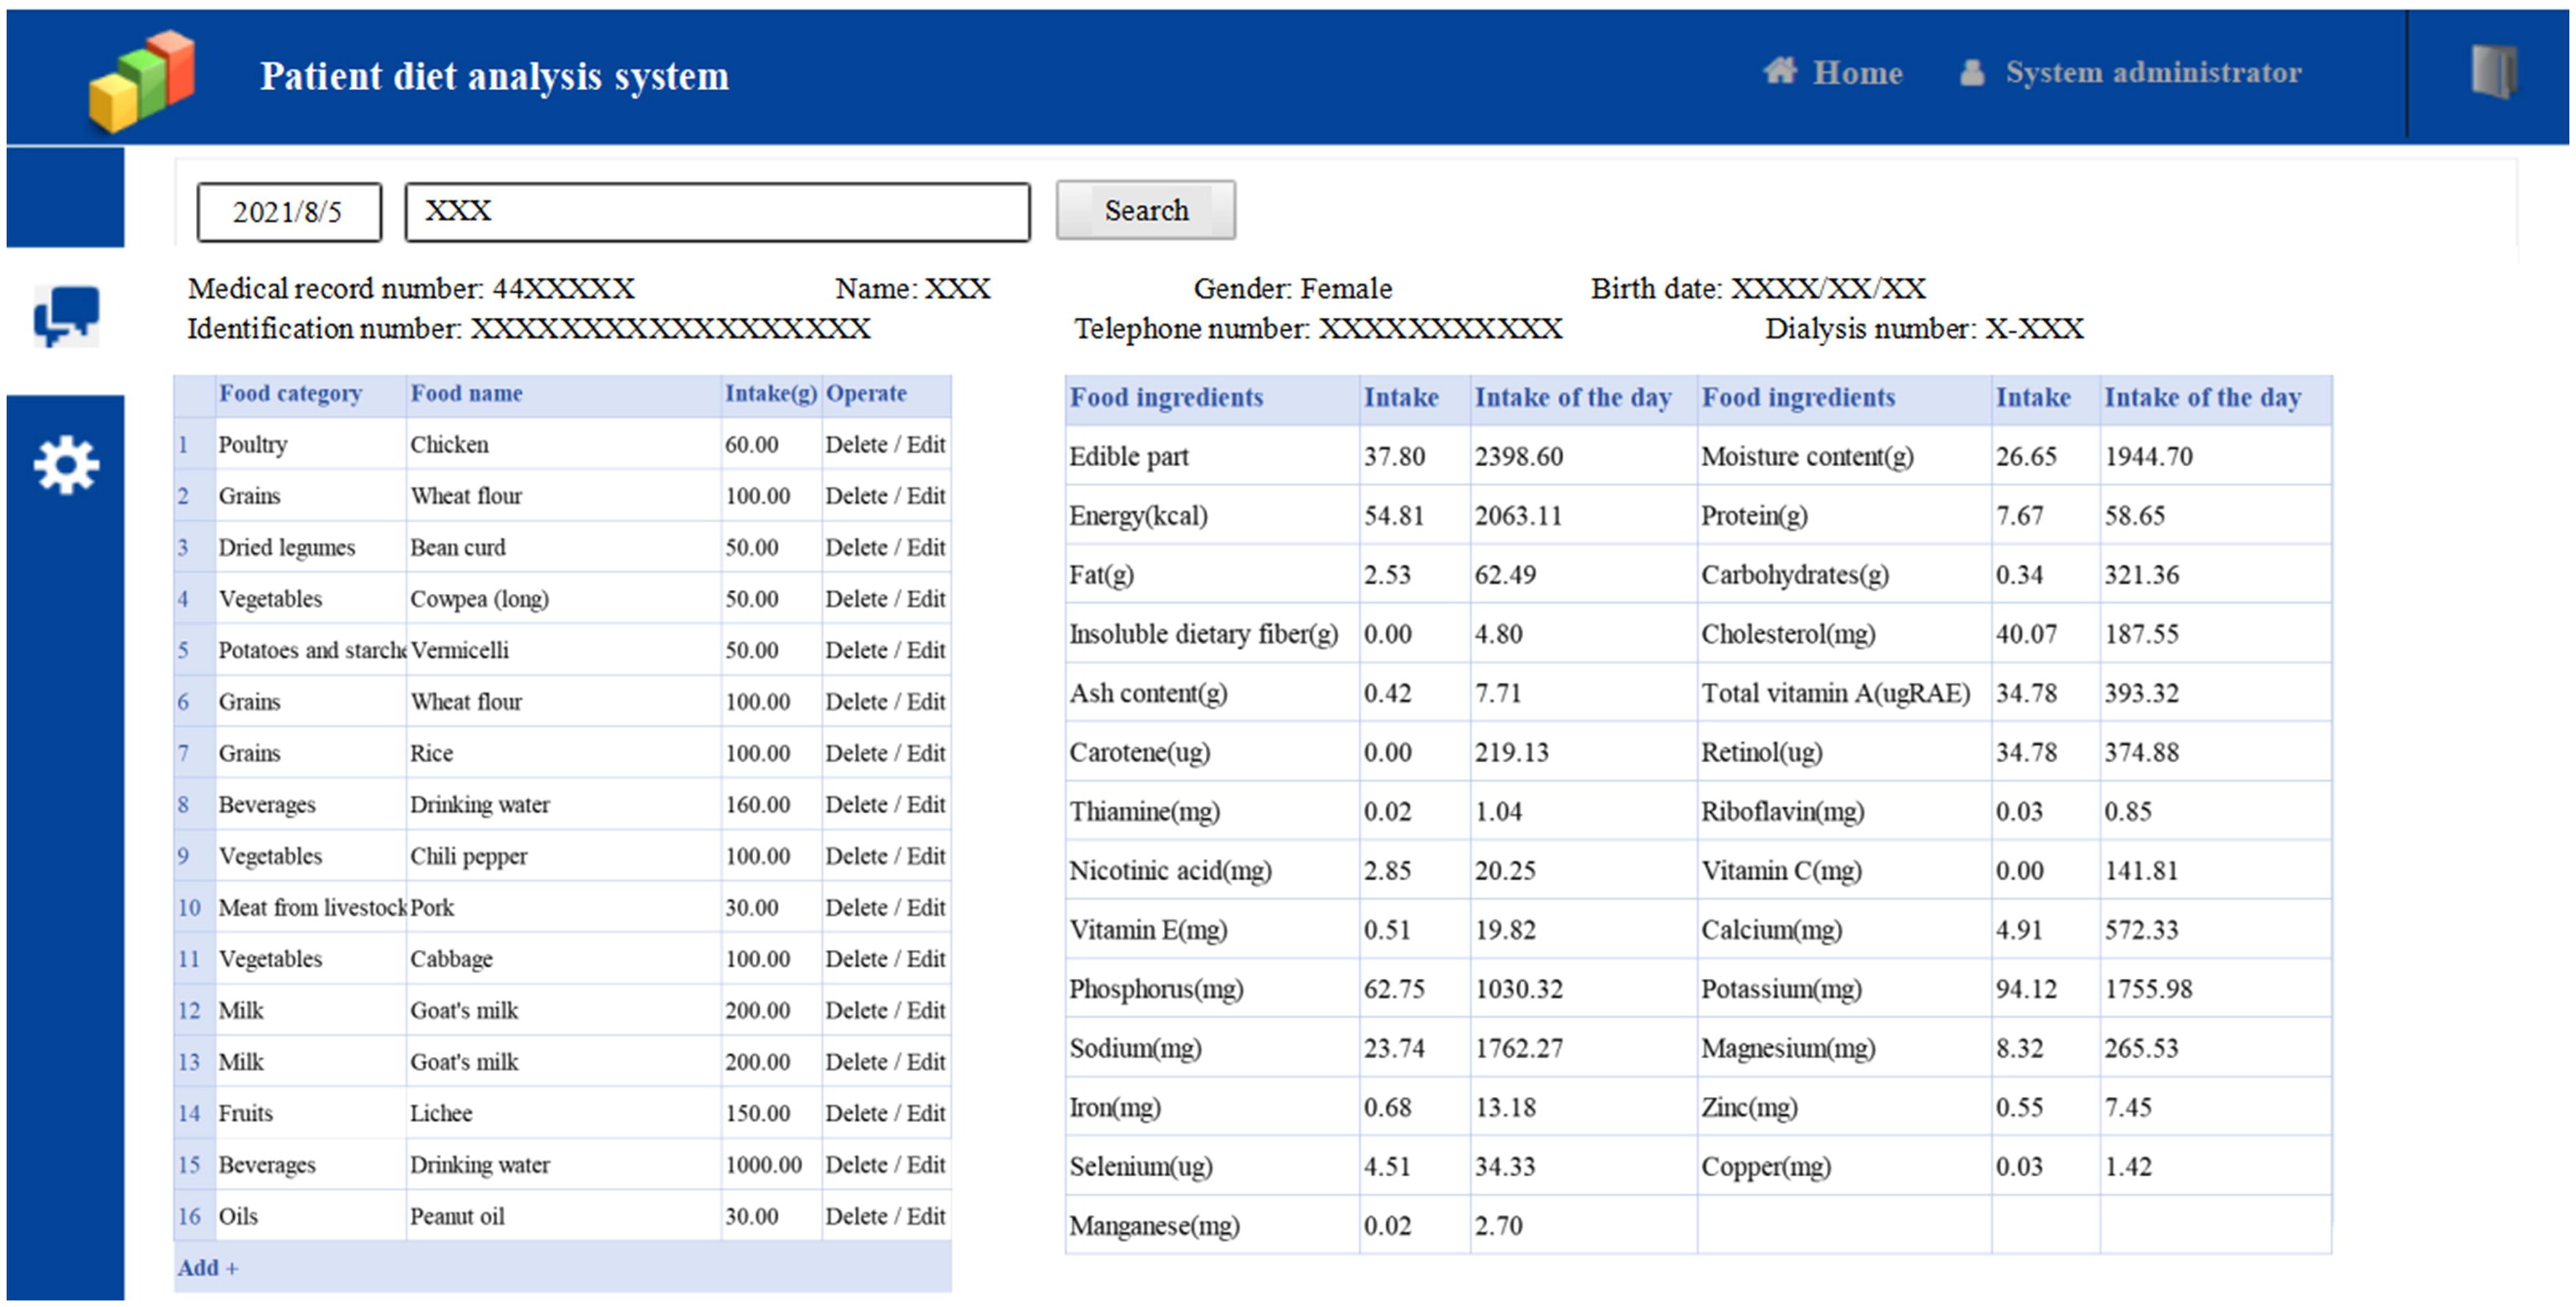
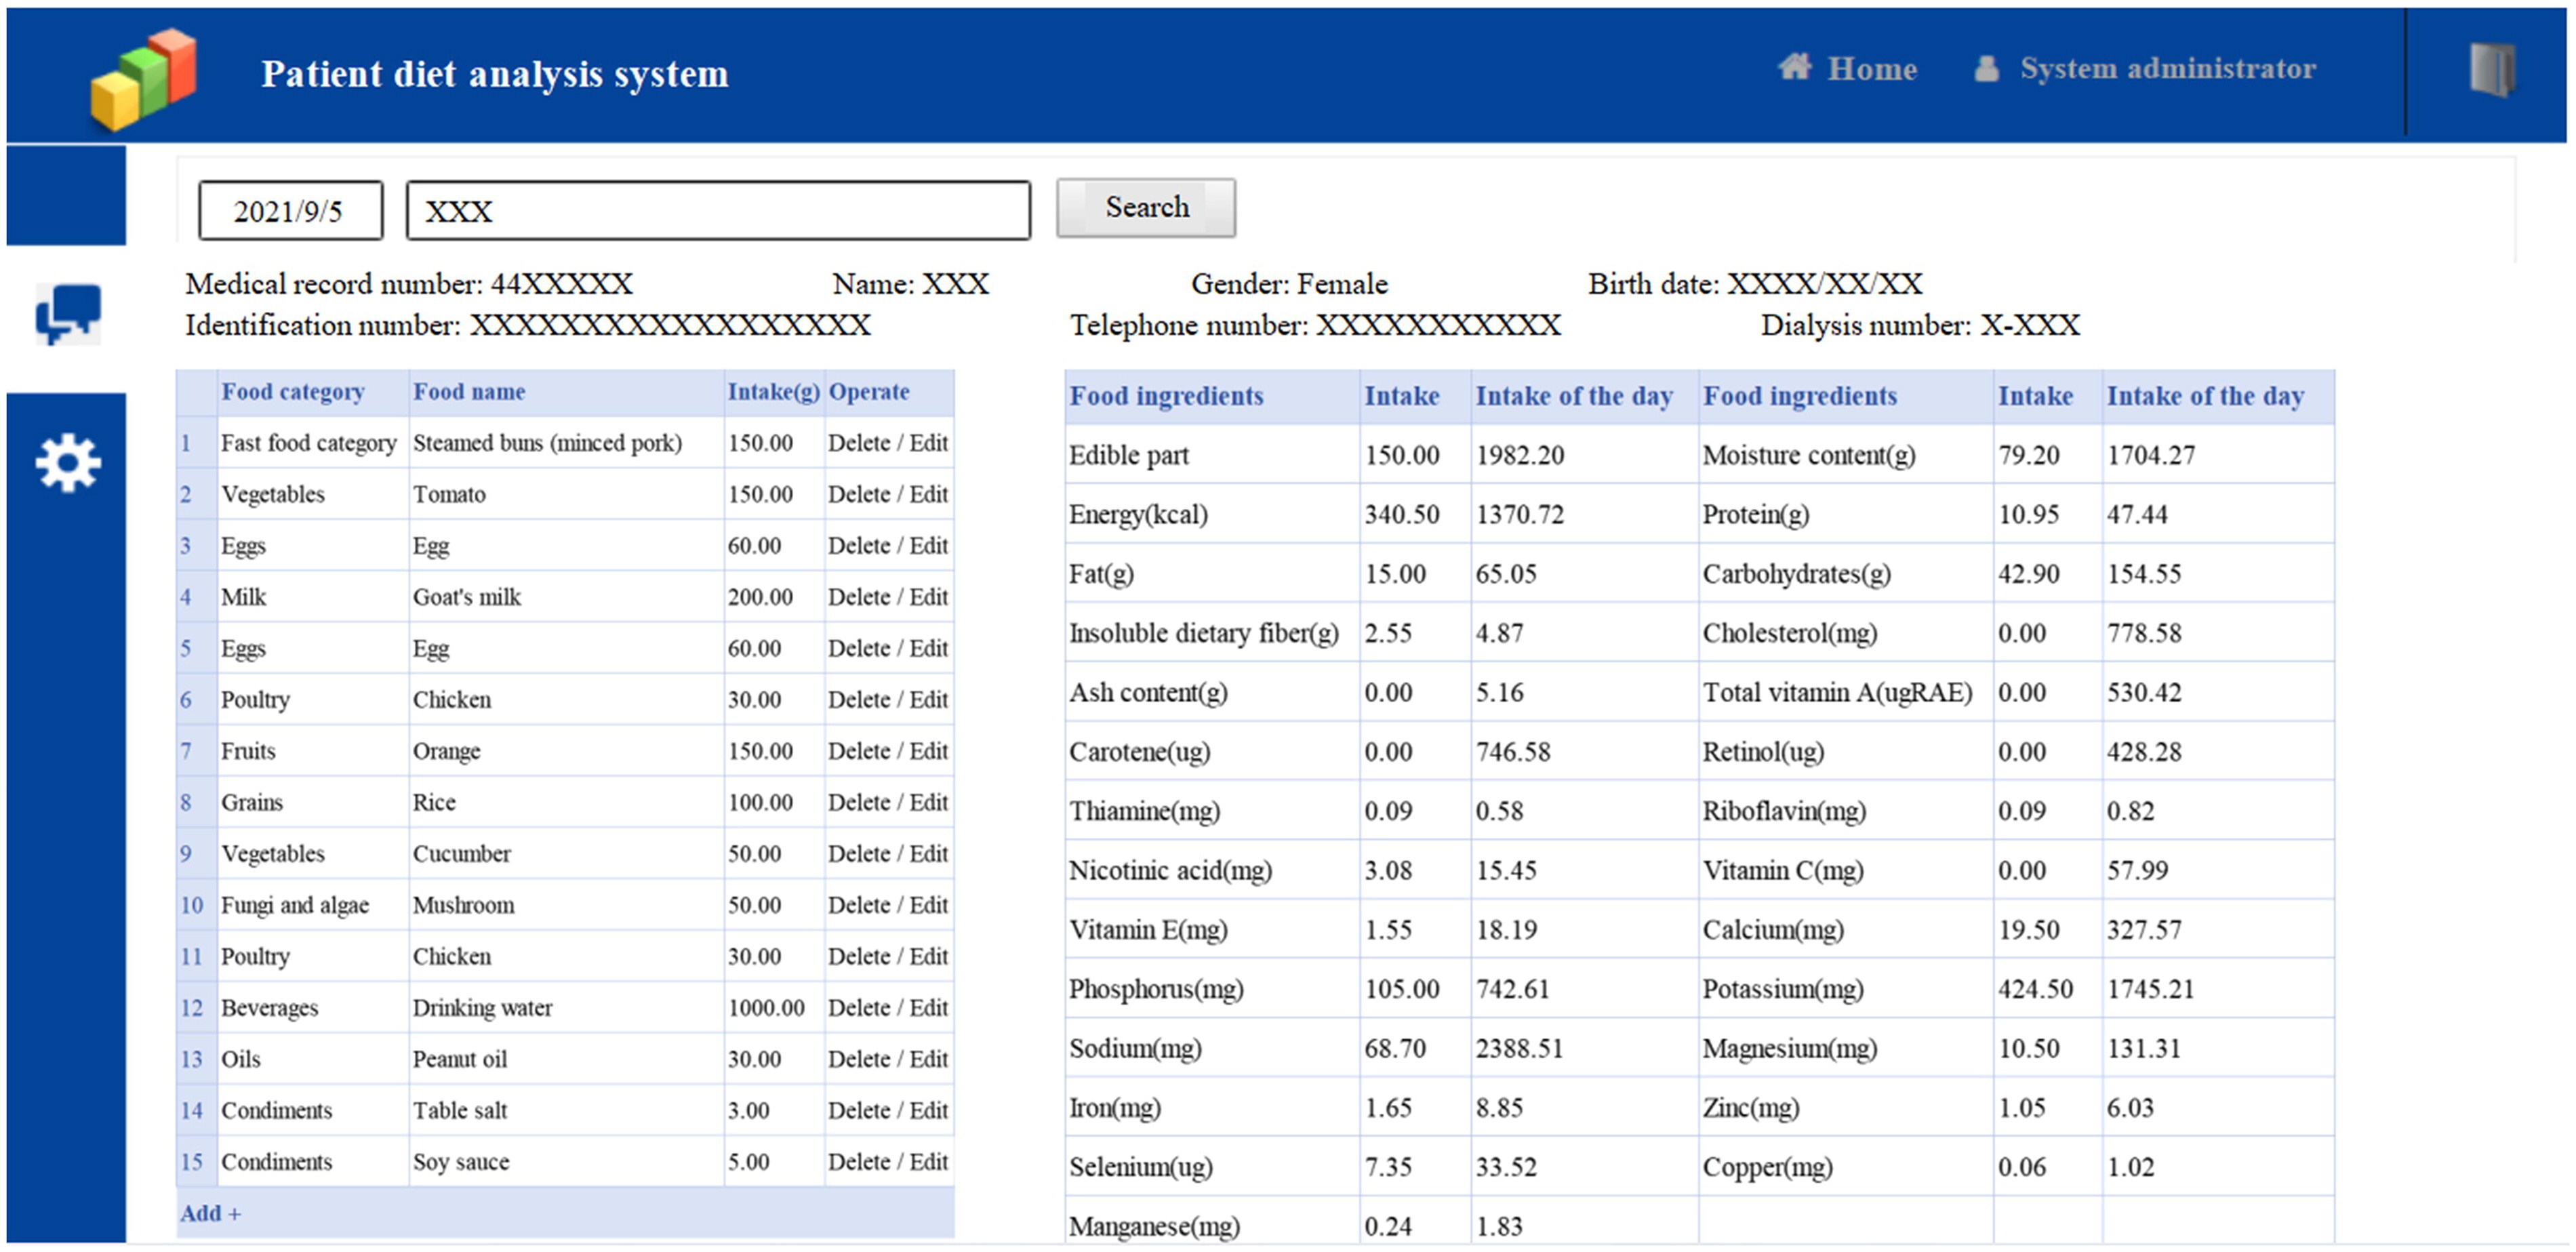
The first part of the patient diet analysis system, “Daily food intake”, we can input all of the daily food intake in this part. The following figures displays the patient’s three-day food intake record. The system automatically converts this information into detailed average nutrient intake data per day.
The first day of 3 consecutive days of recording food intake
The second day of 3 consecutive days of recording food intake
The third day of 3 consecutive days of recording food intake
The second part of patient diet analysis system, “Food composition averaged over three days”, automatically calculates and exports the details and average food intake data from the 3 consecutive days of food intake records.
The third part of patient diet analysis system, “Food composition standard” which is based on Chinese Food Composition Table 2019, details the nutrient content of each food per 100g of edible content.