
Abstract
Podocyte loss in glomeruli is a fundamental event in the pathogenesis of chronic kidney diseases. Currently, mitotic catastrophe (MC) has emerged as the main cause of podocyte loss. However, the regulation of MC in podocytes has yet to be elucidated. The current work aimed to study the role and mechanism of p53 in regulating the MC of podocytes using adriamycin (ADR)-induced nephropathy. In vitro podocyte stimulation with ADR triggered the occurrence of MC, which was accompanied by hyperactivation of p53 and cyclin-dependent kinase (CDK1)/cyclin B1. The inhibition of p53 reversed ADR-evoked MC in podocytes and protected against podocyte injury and loss. Further investigation showed that p53 mediated the activation of CDK1/cyclin B1 by regulating the expression of Wee1. Restraining Wee1 abolished the regulatory effect of p53 inhibition on CDK1/cyclin B1 and rebooted MC in ADR-stimulated podocytes via p53 inhibition. In a mouse model of ADR nephropathy, the inhibition of p53 ameliorated proteinuria and podocyte injury. Moreover, the inhibition of p53 blocked the progression of MC in podocytes in ADR nephropathy mice through the regulation of the Wee1/CDK1/cyclin B1 axis. Our findings confirm that p53 contributes to MC in podocytes through regulation of the Wee1/CDK1/Cyclin B1 axis, which may represent a novel mechanism underlying podocyte injury and loss during the progression of chronic kidney disorder.
Introduction
Chronic kidney disease (CKD) is a severe global health problem that affects approximately 10% of adults worldwide [Citation1]. Most cases of chronic kidney disease are caused by glomerular disease, which is characterized by podocyte injury and loss [Citation2]. Podocytes, a type of terminally differentiated epithelial cell, are vital components of the glomerular filtration barrier [Citation3]. Since podocytes are terminally differentiated cells, they lack proliferative capability and cannot be compensated by cell proliferation [Citation4]. The loss of podocytes impairs kidney function, leading to progressive glomerular disease and driving the development of chronic kidney disease [Citation5]. However, the mechanism underlying podocyte loss has not been fully elucidated.
Normal cell cycle progression is strictly controlled by cell cycle checkpoints [Citation6]. Loss of cell cycle checkpoints causes inappropriate entry of cells into mitosis, which triggers mitotic catastrophe (MC) [Citation6]. MC is a type of cell death that attempts to eliminate cells enduring aberrant mitosis [Citation7]. The cyclin-dependent kinase 1 (CDK1)/cyclin B1 complex has a dominant role in controlling mitosis initiation and exit [Citation8]. CDK1 activation depends on its phosphorylation status; when threonine 14 (T14) and tyrosine 15 (Y15) are phosphorylated, CDK1 is inactivated, but when threonine 161 (T161) is phosphorylated, CDK1 is activated. When cells are ready to enter mitosis, the inhibitory phosphorylation of T14 and Y15 is terminated by the Cdc25 phosphatase, leading to activation of the CDK1/cyclin B1 complex [Citation9,Citation10]. The kinase Wee1 is a major regulator of the CDK1/cyclin B1 complex [Citation11]. Wee1 is able to phosphorylate Y15 of CDK1, which restrains unscheduled entry into mitosis through inactivation of the CDK1/cyclin B1 complex [Citation12]. At the end of mitosis, CDK1 is re-phosphorylated by Wee1, leading to mitotic exit [Citation13]. The inhibition of Wee1 enhances the activation of the CDK1/cyclin B1 complex and induces premature mitosis, which can trigger MC to induce cell death [Citation14].
Currently, MC has emerged as a main cause of podocyte death and loss [Citation15,Citation16]. In response to various pathological stimuli, podocytes reenter the cell cycle; however, they cannot complete the process of mitosis due to incomplete mitosis, eventually leading to MC [Citation16]. Podocyte MC has been observed in numerous glomerular diseases, such as focal segmental glomerulosclerosis, immunoglobulin A nephropathy and membranous nephropathy [Citation4,Citation17]. Half of the podocytes in urine samples from diabetic patients are MC cells with the characteristics of binucleation, micronuclei and aberrant mitotic spindles [Citation18]. Podocyte MC is observed in kidney biopsies from patients with glomerular disorders and proteinuria [Citation19]. MC features, such as aberrant mitotic spindles, chromosome segregation and multinuclear morphology, are commonly observed in cultured podocytes following injury [Citation19,Citation20]. Several studies have shown that inhibiting podocyte MCs ameliorates podocyte injury and loss and proteinuria in mice with glomerular disorders [Citation21,Citation22].
The tumor suppressor protein p53 mediates multiple types of cell death, including MC [Citation23]. However, the role and mechanism of p53 in mediating podocyte MC have not been fully elucidated. Herein, this work investigated p53 as a vital mediator of podocyte MC and explored its possible molecular mechanism.
Materials and methods
Cell culture and treatment
The conditionally immortalized murine podocyte cell line MPC5 was obtained from the BeNa Culture Collection (Xinxiang, China). MPC5 cells were grown under permissive conditions at 33 °C in RPMI 1640 supplemented with 10% fetal bovine serum (FBS) and 20 U/mL mouse recombinant interferon-γ. To induce podocyte differentiation, MPC5 cells were cultured under nonpermissive conditions at 37 °C without IFN-γ for 12 days and then harvested for the experiments. The cells were maintained in serum-free medium for 6 h for synchronization and then treated with ADR (Selleck, Shanghai, China) at 0.4 μg/mL in culture media for 24 h under non-permissive conditions. To inhibit p53, the inhibitor pifithrin-α (PFTα; Selleck) was added to the cells at a concentration of 10 μM. To inhibit Wee1, the inhibitor MK-1775 (Selleck) was added to the cells at a concentration of 500 nM.
Cell cycle assay
Podocytes (5 × 10⁵) were harvested by centrifugation at 500 × g for 5 min after indicated treatments. Cells were washed and then suspended in 0.3 mL of phosphate-buffered saline (PBS). After adding 1.2 mL of ice-cold ethanol, the suspension was placed in a refrigerator at −20 °C overnight. Afterwards, cells were collected by centrifugation at 500 × g for 5 min and washed with PBS. Then, cells were suspended in RNase A solution (Elabscience, Wuhan, China), followed by incubation at 37 °C for 30 min. Then, PI solution (Elabscience) was added to the suspension, followed by incubation at 2–8 °C in the dark for 30 min. The samples were analyzed by flow cytometry to determine the cell cycle distribution.
Western blotting
Proteins in cells or tissues were extracted using RIPA buffer containing phosphatase and protease inhibitor cocktail. Protein lysates were separated via sodium dodecyl sulfate–polyacrylamide gel electrophoresis. Then, the proteins were transferred to PVDF membranes through electrotransfer experiments. The membranes were blocked with 5% nonfat-dried milk for 1 h at room temperature. Thereafter, the membranes were incubated with indicated primary antibodies diluted in blocking buffer at 4 °C overnight. The membranes were washed with TBST and probed with HRP-conjugated secondary antibodies for 1 h at room temperature. The immunoblotting bands on the membranes on the membrane were developed using the ECL reagents (Genshare Biotech, Xi’an, China). The membrane was scanned, and images were captured using a gel imager system. The antibodies used in this study were as follows: anti-phospho-Histone H3 (1:1000; Ser10; CST, Danvers, MA, USA), anti-Histone H3 (1:1000; CST), anti-γH2AX (1:2000; Ser139; Abcam, Shanghai, China), anti-H2AX (1:1000; Abcam), anti-GAPDH (1:5000; Sanying Biotech, Wuhan, China), anti-p53 (1:5000; Sanying Biotech), anti-phospho-p53 (1:1000; Ser15; CST), anti-acetyl-p53 (1:1000; Lys379; CST), anti-CDK1 (1:1000; CST), anti-phospho-CDK1 (1:1000; Tyr15; CST), anti-phospho-CDK1 (1:1000; Thr161; CST), anti-cyclin B1 (1:1000; Sanying Biotech), anti-Wee1 (1:500; Sanying Biotech), anti-synaptopodin (1:1000; Abcam), anti-podocin (1:2000; Abcam) and anti-desmin (1:5000; Abcam).
F-actin staining assay
Podocytes were seeded in a 96-well black bottom plate and cultured till they reached 80% confluence. After indicated treatments, the medium was carefully removed and the cells were washed with PBS. Then, cells were fixed with 4% paraformaldehyde at room temperature for 15 min. After fixation, cells were washed with PBS and then incubated with 0.1% Triton X-100 in PBS for 5 min. The permeabilized cells were washed with PBS and incubated with rhodamine-phalloidin conjugate working solution (Abcam, Shanghai, China) to stain F-actin. After incubation for 1 h at room temperature, the cells were rinsed with PBS and then incubated with DAPI solution to dye the nuclei. After adding mounting media, cells were observed using a fluorescence microscope.
Ki67 staining assay
Podocytes were seeded on coverslips coated with poly-L-lysine in a petri dish. After indicated treatments, the medium was discarded, and 4% paraformaldehyde in PBS was added to the cells for fixation at room temperature for 10 min. The cells were washed with ice-cold PBS and incubated with 0.1% Triton X-100 in PBS for permeabilization. The cells were washed and incubated with 1% BSA and 22.52 mg/mL glycine to block the nonspecific binding of the antibodies for 20 min at room temperature. Thereafter, the cells were incubated with an anti-Ki67 antibody (Abcam) in a humidified chamber for 1 h at room temperature. The cells were washed and incubated with a CoraLite647-conjugated secondary antibody (Sanying Biotech) for 1 h at room temperature in a dark box. After washing, DAPI solution was used to dye the nuclei. Coverslips were mounted with a drop of mounting medium and placed under a fluorescence microscope for observation.
LDH assay
Cell culture media were collected by centrifugation at 400 × g for 5 min after indicated treatments. The supernatants were collected and added to a 96-well plate at 120 μl/well. LDH working solution (60 μl) was added to each well, followed by incubation at room temperature for 30 min. The absorbance at 490 nm was determined using a microplate spectrophotometer.
Animal model establishment
Male C57BL/6 mice, aged 10 weeks and weighing 20 to 25 g, were obtained from the Medical Laboratory Animal Center of Xi’an Jiaotong University. An ADR nephropathy model was established according to a previously described protocol [Citation24]. ADR was dissolved in saline to prepare a 2 mg/mL solution, which was then administered to the mice. ADR was intravenously injected into mice at a dose of 20 mg/kg via the tail vein. Mice injected with the same volume of isotonic saline were used as a control. PFTα was intraperitoneally injected into mice at 2.2 mg/kg. Five weeks after ADR administration, the mice were placed in metabolic cages for 24 h of urine collection. After being anesthetized with 2% isoflurane inhalation, mice underwent cardiac puncture for blood collection. Subsequently, the mice were euthanized through intraperitoneal injection of an overdose of sodium pentobarbital (150 mg/kg). The kidneys were harvested for histopathological assessment. All the experimental protocols for the animal studies were approved by The Biomedical Ethics Committee of Health Science Center of Xi’an Jiaotong University (No. 2021-432). Animal experiments complied with the ARRIVE guidelines and were carried out in accordance with the National Research Council’s Guide for the Care and Use of Laboratory Animals.
Biochemical measurements
Urine albumin concentration was measured by a commercial ELISA kit (Elabscience, Wuhan, China). Urine creatinine level was determined by a creatinine colorimetric assay kit (Elabscience). The mouse urine samples were centrifuged at 1000 × g for 20 min. After centrifugation, the supernatants were collected for detection. The supernatants were added to the ELISA plate at 100 μl/well and incubated for 90 min at 37 °C. Thereafter, the liquid was discarded and biotinylated detection Ab working solution was added to the ELISA plate at 100 μl/well. After incubation for 60 min at 37 °C, the solution was discarded and the wells washed with washing buffer for three times. HRP conjugate working solution was added to the ELISA plate at 100 μl/well and incubated for 30 min at 37 °C. Then, the liquid was discarded and the wells were washed for three times. The substrate reagent was then added to ELISA plate at 100 μl/well and incubated for 15 min at 37 °C. After adding stop solution at 50 μl/well, the optical density of each well at 450 nm was measured with a micro-plate reader. Blood urea nitrogen (BUN) levels were assessed by a BUN colorimetric assay kit (Elabscience). Briefly, the blood samples was clotted overnight at 4 °C and then centrifuged at 1000 × g for 20 min. After centrifugation, the supernatants were collected for detection. The supernatants were collected and added to EP tubes at 20 μl/tube. The enzyme working solution was added to each tube at 25 μl and incubated for 10 min at 37 °C. Then, the detection reagents were added to each tube at 1 mL and incubated for 10 min at 37 °C. The absorbance at 580 nm was measured using a microplate spectrophotometer.
Kidney histological analysis
The mouse kidneys were fixed with 4% paraformaldehyde, embedded in paraffin and sliced into 4-μm sections for histological examination. The slices were stained with periodic acid-Schiff (PAS) solution (Solarbio, Beijing, China) according to the manufacturer’s instructions. The sections were washed with distilled water and then immersed in PAS oxidizing agent for 5 min at room temperature. After washing with distilled water, the sections were immersed in PAS solution for 20 min at room temperature in the dark. After washing with distilled water, the sections were incubated with hematoxylin solution for 2 min. Following ethanol dehydration and xylene transparency, the sections were sealed with neutral balsam. The slices were then photographed with a light microscope. The volume of the mesangial area and glomerular area was quantified using ImageJ software. The relative mesangial matrix area (%) was calculated using the formula: (mesangial matrix area/glomerular area) × 100%.
Immunofluorescence staining
Paraffin sections were deparaffinized and hydrated with xylene and gradient concentration of ethanol. Antigen retrieval was achieved by boiling the sections in 10 mM sodium citrate for 10 min in a microwave oven. The sections were then washed and treated with 3% H2O2 for antigen retrieval. The sections were blocked with 10% donkey serum for 30 min and then incubated with anti-WT-1 (Abcam, Shanghai, China) at 4 °C overnight in a wet box. The slices were washed and incubated with a Corallite 594-conjugated secondary antibody (Sanying Biotech) for 1 h in the dark. Nuclei were counterstained with DAPI for 5 min at room temperature. The slices were washed and mounted with a drop of mounting medium. Images were acquired using a fluorescence microscope.
Isolation of glomeruli and primary podocytes
Kidneys were perfused with inactivated Dynabeads diluted in Hanks’ balanced salt solution (HBSS). Then, the kidneys were excised, cut into small pieces and digested in HBSS containing collagenase A. After digestion, the tissues were passed through a 100-μm cell strainer on ice, followed by ice-cold HBSS flushing. The suspension was centrifuged to collect the cell pellet, which was then resuspended in HBSS, and glomeruli containing Dynabeads were collected using a magnetic particle concentrator. The glomeruli were plated onto type I collagen-coated dishes in RPMI 1640 medium at 37 °C. After culturing for 7 days, the glomeruli were removed, and the outgrowth cells were collected by trypsinization. Trypsinized cells were filtered through a 40-μm strainer and seeded onto collagen-coated dishes.
Transmission electron microscopy (TEM)
After resection from the experimental mice, the kidneys were cut into 1 mm3 pieces and incubated with 2.5% glutaraldehyde/PBS solution at 4 °C overnight. Thereafter, the tissue samples were washed with PBS and incubated with 1% osmium tetroxide at room temperature for 2 h. The tissue samples were then dehydrated in a series of ethanol solutions (70–100%), embedded in propylene oxide and Epon mix, and solidified in 100% epoxy resin for 48 h at 60 °C. Thereafter, the tissue samples were cut in to ultrathin sections using an ultramicrotome. The sections were stained with 1% uranyl acetate and 0.5% lead citrate. The stained sections were observed by TEM.
Statistical analysis
The results are expressed as the mean ± standard deviation. The experiments were independently conducted three times. Differences were determined by Student’s t test or one‐way analysis of variance followed by Tukey’s post hoc test using GraphPad Prism 8 software. When p < 0.05, the difference was considered to be statistically significant.
Results
MC is triggered by ADR in podocytes
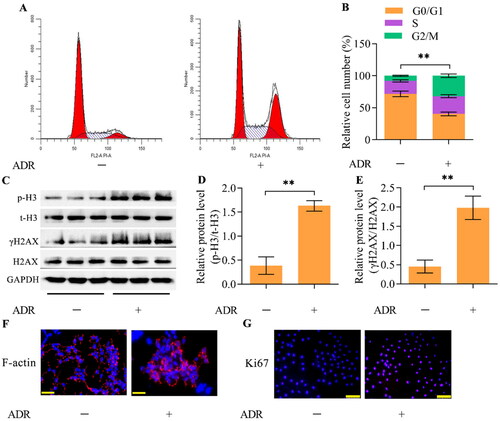
Flow cytometry analysis demonstrated that ADR treatment decreased the percentage of podocytes in G0/G1 phase while inducing the accumulation of podocytes in S and G2/M phases (), indicating reentry of podocytes into the cell cycle. To confirm that podocytes reenter the cell cycle and undergo mitosis in response to ADR, we measured the protein expression of the mitotic marker p-H3. Western blotting showed marked enhancement of p-H3 expression in ADR-stimulated podocytes (). Moreover, the level of γH2AX, a DNA damage marker, was also markedly upregulated in ADR-stimulated podocytes (). Morphological observation demonstrated that ADR triggered abnormal nuclear shapes with disarranged F-actin in podocytes (). Immunofluorescence staining for Ki67, a cell proliferation marker, demonstrated that the number of Ki67-positive podocytes was apparently elevated after ADR stimulation (). Collectively, these observations indicate that MC is triggered by ADR in podocytes.
Figure 1. ADR elicits MC in podocytes. MPC5 podocytes were treated with ADR at 0.4 μg/mL for 24 h. (A, B) The effect of ADR on the cell cycle distribution of podocytes was assessed by flow cytometry. (C-E) The effect of ADR on the levels of p-H3 and γH2AX was examined via Western blotting. (F) The effect of ADR on F-actin arrangement and nuclear morphology was observed by staining F-actin and nuclei (scale bar = 50 μm). (G) The effect of ADR on the podocyte proliferation state was assessed by immunofluorescence staining for Ki67 (scale bar = 100 μm). n = 3, **p < 0.01.
Hyperactivation of p53 and the CDK1/cyclin B1 axis in ADR-stimulated podocytes
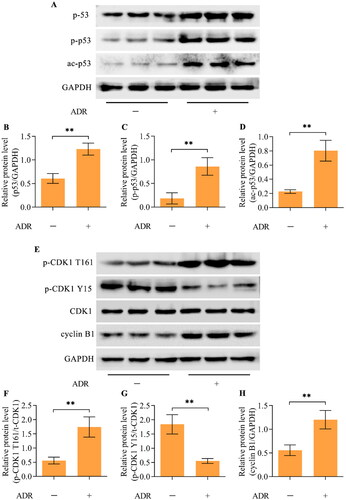
Western blotting revealed higher levels of the p53 protein in ADR-stimulated podocytes than in unstimulated podocytes (). Moreover, the active forms of p53, phosphorylated p53 (p-p53-Ser15) and acetylated p53 (ac-p53-Lys379), were also upregulated by ADR in podocytes (). Importantly, the active phosphorylation of CDK1 (Thr161) and p-CDK1 (T161) was enhanced by ADR stimulation, while the inhibitory phosphorylation of CDK1 (Tyr15) and p-CDK1 (Y15) was decreased by ADR stimulation (). Additionally, the level of cyclin B1 was also significantly augmented by ADR ().
Figure 2. ADR promoted hyperactivation of p53 and the CDK1/cyclin B1 axis in podocytes. (A-D) The levels of p53, p-p53 (Ser15), and ac-p53 (Lys379) in ADR-treated podocytes were measured via Western blotting. (E-H) The total CDK1 (t-CDK1), p-CDK1 (T161), p-CDK1 (Y15) and cyclin B1 levels in ADR-treated podocytes were detected via Western blotting. n = 3, **p < 0.01.
Inhibition of p53 blocks ADR-induced MC in podocytes
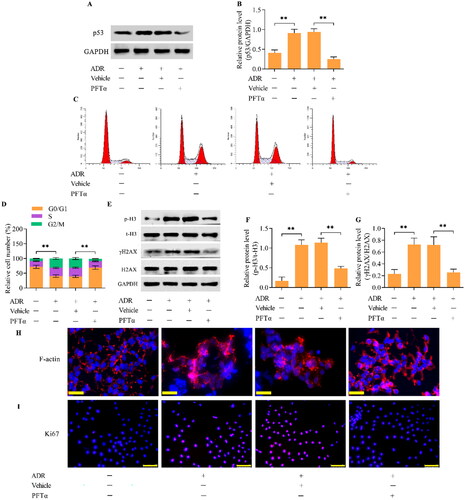
To investigate the role of p53 in mediating ADR-elicited MC in podocytes, we detected the effect of p53 inhibition on MC. We utilized PFTα, a specific inhibitor of p53, to inactivate p53 in ADR-simulated podocytes. Treatment with PFTα led to marked decreases in p53 levels in ADR-simulated podocytes (). The inhibition of p53 retarded the accumulation of podocytes in the S and G2/M phases (). The ADR-induced increase in p-H3 and γH2AX expression was markedly attenuated by p53 inhibition (). The increase in the percentage of podocytes with abnormal nuclear shapes and disarranged F-actin upon ADR stimulation was apparently reduced by p53 inhibition (). Furthermore, the inhibition of p53 also markedly decreased the number of Ki-67-positive cells in ADR-treated podocytes ().
Figure 3. The inhibition of p53 blocked ADR-induced MC in podocytes. MPC5 podocytes were treated with ADR at 0.4 μg/mL for 24 h in the presence of 10 μM PFTα. (A, B) The effect of PFTα treatment on p53 levels in ADR-stimulated podocytes was assessed by Western blotting. (C, D) The effect of p53 inhibition on the cell cycle distribution in ADR-stimulated podocytes was assessed by flow cytometry. (E-G) The effect of p53 inhibition on p-H3 and γH2AX levels in ADR-stimulated podocytes was examined by Western blotting. (H) The effect of p53 inhibition on F-actin arrangement and nuclear morphology in ADR-stimulated podocytes was observed by staining F-actin and nuclei (scale bar = 50 μm). (I) The effect of p53 inhibition on the proliferation of ADR-stimulated podocytes was assessed by immunofluorescence staining for Ki67 (scale bar = 100 μm). n = 3, **p < 0.01.
Inhibition of p53 alleviates ADR-evoked podocyte injury
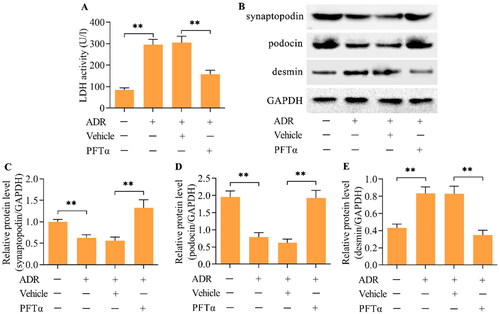
The results of the LDH assay showed high LDH activity in podocytes after ADR treatment, indicating that podocyte injury was induced by ADR (). Treatment with PFTα to inhibit p53 markedly alleviated ADR-induced podocyte injury (). Podocyte injury induced by ADR was further validated by the loss of podocyte differentiation markers, including synaptopodin and podocin (), and the increase in desmin, a pathological damage marker for podocytes (). Importantly, the inhibition of p53 restored the expression of synaptopodin and podocin while decreasing the expression of desmin ().
Figure 4. The inhibition of p53 relieved ADR-evoked podocyte injury. (A) The effect of p53 inhibition on ADR-evoked podocyte injury was monitored by measuring LDH activity. (B-E) The effect of p53 inhibition on synaptopodin, podocin and desmin levels in ADR-stimulated podocytes was examined by Western blotting. n = 3, **p < 0.01.
p53 mediates the activation of CDK1/cyclin B1 by Wee1
Western blotting demonstrated that the inhibition of p53 decreased the level of p-CDK1 (T161) while increasing the level of p-CDK1 (Y15) in ADR-stimulated podocytes (). Moreover, the ADR-induced upregulation of cyclin B1 was also reduced by p53 inhibition (). Considering that Wee1 is a major regulator of the CDK1/cyclin B1 axis, we next examined the effect of p53 inhibition on Wee1 expression. Importantly, Wee1 expression was decreased by ADR in podocytes, but this change was reversed by p53 inhibition (). To validate that Wee1 contributes to the p53-mediated activation of CDK1/cyclin B1, we detected the effect of Wee1 inhibition on the p53 inhibition-mediated effect in ADR-stimulated podocytes. MK-1775, a specific inhibitor of Wee1, was applied to inhibit Wee1 in ADR-stimulated podocytes. Treatment with MK-1775 markedly decreased the expression of Wee1 in podocytes treated with ADR and PFTα (). Moreover, the inhibition of p-CDK1 (T161) and increase in p-CDK1 (Y15) induced by p53 inhibition were reversed by Wee1 inhibition in ADR-stimulated podocytes (). The decrease in cyclin B1 induced by p53 inhibition was also reversed by Wee1 inhibition (). Importantly, the suppressive effects of p53 inhibition on ADR-elicited MC () and podocyte injury () were markedly abolished by Wee1 inhibition.
Figure 5. p53 mediates the Wee1/CDK1/cyclin B1 axis. (A-D) The effect of p53 inhibition on CDK1, p-CDK1 (T161), p-CDK1 (Y15) and cyclin B1 levels in ADR-treated podocytes was detected by Western blotting. (E, F) The effect of p53 inhibition on Wee1 levels in ADR-stimulated podocytes was monitored by Western blotting. n = 3, **p < 0.01 and ***p < 0.001.
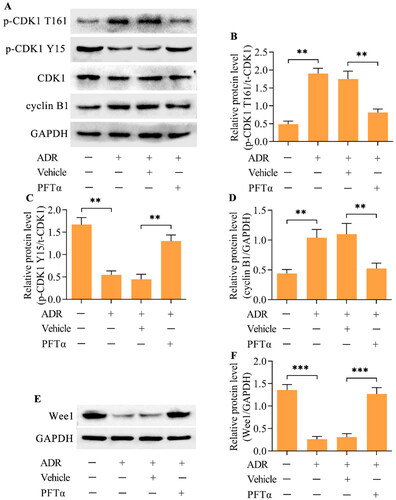
Figure 6. Inhibition of Wee1 reversed the p53 inhibition-mediated effects on the CDK1/cyclin B1 axis. ADR-treated podocytes were incubated with PFTα and MK-1775 for 24 h, and the levels of (A, B) Wee1, (C-F) p-CDK1 (T161), p-CDK1 (Y15) and cyclin B1 were measured via Western blotting. n = 3, **p < 0.01.
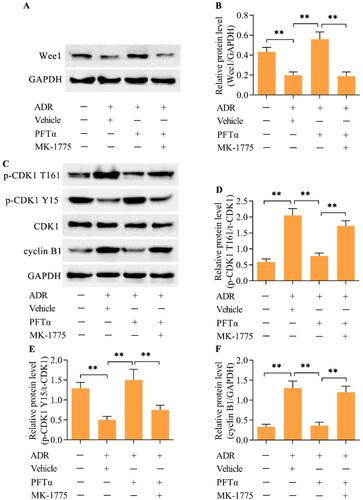
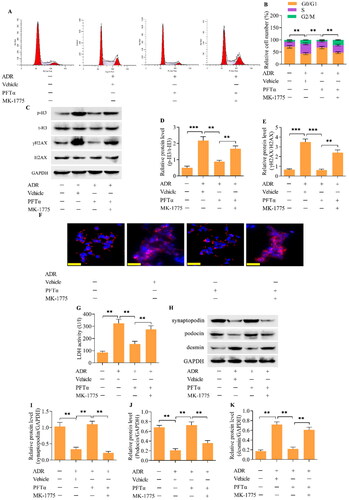
Figure 7. The inhibition of Wee1 reversed the p53-mediated suppression of MC in ADR-stimulated podocytes. (A, B) The cell cycle distribution was assessed using flow cytometry. (C-E) The levels of p-H3 and γH2AX were examined via Western blotting. (F) F-actin arrangement and nuclear morphology were observed by staining F-actin and the nucleus (scale bar = 50 μm). (G) Podocyte injury was monitored by measuring LDH activity. (H-K) The levels of synaptopodin, podocin and desmin were examined via Western blotting. n = 3, **p < 0.01 and ***p < 0.001.
Inhibition of p53 ameliorated podocyte injury and MC in a mouse model of ADR nephropathy in vivo
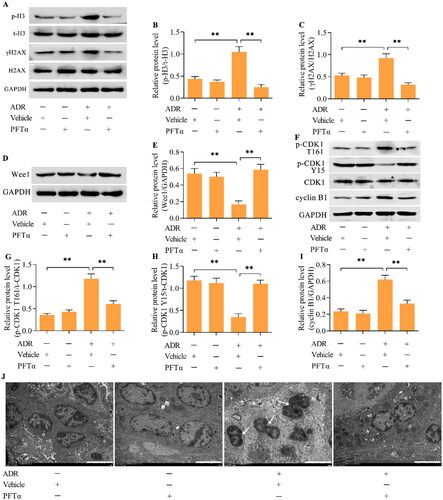
To further confirm that p53 mediates the MC phenotype in podocytes, we performed in vivo experiments using a mouse model of ADR nephropathy. ADR was intravenously injected into mice via the tail vein to induce ADR nephropathy. PFTα was intraperitoneally injected into mice to inhibit p53. The urinary albumin/creatinine ratio (UACR) and blood urea nitrogen (BUN) concentration were significantly greater in ADR-treated mice than in control mice (), indicating the successful establishment of ADR nephropathy. Interestingly, treating mice with the p53 inhibitor PFTα markedly decreased the UACR and BUN concentrations in mice with ADR nephropathy (). The increase in mesangial matrix expansion in the glomeruli of mice with ADR nephropathy was also attenuated by p53 inhibition (). The number of podocytes in the glomeruli was decreased in the mice with ADR nephropathy, which was markedly restored by p53 inhibition (). Moreover, the decreases in the levels of synaptopodin and podocin and increase in the level of desmin in the podocytes from mice with ADR nephropathy were reversed by p53 inhibition (). The expression of p-H3 and γH2AX was increased in the podocytes from mice with ADR nephropathy (). Furthermore, Wee1 levels were decreased (), p-CDK1 (T161) levels were increased (), p-CDK1 (Y15) levels were downregulated (), and cyclin B1 levels ( and ) were upregulated in podocytes from mice with ADR nephropathy. These observations indicate that the podocytes from mice with ADR nephropathy were enduring MCs. Crucially, the inhibition of p53 markedly reversed these phenomena, indicating a suppressive effect on podocyte MCs. The ultrastructure of podocytes from mice with ADR nephropathy showed binucleation with chromatin condensation, which was alleviated by p53 inhibition ().
Figure 8. The inhibition of p53 ameliorated ADR nephropathy in vivo. (A) UACR and (B) BUN in different groups of mice. (C, D) Representative images of PAS-stained kidneys and quantification of the relative mesangial matrix area (scale bar = 50 μm). (E, F) Representative images of WT-1-positive podocytes and the quantification of WT-1+ cells/glomeruli (scale bar = 50 μm). (G-J) the levels of synaptopodin, podocin and desmin in podocytes from mice were examined via Western blotting. n = 5, **p < 0.01 and ***p < 0.001.
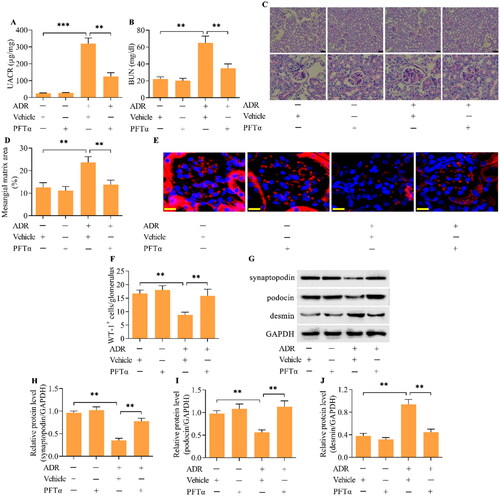
Figure 9. The inhibition of p53 blocked podocyte MCs in mice with ADR nephropathy in vivo. (A-C) Levels of p-H3 and γH2AX were examined via Western blotting. (D, E) The levels of Wee1 were detected by Western blotting. (F-I) The levels of p-CDK1 (T161), p-CDK1 (Y15) and cyclin B1 were assessed via Western blotting. (J) TEM examination of the ultrastructure of podocytes from different groups of mice (scale bar = 5 μm). n = 5, **p < 0.01.
Discussion
Podocytes are terminally differentiated cells that are restricted to a post mitosis state with no regeneration or repair activity. Under stress stimulation, podocytes may reenter the cell cycle [Citation25]. However, podocytes cannot accomplish cytokinesis due to their sophisticated cytoskeleton, which leads to abnormal mitotic spindles, chromosome segregation and multinuclear morphology; this phenomenon is known as MC [Citation17]. Crucially, the onset of mitosis is not a marker of podocyte regeneration but rather a pathological mechanism for podocyte death and loss [Citation17]. ADR nephropathy is a classical model for studying glomerular disease [Citation26]. In this work, we assessed whether podocyte MC occurred in ADR nephropathy. In ADR-stimulated podocytes in vitro, the percentage of cells in the G0/G1 phase decreased, while the percentage of cells in the S and G2/M phases increased, indicating that podocytes readopted the cell cycle. ADR also induced an increase in the expression of p-H3, a mitotic marker, and γH2AX, a DNA damage marker, in cultured podocytes. Moreover, binuclear cells with disarranged F-actin were observed in ADR-stimulated podocytes. These observations indicate that podocyte MC is triggered in response to ADR. Mulay et al. reported that aberrations in mitotic spindles, nuclear morphology and nuclear division were observed in ADR-exposed podocytes [Citation19]. A recent study determined that ADR stimulation induces the significant accumulation of podocytes in the S phase and increases the occurrence of binucleated podocytes [Citation21]. Thus, our findings are consistent with these studies, confirming that ADR evokes podocyte MC, which is a good model for investigating podocyte MC.
Although MC has been studied for a long time, investigations of podocyte MC have been sparse in recent years. The earliest study demonstrated that Notch activation propelled podocytes to override the G2/M checkpoint, leading to cytoskeleton disruption and death by MC [Citation27]. Later, it was found that podocytes are able to overcome the cell cycle checkpoint to initiate DNA synthesis and chromosome segregation; however, they cannot accomplish cytokinesis efficiently since their actin cytoskeleton is unable to assemble a correct mitotic spindle [Citation17]. Overexpression of murine double minute 2 (MDM2) induces podocyte MC in ADR nephropathy in vitro and in vivo [Citation19]. The transfection of the hepatitis B virus X gene into podocytes triggers abnormal nuclear changes, which reflect MC, contributing to podocyte injuries in patients with hepatitis B virus-related glomerulonephritis [Citation28]. Exposure to high glucose drives podocytes to enter the S phase and override the G2/M checkpoint, accompanied by increased expression of Ki67 and p-H3, which can be blocked by Notch inhibition [Citation20]. The loss of Krüppel-like factor 4 or glycogen synthase kinase 3 causes cell cycle reentry, resulting in podocyte MC [Citation19,Citation29]. High concentrations of growth hormone induce podocyte MC and proteinuria through the activation of transforming growth factor-beta signaling [Citation30]. Knockout of myeloid-derived growth factor exacerbates podocyte MC in ADR- and diabetes-induced glomerular disorders [Citation21]. The depletion of the long noncoding RNA MIAT ameliorated diabetic nephropathy via the suppression of podocyte MC [Citation22]. A recent study reported that the loss of Profilin1 in mouse podocytes led to severe proteinuria and kidney failure, which was attributed to podocyte MC [Citation31]. These studies indicate that podocyte MC may be controlled by various mediators through diverse mechanisms. Therefore, additional studies are needed to identify the pivotal regulators and clarify the precise mechanisms involved in podocyte MC.
The tumor suppressor protein p53 mediates multiple types of cell death, including MC [Citation23]. High expression of p53 contributes to the progression of numerous glomerular diseases. In our previous study, we also observed increased levels of acetylated p53 in the glomeruli of diabetic mice with low expression of the HIV-1 gene in podocytes [Citation32]. Knockout of murine double minute 2 (MDM2), an inhibitor of p53, triggers the onset of MC in podocytes [Citation33], highlighting the involvement of p53 in podocyte MC. However, the precise role and mechanism of p53 in mediating podocyte MC have not been fully elucidated. Herein, this work investigated the role of p53 in podocyte MC using ADR nephropathy. We showed that total p53 levels and phosphorylated and acetylated p53 levels were markedly increased by ADR stimulation in cultured podocytes. Activation of the mitosis-promoting complex CDK1/cyclin B1, a molecular feature of MC, was also observed along with p53 activation in ADR-stimulated podocytes. Our observations revealed that the active form of CDK1, p-CDK1 (T161), was enhanced, while the inactive form of CDK1, p-CDK1 (Y15), was decreased by ADR stimulation in podocytes. In addition, cyclin B1 levels were also elevated in ADR-stimulated podocytes. To determine the role of p53 in podocyte MC, we applied PFTα, a specific inhibitor of p53, to inactivate p53 in ADR-treated podocytes and evaluated the influence of p53 inhibition on podocyte MC. Importantly, we showed that the inhibition of p53 blocked cell cycle reentry, decreased the levels of p-H3 and γH2AX and reduced the number of binucleated cells with disarranged F-actin, suggesting the suppression of podocyte MC. Additionally, the activation of CDK1/cyclin B1 in ADR-stimulated podocytes was reversed by p53 inhibition. These findings indicate that increased activation of p53 contributes to podocyte MC, which may be associated with regulation of the activation of the CDK1/cyclin B1 complex.
The kinase Wee1 serves as a crucial regulator of the CDK1/cyclin B1 complex [Citation8]. Wee1 mainly induces inhibitory phosphorylation at CDK1 Y15, which is essential for mitosis onset and for mitotic exit [Citation13]. Therefore, Wee1 has been proposed as a promising target for manipulating MC. Indeed, Wee1 inhibitors, such as MK1775, have been applied to initiate MC to induce cell death in the treatment of cancers [Citation34]. Herein, we investigated whether p53 maintains the activation of the CDK1/cyclin B1 complex by regulating Wee1. We showed that p53 overactivation was accompanied by decreased Wee1 expression in ADR-stimulated podocytes, while p53 inhibition restored Wee1 expression. Importantly, the inhibition of Wee1 by MK1775 reactivated the CDK1/cyclin B1 complex, which was inhibited by p53 inhibition in ADR-stimulated podocytes. Moreover, the inhibitory effect of p53 inhibition on ADR-evoked podocyte MC and injury was reversed by Wee1 inhibition. Collectively, these results illustrate that p53 mediates the activation of the CDK1/cyclin B1 complex by regulating the expression of Wee1, which underlies ADR-evoked podocyte MC.
This work further investigated the role of p53-mediated podocyte MC in a mouse model of ADR nephropathy in vivo. Administration of the p53 inhibitor PFTα reduced the UACR and BUN in mice with ADR nephropathy. The increases in mesangial matrix expansion and podocyte loss in glomeruli from mice with ADR nephropathy were also reversed by p53 inhibition. Podocyte injury, demonstrated by the loss of synaptopodin and podocin and the increase in desmin in mice with ADR nephropathy, was also ameliorated by p53 inhibition. Moreover, abnormal nuclear shapes with disarranged F-actin were accompanied by high activation of the CDK1/cyclin B1 complex, decreased levels of Wee1 and increased levels of p-H3 and γH2AX in glomerular podocytes from mice with ADR nephropathy, indicating that the podocyte MC was involved in ADR nephropathy. Notably, all of these MC features and molecular events were reversed by p53 inhibition in mice with ADR nephropathy. These observations indicate that p53 inhibition protects against ADR nephropathy through the progression of podocyte MC.
Conclusions
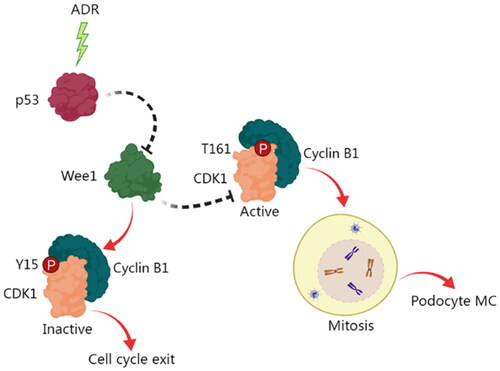
To the best of our knowledge, this work is the first to comprehensively study the exact role and mechanism of p53 in controlling the MC of podocytes. Our results showed that p53 may contribute to the activation of the mitosis-promoting complex CDK1/cyclin B1 via the inhibition of Wee1, which underlies podocyte MC (). Our work unveils a novel regulatory mechanism for podocyte, which may help explain podocyte injury and loss in glomerular diseases. Our findings offer a new perspective for understanding the progression of podocyte injury-related chronic kidney diseases. The preservation of podocytes by intervening with podocyte MC by targeting the p53-Wee1-CDK1/cyclin B1 pathway may be a promising therapeutic option for chronic kidney disease.
Figure 10. A schematic diagram of the role and mechanism of p53 in mediating the MC of podocytes. ADR stimulation induces the activation of p53, which in turn inhibits the activation of Wee1. This inhibition of Wee1 facilitates the activation of CDK1/cyclin B1, thereby promoting podocyte mitosis, and ultimately resulting in podocyte MC.
Authors’ contributions
Jie Feng designed the study, performed the experiments and wrote the manuscript. Liyi Xie, Wanhong Lu, and Hongjuan Dong performed the experiments. Xiaoyang Yu and Yuefeng Ma performed the data analysis and provided technical support. Ranran Kong contributed to the conceptualization and reviewed the manuscript. All the authors reviewed and approved the final version of the manuscript.
Ethical approval
All the experimental protocols for the animal studies were approved by The Biomedical Ethics Committee of Health Science Center of Xi’an Jiaotong University (No. 2021-432). Animal experiments complied with the ARRIVE guidelines and were carried out in accordance with the National Research Council’s Guide for the Care and Use of Laboratory Animals.
Disclosure statement
No potential conflict of interest was reported by the author(s).
Data availability statement
The datasets generated during and/or analyzed during the current study are available from the corresponding author upon reasonable request.
Additional information
Funding
References
- Collaboration GBDCKD. Global, regional, and national burden of chronic kidney disease, 1990-2017: a systematic analysis for the Global Burden of Disease Study 2017. Lancet. 2020;395(10225):709–733. doi: 10.1016/S0140-6736(20)30045-3.
- Torban E, Braun F, Wanner N, et al. From podocyte biology to novel cures for glomerular disease. Kidney Int. 2019;96(4):850–861. doi: 10.1016/j.kint.2019.05.015.
- Assady S, Wanner N, Skorecki KL, et al. New insights into podocyte biology in glomerular health and disease. J Am Soc Nephrol. 2017;28:1707–1715.
- Yin L, Yu L, He JC, et al. Controversies in podocyte loss: death or detachment? Front Cell Dev Biol. 2021;9:771931. doi: 10.3389/fcell.2021.771931.
- Wharram BL, Goyal M, Wiggins JE, et al. Podocyte depletion causes glomerulosclerosis: diphtheria toxin-induced podocyte depletion in rats expressing human diphtheria toxin receptor transgene. J Am Soc Nephrol. 2005;16(10):2941–2952. doi: 10.1681/ASN.2005010055.
- Vitale I, Galluzzi L, Castedo M, et al. Mitotic catastrophe: a mechanism for avoiding genomic instability. Nat Rev Mol Cell Biol. 2011;12(6):385–392. doi: 10.1038/nrm3115.
- Kimura M, Yoshioka T, Saio M, et al. Mitotic catastrophe and cell death induced by depletion of centrosomal proteins. Cell Death Dis. 2013;4(4):e603. doi: 10.1038/cddis.2013.108.
- Timofeev O, Cizmecioglu O, Settele F, et al. Cdc25 phosphatases are required for timely assembly of CDK1-cyclin B at the G2/M transition. J Biol Chem. 2010;285(22):16978–16990. doi: 10.1074/jbc.M109.096552.
- Parker LL, Piwnica-Worms H. Inactivation of the p34cdc2-cyclin B complex by the human WEE1 tyrosine kinase. Science. 1992;257(5078):1955–1957. doi: 10.1126/science.1384126.
- Solomon MJ, Lee T, Kirschner MW. Role of phosphorylation in p34cdc2 activation: identification of an activating kinase. Mol Biol Cell. 1992;3(1):13–27. doi: 10.1091/mbc.3.1.13.
- Coulonval K, Kooken H, Roger PP. Coupling of T161 and T14 phosphorylations protects cyclin B-CDK1 from premature activation. Mol Biol Cell. 2011;22(21):3971–3985. doi: 10.1091/mbc.E11-02-0136.
- Heald R, McLoughlin M, McKeon F. Human wee1 maintains mitotic timing by protecting the nucleus from cytoplasmically activated Cdc2 kinase. Cell. 1993;74(3):463–474. doi: 10.1016/0092-8674(93)80048-j.
- Chow JP, Poon RY, Ma HT. Inhibitory phosphorylation of cyclin-dependent kinase 1 as a compensatory mechanism for mitosis exit. Mol Cell Biol. 2011;31(7):1478–1491. doi: 10.1128/MCB.00891-10.
- Mak JP, Man WY, Chow JP, et al. Pharmacological inactivation of CHK1 and WEE1 induces mitotic catastrophe in nasopharyngeal carcinoma cells. Oncotarget. 2015;6(25):21074–21084. doi: 10.18632/oncotarget.4020.
- Jiang A, Song A, Zhang C. Modes of podocyte death in diabetic kidney disease: an update. J Nephrol. 2022;35(6):1571–1584. doi: 10.1007/s40620-022-01269-1.
- Liapis H, Romagnani P, Anders HJ. New insights into the pathology of podocyte loss: mitotic catastrophe. Am J Pathol. 2013;183(5):1364–1374. doi: 10.1016/j.ajpath.2013.06.033.
- Lasagni L, Lazzeri E, Shankland SJ, et al. Podocyte mitosis - a catastrophe. Curr Mol Med. 2013;13(1):13–23. doi: 10.2174/1566524011307010013.
- Hara M, Oohara K, Dai DF, et al. Mitotic catastrophe causes podocyte loss in the urine of human diabetics. Am J Pathol. 2019;189(2):248–257. doi: 10.1016/j.ajpath.2018.10.016.
- Mulay SR, Thomasova D, Ryu M, et al. Podocyte loss involves MDM2-driven mitotic catastrophe. J Pathol. 2013;230(3):322–335. doi: 10.1002/path.4193.
- Tang H, Lei CT, Ye C, et al. MDM2 is implicated in high-glucose-induced podocyte mitotic catastrophe via Notch1 signalling. J Cell Mol Med. 2017;21(12):3435–3444. doi: 10.1111/jcmm.13253.
- Zhan P, Zhang Y, Shi W, et al. Myeloid-derived growth factor deficiency exacerbates mitotic catastrophe of podocytes in glomerular disease. Kidney Int. 2022;102(3):546–559. doi: 10.1016/j.kint.2022.1004.1027.
- Wang Z, Chang Y, Liu Y, et al. Inhibition of the lncRNA MIAT prevents podocyte injury and mitotic catastrophe in diabetic nephropathy. Mol Ther Nucleic Acids. 2022;28:136–153. doi: 10.1016/j.omtn.2022.03.001.
- Ranjan A, Iwakuma T. Non-canonical cell death induced by p53. Int J Mol Sci. 2016;17(12):2068. doi: 10.3390/ijms17122068.
- Jeansson M, Björck K, Tenstad O, et al. Adriamycin alters glomerular endothelium to induce proteinuria. J Am Soc Nephrol. 2009;20(1):114–122. doi: 10.1681/ASN.2007111205.
- Macconi D, Bonomelli M, Benigni A, et al. Pathophysiologic implications of reduced podocyte number in a rat model of progressive glomerular injury. Am J Pathol. 2006;168:42–54.
- Lee VW, Harris DC. Adriamycin nephropathy: a model of focal segmental glomerulosclerosis. Nephrology (Carlton). 2011;16(1):30–38. doi: 10.1111/j.1440-1797.2010.01383.x.
- Lasagni L, Ballerini L, Angelotti ML, et al. Notch activation differentially regulates renal progenitors proliferation and differentiation toward the podocyte lineage in glomerular disorders. Stem Cells. 2010;28(9):1674–1685. doi: 10.1002/stem.492.
- Zhang Y, Chen Y, Yang F, et al. HBx transfection limits proliferative capacity of podocytes through cell cycle regulation. Acta Biochim Biophys Sin (Shanghai). 2014;46(12):1016–1023. doi: 10.1093/abbs/gmu102.
- Estrada CC, Paladugu P, Guo Y, et al. Kruppel-like factor 4 is a negative regulator of STAT3-induced glomerular epithelial cell proliferation. JCI Insight. 2018;3(12):e98214. doi: 10.1172/jci.insight.98214.
- Nishad R, Mukhi D, Singh AK, et al. Growth hormone induces mitotic catastrophe of glomerular podocytes and contributes to proteinuria. Cell Death Dis. 2021;12(4):342. doi: 10.1038/s41419-021-03643-6.
- Tian X, Pedigo CE, Li K, et al. Profilin1 is required for prevention of mitotic catastrophe in murine and human glomerular diseases. J Clin Invest. 2023;133(24):e171237. doi: 10.1172/JCI171237.
- Feng J, Bao L, Wang X, et al. Low expression of HIV genes in podocytes accelerates the progression of diabetic kidney disease in mice. Kidney Int. 2021;99:914–925.
- Thomasova D, Bruns HA, Kretschmer V, et al. Murine double minute-2 prevents p53-overactivation-related cell death (pdoptosis) of podocytes. J Am Soc Nephrol. 2015;26(7):1513–1523. doi: 10.1681/ASN.2014040345.
- Lewis CW, Bukhari AB, Xiao EJ, et al. Upregulation of Myt1 promotes acquired resistance of cancer cells to Wee1 inhibition. Cancer Res. 2019;79(23):5971–5985. doi: 10.1158/0008-5472.CAN-19-1961.