
Abstract
Honey is not equivalent to sugar and possess a worldwide health promoting effects such as antioxidant, antibacterial, anti-inflammatory, and hepatoprotective activities. Nevertheless, the potential impacts of honey on high-fat diet induced chronic kidney disease (CKD) and gut microbiota remain to be explored. Herein a high-fat diet was used to induce a mouse CKD model, and analysis was conducted on liver, kidney, spleen indices, tissue morphology, biochemical parameters, CKD related genes, and gut microbial diversity. The results indicated that significant inhibitory effects on renal damage caused by a high-fat diet in mice and improvement in disease symptoms were observed upon honey treatment. Significant changes were also found in serum TC, TG, UA, and BUN as well as the inflammation-related protein TNF-α and IL-6 levels in renal tissues. Gene expression analysis revealed that honey intake closely relates to gut microbiota diversity, which can regulate the composition of gut microbiota, increase microbial diversity, especially Bifidobacteriales and S24_7 and promote the synthesis of short chain fatty acids (SCFAs). In summary, this study suggests that honey has both preventive and therapeutic effects on CKD, which may be associated with its ability to improve microbial composition, increase microbial diversity, and regulate SCFAs levels.
1. Introduction
The global increase in chronic kidney disease (CKD) parallels the obesity epidemic. Obesity conveys a gradual but independent risk of progression of CKD that seems irrespective of the underlying nephropathy. Obesity has been associated with a secondary focal segmental glomerulosclerosis coined obesity-related glomerulopathy (ORG) [Citation1]. A population-based study revealed that high-fat dietary patterns increase the incidence of CKD [Citation2]. In addition, obesity-induced chronic inflammation provoked by high-fat diets has been shown to result in age-dependent renal amyloidosis in mice, contributing to kidney damage and dysfunction [Citation3]. Primary hypertension due to obesity is a known major risk factor for chronic kidney disease. Excessive accumulation of renal lipids due to obesity and hyperlipidemia can lead to glomerular and tubular pathology by promoting the production of reactive oxygen species (ROS) and lipid peroxidation, which can damage podocytes, proximal tubular epithelial cells and tubulointerstitial tissue [Citation4]. Some other diseases caused by obesity can also elevate the incidence of chronic kidney disease, such as Nonalcoholic fatty liver disease (NAFLD). NAFLD develops from fat accumulation in the liver, which can cause cirrhosis, end-stage liver disease, and hepatocellular carcinoma over time. The presence and severity of NAFLD and the risk of CKD has a strong positive correlation. Evidence suggests that typical metabolic syndromes displayed by NAFLD, such as insulin resistance and atherosclerotic dyslipidemia, can impair renal hemodynamics and renal vasculature through neurohumoral regulation and coagulation disorders, which, in combination with the presence of chronic inflammation, ultimately leads to renal damage [Citation5].
A prolonged high-fat diet can also impair the structure of intestinal microbiota and decrease the concentrations of short-chain fatty acids (SCFAs), contributing to conditions such as obesity, inflammation, and metabolic disorders. Several studies have shown that, compared to healthy individuals, CKD patients have reduced microbial diversity and an imbalance in certain bacterial species, such as increased abundance of pathogenic bacteria and decreased abundance of beneficial bacteria [Citation6–8]. The altered gut microbiota is believed to contribute to systemic inflammation and oxidative stress, leading to the progression of CKD and changes in gut microbial communities in CKD patients may result in decreased production of SCFAs such as butyrate, propionate, and acetate [Citation9,Citation10]. Thus, appropriate dietary management is essential for preventing and treating CKD and obesity. Apart from genetic background, the most widely accepted hypothesis of CKD treatment so far is nutritional management (especially diet) [Citation11]. In our previous study, we found that obese mice induced by a high fat and high sugar diet not only had fatty liver but also kidney swelling [Citation12]. Bee pollen extract has a significant improvement effect on kidney swelling in obese mice [Citation13,Citation14]. This may indicate that bee products rich in phenolic compounds not only have an improvement effect on NAFLD, but also have an improvement effect on obesity related complications CKD.
In fact, in folk, there are customs that many in the west have lemon and coffee or many Asian drink green tea to relieve the greasiness of daily diet. From a scientific perspective, these natural foods possess bioactive compounds that exhibit antioxidant and anti-inflammatory properties, which have been correlated with the prevention of kidney disease [Citation15]. However, long-term consumption of these foods may also affect gut microbiota, metabolism, and kidney function [Citation16]. Honey is a natural food product with high antioxidant, antibacterial, anti-inflammatory, immune regulation, wound repair, anti-tumor and other biological activities and medical value [Citation17,Citation18], which has made it popular among consumers. However, some people believe that honey can cause weight gain due to the presence of oligosaccharides. Our study showed that long-term consumption of honey in mice did not lead to weight gain and did not provoke insulin resistance, thus eliminating this misunderstanding [Citation12]. Erejuwa et al. [Citation19] found that the 16 week supplemental intake of honey had a positive effect on improving the renal impairment, metabolic acidosis, and structural abnormalities of kidney in Wistar rats fed with high-fat diet. This finding offers a new perspective for the adjunctive treatment of CKD, suggesting the potential use of natural foods rich in bioactive compounds as complementary medical interventions.
The phenolic compounds present in honey are the key drivers of its numerous biological activities [Citation20,Citation21]. These compounds are naturally abundant in various parts of plants, including seeds, bark, leaves, and flowers. During the bees’ nectar collection process, phenolic compounds are extracted and incorporated into honey [Citation22]. Catalkaya et al. [Citation23] have detailed the metabolic transformation of dietary polyphenols by the gut microbiota into more bioactive metabolites. Unabsorbed polyphenols from the small intestine pass into the large intestine, where they undergo microbial fermentation. This metabolic process involves various enzymes and pathways, such as deglycosylation, hydroxylation, methylation, and sulfation. These enzymatic modifications alter the structure of polyphenols, affecting their solubility, stability, and biological activity [Citation24]. The resulting metabolites, including short-chain fatty acids and phenolic acids, offer health benefits to the host by regulating intestinal barrier function and providing antioxidation, among other effects. Extending this research to other polyphenol-rich foods, Mahmoudi et al. [Citation25] demonstrated that olive phenolic compounds alleviated the hepatic and renal toxicity induced by the insecticide deltamethrin by modulating oxidative stress, inflammation, and apoptosis processes. Tzounis et al. [Citation26] showed that Cocoa flavonol extract increases the abundance of beneficial bacteria such as Bifidobacterium and Lactobacillus in the human intestine. In a similar vein, Massot Cladera et al. [Citation27] discovered that cocoa polyphenol extract could notably decrease the relative abundance of potentially harmful bacteria, including Bacteroides, Clostridium, and Staphylococcus. Bialonska et al. [Citation28] reported that pomegranate polyphenol extract not only promotes the growth of Bifidobacterium and Lactobacillus but also encourages the proliferation of certain bacteria that produce short-chain fatty acids, which are beneficial for the human intestine. Previous studies have found that among many intestinal microorganisms, Bifidobacterium is the most sensitive to polyphenols.
Given these findings, we hypothesize that honey and its phenolic compounds can alleviate renal damage induced by a high-fat and high-sugar diet and plan to investigate the differences in the effects of various sugars and honey treatments on high-fat mice, using sugar with an equal proportion to honey as a control. Combined with metabonomics, intestinal microbiome and transcriptome techniques, the effects of honey and the same proportion of sugar water intake on normal mice and CKD mice were studied.
2. Materials and methods
2.1. Chemicals and materials
The honey samples utilized in this study were collected from Apis cerana cerana, native to the Qinling Mountains, China, in August 2019. All non-honey chemicals were of analytical grade, encompassing ethanol and Folin-Ciocalteu reagent. Chemical standards, including phenolic compounds, as well as monosaccharides (fructose, glucose, sucrose) and maltose with a purity exceeding 98%, were procured from Sigma-Aldrich (Steinheim, Germany). Additional reagents were sourced from Nanjing Jiancheng Bioengineering Institute (Nanjing, China), which included biochemical indicators and ELISA kits.
2.2. The content of sugars and polyphenols in honey
The composition of phenols and sugars in the Honey and Sugar groups is shown in Supporting Information Table 1. The doses of active ingredients in the Honey and Sugar groups are equal. For example, the Honey group was given 1 g of honey (containing 0.42 mg of polyphenols and 768 mg of sugar), while the Sugar group was given an equal amount of 768 mg of sugar.
Table 1. Biochemical parameters and inflammatory factors response to CKD.
2.3. Animals and experimental design
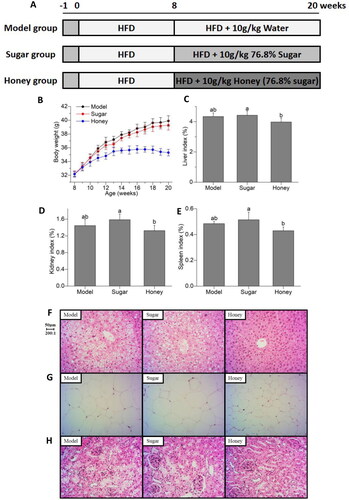
Male C57BL/6 mice (6-week-old, weight 20 ± 2 g, n = 36) were obtained from the Experimental Animal Center of Xi’an Jiaotong University, China (permission number: SCXK 2018-001). The study was conducted in accordance with the guidelines of the National Experimental Animal Administration issued by the State Committee of Science and Technology of the People’s Republic of China and approved by the Animal Ethics Committee of Northwest University. The animal experimental design is depicted in . After a 1-week acclimation period, mice were fed a high-fat diet (HFD) based on lard (45% energy from fat) for 2 months to induce kidney damage. Subsequently, mice were randomly assigned to three treatment groups, each comprising twelve animals, and received different treatments for an additional 2 months: (1) Model group, continued HFD; (2) Sugar group, administered 10 g kg−1 body weight (BW) sugar water daily (76.8% sugar); (3) Honey group, administered 10 g kg−1 BW honey daily (76.8% sugar).
Figure 1. Effect of honey on clinical indicators related to chronic kidney disease (CKD) (A) experimental grouping and design; (B) body weight; (C) liver index; (D) kidney index; (E) spleen index; (F) liver tissues H&E staining; (G) epididymal adipose tissues H&E staining; (H) kidney tissues H&E staining. Different lowercase letters on the same indicators correspond to significant differences at p < 0.05.
2.4. Sample collection and biochemical analyses
At the end of the experimental period, mice were fasted for 12 h, and then blood samples were collected for serum preparation by centrifugation. Part of the kidneys was used for histologic analysis, and the rest was applied to biochemical analysis and PCR assay.
ALT, AST, HDL, LDL, TC, TG, Creatinine (Cr), Uric acid (UA), and urea nitrogen (BUN) in the serum as well as NO, MDA, SOD, and GSH in the kidney tissue were analyzed using commercial detection kits (Nanjing Jiancheng Bioengineering Institute, Nanjing, China). The levels of inflammatory factors IL-6, tumor necrosis factor (TNF)-α, and Prostaglandin E2 (PGE2) in the kidney tissue were determined by ELISA kits (Nanjing Jiancheng Bioengineering Institute, Nanjing, China).
2.5. Histologic analysis
For the histological evaluation, liver, kidney, and epididymal adipose tissues that had been fixed were processed for paraffin embedding, sectioning, and H&E staining, followed by observation and photography. Semi-quantitative histopathological evaluations of the liver, kidney, and epididymal adipose tissues were performed according to Shackelford et al.’s method [Citation29]. Based on the histopathological scoring, the degree of tissue damage was categorized into 5 grades: grade 1 indicated minimal injury (<1%); grade 2 indicated mild (1–25%); grade 3 indicated moderate (26–50%); grade 4 indicated moderate-to-severe (51–75%); and grade 5 indicated severe/high (76–100%).
2.6. Quantitative real-time PCR analysis
As previously indicated [Citation20], total RNA from kidneys was isolated using Takara minibest universal RNA extraction kit. Then, reverse transcription was performed using primescript RT Master Mix Kit (Takara). Quantitative qRT-PCR analysis was performed on a gentier 96e real-time PCR detection system (Xi’an Tianlong Technology Co., Ltd.) using Takara TB green premix ex Taq. The QRT PCR procedure was followed by 5 min at 95 °C, 40 amplification cycles at 95 °C for 5 s, and annealing extension at 60 °C for 30 s. Using the 2−△△Ct formula, and β- Actin was normalized as an internal control gene.
Primers sequences are provided Supporting Information Table 2.
Table 2. Effects of honey on CKD-related mRNA.
2.7. Gut microbiota analysis
Illumina MiSeq Pyrosequencing and multivariate statistical analysis were used to analyze gut microbiota compositions referred to our previous description. As previously indicated [Citation20], genomic DNA was extracted from colon contents using tianamp fecal DNA Kit (dp328; Tiagen, Beijing, China) for further analysis [Citation30]. The DNA quality was assessed using 0.8% agarose gel electrophoresis, while DNA quantification was performed using a Nanodrop spectrophotometer (Thermo Scientific, New York, USA). The V3–V4 hypervariable regions of the microbiota 16S rRNA gene were amplified through PCR with a forward primer (5′-ACTCCTACGGGAGGCAGCA-3′) and a reverse primer (5′-GGACTACHVGGGT WTCTAAT-3′). The PCR system and amplification conditions were adopted from prior publications [Citation20]. PCR amplification products were visualized by electrophoresis on a 2% agarose gel and the desired fragments were extracted using a DNA gel extraction kit (Axygen, New York, USA). The amplified products were quantified using fluorescent quantitative PCR based on preliminary electrophoresis results. Samples were pooled in proportion to their sequencing requirements, and the resulting library was prepared using the truseq nano DNA LT library preparation kit (Illumina, San Diego, USA). The qualified sequencing library was subjected to Illumina miseq pyrosequencing analysis.
The original sequence datasets were deposited in the sequence read Archive (SRA) database of NCBI (SRA accession number: prjna531243, https://www.ncbi.nlm.nih.gov/sra/PRJNA531243).
2.8. The contents of SCFAs
100 mg Of each colonic content sample was suspended in 1.0 mL of n-hexane in a 1.5 mL EP tube and vortexed for 1 min. Then ultrasound treated for 10 min (incubated in ice water). Centrifuge for 10 min at 12,000 rpm at 4 °C. The upper ether solution was transferred to 1.5 mL vials for GC-MS analysis. 1 μL of sample was injected into an Agilent 7890B gas chromatograph system coupled with an Agilent 5977B mass spectrometer. The system utilized a HP-FFAP capillary column (60 m × 25 μm inner diameter × 0.25 μm film thickness). Helium was used as the carrier gas, the front inlet purge flow was 3 mL min−1, and the gas flow rate through the column was 1 mL min−1. The initial temperature was kept at 80 °C for 1 min, then raised to 150 °C at a rate of 5 °C min−1, then kept for 5 min at 230 °C at a rate of 40 °C min−1. The injection, transfer line, quad and ion source temperatures were 240, 240, 230 and 150 °C. The energy was −70eV in electron impact mode. The mass spectrometry data were acquired in full-scan mode with the m/z range of 20–200 after a solvent delay of 5 min.
2.9. Statistics and analysis
The data were analyzed using one-way ANOVA as previously indicated [Citation20], followed by Tukey’s post hoc tests, in SPSS software version 22.0 (SPSS, Inc., Chicago, IL, USA). Results are presented as the mean ± SD. Correlations between key gut microbiota communities and inflammation-related genes were assessed using Spearman’s rank correlation coefficient, based on pooled biochemical parameter and community data from all groups. Statistical significance was defined as p < 0.05. Original sequencing data integration, operational taxonomy unit (OTU) classification, alpha-diversity analysis (including Chao1, ACE, Simpson, and Shannon diversity indexes), and microbial composition analysis were performed using QIIME software (Quantitative Insights Into Microbial Ecology, v1.8.0) [Citation31,Citation32]. Beta-diversity refers to the similarity of community structure between different samples, and the key intestinal microbial communities were analyzed using multivariate statistical methods in R software. Specifically, principal component analysis (PCA) and LEfSe linear discriminant analysis (LDA) were used for this analysis [Citation33,Citation34]. Non-metric multidimensional scaling (NMDS) examined the abundance and diversity of the OTUs.
3. Results
3.1. Effects of honey on CKD symptoms
In this study, kidney damage was induced by high-fat diet in C57BL/6 mice, aggravated by treatment with sugar, and recovered by honey as illustrated in . The animal experimental design is shown in . Honey intake does not lead to weight gain, while sugar water intake in the same proportion as honey significantly increases the body weight of mice heavy (). There are not any differences of liver index, kidney index, and spleen index in the model and sugar group, while the honey group exhibited a significant decrease in them compared to the sugar group. Although there was no statistically significant difference between the honey group and the model group, which also showed a trend of improvement (, p < 0.05). In addition, the results also showed that honey improved the histopathological changes induced by HFD, including lower percentages of hepatocellular necrosis, ballooning degeneration and hepatic parenchyma reticularis in liver, swelled glomerulus, expanded capsule and proliferation of mesangial cell in kidney, and the area of adipocytes and the density of crown-like structures in epididymal fat (). Altogether, these findings underlined the preventive and therapeutic effects of honey on CKD.
3.2. Honey improve the biochemical parameter response to HFD
Biochemical parameter of ALT, AST, HDL, LDL, TC, TG, Cr, UA, and BUN were analyzed in serum, and NO, MDA, SOD, GSH, IL-6, TNF-α, and PGE2 were analyzed in kidney tissue (). Compared with the model and sugar group, the honey significantly improved TC, TG, UA, and BUN as well as the inflammation-related protein TNF-α and IL-6 levels after pretreatment with HFD (p < 0.05). Although there were no differences observed in AST (p = 0.28), HDL (p = 0.17), LDL (p = 0.14), GSH (p = 0.21), or PGE2 (p = 0.17), the average values of the honey group tended to be improved.
3.3. Honey affects CKD-related genes
The expression of genes was examined to assess fat synthesis and inflammatory response. Compare to the other groups, honey group exhibited significantly lower mRNA expression of INOS, IL-1β, IL-6, TNF-α, IFN-γ, and higher mRNA expression of SREBP (, p < 0.01 or 0.05).
3.4. Honey alters gut microbiota
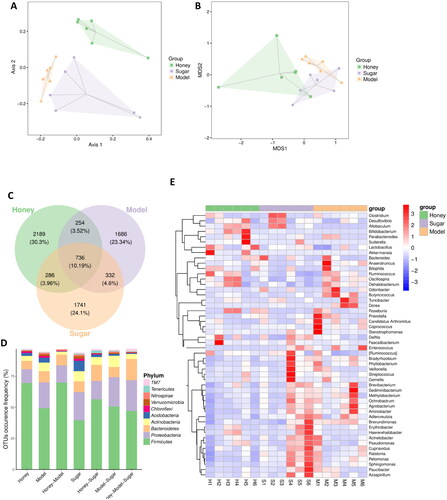
The gut microbiota operational taxonomic units (OTUs) of mice in the HFD, Honey, and Sugar groups were analyzed using Principal component analysis (PCA) and non-metric multidimensional scaling (NMDS) analysis, which resulted in clustering into three separate groups as shown in . The consumption of honey and sugar water was found to alter the composition of the gut microbiota in normal mice. The Honey group exhibited a higher number of unique OTUs (2189) when compared to the other two groups, indicating a higher gut microbiota diversity (). These findings indicate that the intake of honey led to an increase in the abundance of OTUs, indicating a higher gut microbiota diversity. The α-diversity of the gut microbiota was evaluated using the Simpson, Chao1, and Shannon indices, which reflect both the richness and evenness of the microbial community. The Honey group showed significantly higher values of Simpson, Shannon, and Chao1 indices when compared to the HFD and Sugar groups, indicating that honey intake does not have a negative impact on the α-diversity of the gut microbiota in normal mice, while equicaloric sugar water reduces its diversity (Supporting Information Table 3). These findings imply that sugar-equivalent honey is less disruptive to the gut microbiota than sugar solution. At the phylum level, the gut microbiota of the HFD, Honey, and Sugar groups were mainly composed of Firmicutes, Proteobacteria, Bacteroidetes, and Actinobacteria, with differences in their abundance. The Honey group had higher abundance of Firmicutes and lower abundance of Proteobacteria and Actinobacteria compared to the HFD group, while the Sugar group showed the opposite trend (). At the genus level, the top 50 differentially abundant bacteria included Paraprevotella, Ruminococcus, Dorea, Bacteroides, Adlercreutzia, and Lactobacillus (). Overall, these findings suggest that the gut microbiota composition of mice is significantly influenced by the consumption of honey and equicaloric sugar water. The intake of honey affects the β-diversity of the gut microbiota in normal mice, resulting in differences in its composition among the treatment groups. Honey intake also leads to an increase in the abundance of OTUs, indicating a higher gut microbiota diversity, while sugar solution reduces its diversity, highlighting the potential advantages of using honey as an alternative to sugar.
Figure 2. Honey restructures gut microbiota and microbial metabolites (A) principal component analysis (PCA) score plot; (B) non-metric multidimensional scaling; (C) Venn diagram of differential OTUs, OTU of gut microbiota in HFD, sugar, and honey groups of mice; (D) effects of different treatment on gut microbial structure at the phylum level of gut microbiota; (E) heatmap, by clustering, can distinguish between high-abundance and low-abundance OTUs, and reflect the difference in community composition between different groups of mice samples by color gradient.
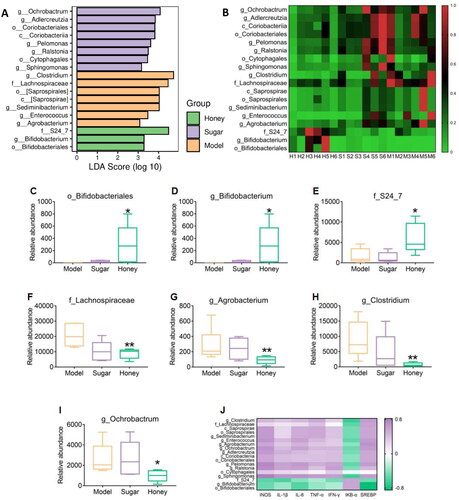
To investigate the effects of honey on the gut microbiota of mice, this study employed LEfSe linear discriminant analysis to identify differential gut microflora (). At the genus level, the Honey group mice demonstrated a significant decrease in the abundance of Clostridium and Ochrobactrum as compared to the HFD group mice, while no significant difference was observed in the Sugar group mice (). The Honey group exhibited a significant increase in Bifidobacteriales at both the order level (p < 0.05) () and the genus level (p < 0.05) () when compared to the HFD and Sugar groups. Additionally, the abundance of S24_7 bacteria was significantly increased (p < 0.05), while the abundance of Lachnospiraceae was significantly decreased (p < 0.01) at the family level in the Honey group (). At the genus level, apart from Bifidobacterium, the abundance of Agrobacterium, Clostridium, and Ochrobactrum was significantly decreased in the Honey group compared to the HFD group, but no significant difference was observed in the Sugar group (). To explore the relationship between the differential microbiota and CKD-related gene expression, Spearman correlation analysis was conducted based on the expression level of inflammation-related genes and the abundance of differential microbiota. The results showed a certain correlation between gene expression and differential gut microbiota abundance. In the Honey group mice, the dominant microbiota downregulated INOS and IL-1β, IL-6, TNF-α, IFN-γ, and SREBP gene expression, while upregulating IκB- α Gene expression ().
Figure 3. Differential gut microbiota (A) LEfSe linear discriminant analysis (LDA), LDA score higher than 3 indicates a higher relative abundance in the corresponding group than in other groups; (B) non-metric multidimensional scaling; (C–D) Bifidobacteriaceae in mice at the order and genus level; (E–F) S24_7, Lachnospiraceae in mice at the family level; (G–I) Actinobacteria, Clostridium, Ochrobactrum at the genus level, *p < 0.05, **p < 0.01 compared with HFD group; (J) Spearman correlation analysis, correlation between mRNA and differential bacteria.
3.5. The effect of honey on SCFAs in colonic content
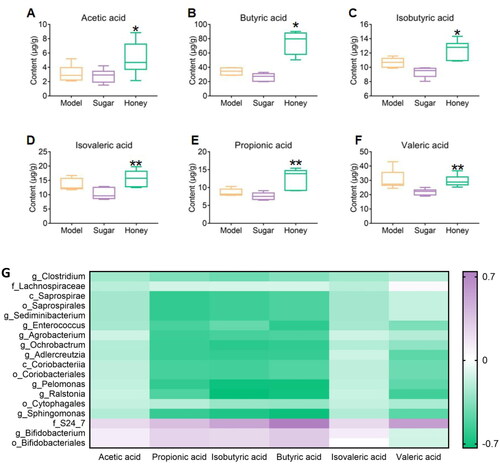
In this study, GC-MS was used to determine the content of Acetic acid, Propionic acid, Isobutyric acid, Butyric acid, Isovaleric acid, and Valeric acid in the gut microbiota of CKD mice and to explore the effect of honey on SCFAs in the gut microbiota. The results showed that the content of Acetic acid, Propionic acid, Isobutyric acid, and Butyric acid in the honey group mice was significantly higher than that in the HFD group mice (p < 0.05 or 0.01), while the content of Isovaleric acid and Valeric acid was significantly higher than that in the sugar group mice (p < 0.01, ). Furthermore, a certain correlation was observed between the level of SCFAs and differential microbial abundance. The dominant microbiota in the Honey group mice had a positive correlation with the level of SCFAs, whereas the weak microbiota had a negative correlation with them (). Honey consumption was found to affect the levels of SCFAs, which may be associated with the modulation of gut microbiota composition.
Figure 4. Significantly different short chain fatty acids (SCFAs) (A–F) acetic acid, butyric acid, isobutyric acid, isovaleric acid, propionic acid, valeric acid content respectively, * p < 0.05, ** p < 0.01 compared with HFD group; # p < 0.05, ## p < 0.01 compared with sugar group; (G) Spearman correlation analysis, correlation between SCFAs and differential bacteria.
4. Discussion
The principal finding of this study is that honey is not equivalent to sugar and its phenolic compounds reduce serum TC, TG, UA, and BUN levels in CKD mice induced by HFD, while significantly increasing SOD levels in kidney tissue and decreasing concentrations of NO, MDA, TNF-α, IL-6, and inflammation-related proteins. Furthermore, honey and its phenolic compounds were observed to have a positive effect on regulating the composition of gut microbiota, which may ultimately reduce the risk of CKD in mice. The improvement of lipid synthesis in the kidney, liver, and epididymis, intervention of oxidative stress homeostasis and inflammatory response, and remodeling of intestinal microflora especially Bifidobacteriales and S24_7. Besides, SCFAs were also found to contribute to the reduction of inflammatory response in CKD mice.
4.1. The interplay of oxidative stress, inflammation, and CKD in context
Recent studies indicate that both oxidative stress and inflammation, along with their synergistic effects, are crucial in the development and advancement of CKD [Citation32]. Inflammation is particularly significant in triggering the onset of kidney fibrosis. The process involves the stimulation of the kidney’s immune cells, followed by the attraction of various immune and fibrotic cells to the glomerular and interstitial regions of the kidney. This infiltration leads to a heightened generation of inflammatory cytokines [Citation35]. The activation of these leukocytes results in the production of reactive oxygen species (ROS), chlorine, and nitrogen species, which in turn exacerbate oxidative stress and contribute to its ongoing cycle. Concurrently, the stimulation of cells responsible for matrix production, coupled with the emission of cytokines that promote fibrosis, leads to an overaccumulation of the extracellular matrix (ECM). This excessive ECM buildup ultimately causes a progressive loss of renal structure and function [Citation15]. In turn, CKD is a systemic disease whose pathophysiological process involves the damage and repair of tissues and organs throughout the body. CKD can interfere with the normal functioning of the immune system, causing a systemic inflammatory response [Citation33]. CKD can also lead to systemic oxidative stress and microcirculation disturbances, which further exacerbate inflammation in the body [Citation36]. In addition, changes in the gut microbiome are particularly important for the inflammatory state of patients with CKD. The gut microbiome can influence the development and progression of CKD by mediating inflammatory processes, inducing immune responses, and metabolic abnormalities [Citation34]. Our study extends the previous observations [Citation37,Citation38] by demonstrating that a high-fat and high-sugar diet can trigger and exacerbate CKD, leading to disrupted homeostasis resulting from kidney or adipose tissue dysfunction, ultimately causing systemic inflammation. This inflammation can lead to imbalances in intestinal ecology and increased intestinal permeability, which in turn can alter intestinal function and further stimulate local and systemic inflammation while inducing immune cell migration to adipose tissue and kidneys. These consequences can exacerbate renal dysfunction and fat deposition. Notably, our results show that the phenolic compounds found in honey, rather than sugar water, are effective in improving CKD by reducing inflammatory reactions. In particular, the intake of honey and its phenolic compounds were found to affect the renal transcriptome of HFD mice, with differentially expressed genes primarily related to lipid synthesis, oxidative stress, and inflammatory reaction.
4.2. The role of abnormal lipid metabolism and oxidative stress in CKD
In renal physiology, normal lipid metabolism plays a crucial role [Citation39]. Moorhead [Citation40] previously proposed the key role of lipid toxicity in the progression of CKD. The kidneys utilize fatty acids for β-Oxidation produces energy, especially in proximal tubular cells, which require a large amount of energy to actively transport filtered sodium [Citation41]. Common abnormal lipid metabolism in CKD includes hyperlipidemia and lipid deposition. In CKD, lipid deposition mainly occurs in proximal tubular cells, podocytes, and mesangial cells. This deposition may lead to cellular dysfunction, thereby promoting the progression of kidney disease [Citation4]. HFD can exacerbate lipid deposition in the kidneys and is associated with kidney damage. In regulating fatty acid oxidation, AMP activated protein kinase (AMPK) and acetyl CoA carboxylase (ACC) are important regulatory factors that typically exhibit abnormalities in CKD [Citation42]. A high-fat diet in CKD can reduce renal AMPK activity, leading to reduced fatty acid oxidation and energy imbalance [Citation43]. In animal models, activating AMPK has shown beneficial effects on obesity related CKD [Citation44]. The relationship between oxidative stress and abnormal lipid metabolism is complex and can directly or indirectly damage renal tubular cells by promoting the formation of oxidative stress. Endoplasmic reticulum oxidative stress can induce lipid synthesis and fatty acid accumulation, which has been linked to the development of CKD and other various diseases [Citation45–47]. In previous studies, the effects of high-fat diets on renal tubular cells were simulated through experiments, revealing that endoplasmic reticulum stress caused by lipid accumulation can impair the function of renal tubular cells, ultimately leading to kidney damage [Citation48,Citation49]. Honey, with its antioxidant activity and ability to regulate oxidative stress homeostasis, often ameliorates oxidative stress-related inflammatory responses in organs such as the stomach, intestines, liver, kidneys, pancreas, testes, and blood. By modulating enzymatic antioxidant systems (such as SOD, GSH-Px, etc.) and non-enzymatic antioxidant systems (such as GSH, NO, etc.), honey regulates the balance between oxidative and antioxidant effects of the body, which may underlie its diverse pharmacological activities [Citation50].
4.3. Gut microbiota dysbiosis and its implications for obesity and kidney damage
The decline in diversity and abundance of gut microbiota is associated with an increased risk of obesity [Citation51]. Long term high-fat diets disrupt the structure of gut microbiota and reduce the abundance of their metabolites, leading to obesity, inflammatory reactions, and oxidative stress [Citation52]. Individuals with lower gut microbiota abundance are more susceptible to metabolic diseases characterized by obesity, blood lipids, and metabolic abnormalities, and exhibit a higher rate of body mass index increase over time [Citation53]. Some studies conducted high-fat diet intervention after transplanting the intestinal flora of morbid obese patients into the intestines of sterile mice. It was found that the expression of peroxisome proliferator activated receptors related to inflammation, lipid, lipoprotein and sterol metabolism was significantly up-regulated, thereby inducing obesity, insulin resistance and inflammatory diseases in sterile mice [Citation54]. Therefore, regulating lipid metabolism by improving gut microbial diversity and abundance may be an effective treatment method for kidney damage caused by a high-fat diet.
4.4. Honey and its phenolic compounds exerted CKD effects by maintaining the balance of gut microbiota
Honey is a supersaturated solution as a sugar, and its fructose and glucose may affect the composition of intestinal microbiota of CKD. Previous studies have shown that oligosaccharide such as fructooligosaccharides and oligo galactose can also affect the symbiotic intestinal microbiota. Potential beneficial microbial communities such as Lactobacilli and Bifidobacteria usually increase in the presence of phenolic compounds, while potential harmful microbial communities such as Clostridia and Enterobacteria typically decrease [Citation55]. The proliferation or colonization of Bifidobacterium in the intestine can improve obesity symptoms in high-fat diet mice, mainly by restoring the balance between lymphocytes and macrophages [Citation56]. The results of this study reveal the improvement effect of honey on intestinal oxidative stress and inflammatory response in CKD mice, and the effective component of honey is phenolic compounds rather than sugars. The types and contents of phenolic compounds in Apis cerana cerana honey used in the experiment are shown in of Supporting Information. According to their structures, phenolic compounds in honey can be divided into phenolic acids with hydroxybenzoic acid and hydroxycinnamic acid as the skeleton, and flavonoids and their derivatives with C6-C3-C6 structure. Ding et al. [Citation57] discovered in a rat model of diabetes nephropathy (DN), induced by a HFD and STZ, that quercetin is capable of lowering urinary microalbumin, serum Cr, hyperglycemia, and lipid metabolism disorders. Additionally, it mitigates renal tissue damage by suppressing ROS and the NLRP3 inflammasome. Furthermore, Firrman et al. [Citation58] discovered that quercetin, along with other compounds, could increase the relative abundance of Bifidobacterium and Lactobacillus, while suppressing the growth of Escherichiacoli, Clostridium histolyticum, and Enterococci. Li et al. [Citation59] investigated the impact of tea polyphenols’ primary constituents—epicatechin, catechuic acid, and gallic acid—on intestinal microbes using in vitro fermentation. Their findings revealed that these flavanols effectively inhibited the proliferation of pathogenic bacteria, including Clostridium perfringens, Clostridium difficile, and Bacteroides. Concurrently, there was a notable increase in the relative abundance of beneficial probiotics such as Bifidobacterium and Lactobacillus. Tzonuis et al. [Citation60] reported that epicatechin and catechol similarly promoted the growth of Bifidobacterium and Lactobacillus while suppressing Escherichia coli, Clostridium histolyticum, and Enterococcus. In our study, we observed a significant increase (p < 0.05) in the abundance of Bifidobacteria in the Honey group mice compared to the HFD and Sugar groups, at both the order and genus levels. Additionally, the dominant microbiota S24_7 was significantly amplified in the Honey group. S24_7, a part of Bacteroidetes, was reported to correlate with carbohydrate degradation and positively associated with the production of fecal short-chain fatty acids [Citation61]. The dominant microbiota Bifidobacteriales, S24_7, and SCFAs such as acetic acid in Honey group mice showed a positive correlation, while the weaker microbiota Clostridium, Ochrobactrum, Lachnospiraceae showed a negative correlation such as Butyric acid and Valeric acid with SCFAs. Previous study found that the abundance of Bifidobacteriales, Lachnospiraceae, Faecalibacterium and other gut bacterial taxa was generally decreased, while that of S24_7, Escherichia coli and other gut bacteria was significantly increased in patients with CKD in Chinese population, and these changes were related to renal inflammation and its complications [Citation9], which supports our inferences. The above analysis indicates that honey (not sugar water) improves high-fat diet induced CKD mice by regulating intestinal microbiota. Futhermore, honey, as a natural dietary source that improves the composition and function of the gut microbiota, has potential health benefits. Further exploration is needed to determine whether the anti-CKD effect of polyphenols is mediated by the gut microbiota.
4.5. The application of multi omics technology in the field of food
Biochemical processes are complex and variable. Relying solely on a single omics approach to study the interaction between food bioactive compounds and gene functions is insufficient to elucidate the entire biological phenomenon. Therefore, the comprehensive application of multiple omics techniques is crucial for thoroughly elucidating the effects of dietary bioactive ingredients and nutritional patterns on cellular, organ, and systemic metabolism. Mythri et al. [Citation62] synthesized data from multiple omics and epigenetics perspectives, emphasizing that dietary polyphenols provide neuroprotection by improving oxidative stress, mitochondrial dysfunction, and protein aggregation pathways. Zhou et al. [Citation63] used transcriptomic and metabolomic analyses to demonstrate the synergistic benefits of supplementing quercetin and resveratrol in mice fed HFD. In our study, 16S rRNA sequencing was used to monitor the dynamics of the gut microbiota, and it was found that the gut microbiota was regulated by honey polyphenol intake. Meanwhile, the changes in short chain fatty acids were characterized using metabolomics methods. These findings emphasize the necessity of integrating different omics methods to delve deeper into potential interrelated mechanisms. The NF-κB pathway represents a crucial downstream inflammatory signaling pathway. Upon receiving stimulation, IκB undergoes ubiquitination and subsequent degradation, ultimately facilitating the induction of target gene transcription via the translocation of the P50/P65 dimer to the nucleus. Notably, this activity promotes structural enhancements in both the diversity and composition of the gut microbiome [Citation64]. In this study, honey is likely to modulate the phosphorylation and degradation of IκB-α by stimulating IκB-α kinase or inactivating phosphatases, thereby affecting the NF-κB signaling pathway. It can be expected that multi omics techniques can comprehensively reveal the mechanism of the impact of Apis cerana cerana honey on CKD. The metabolic pathway indirectly affected is NF- κB signaling pathway.
5. Conclusion
In this study, we have demonstrated that honey has both preventive and therapeutic effects on chronic kidney disease (CKD) induced by a high-fat diet. Specifically, honey intake resulted in a reduction in body weight, as well as improvements in liver index, kidney index, and spleen index, with concurrent improvements in histopathological changes associated with the liver, kidney, and adipose tissue. Additionally, honey consumption led to improved biochemical parameters such as TNF-α, IL-6, TC, TG, UA, and BUN, while the expression of INOS, IL-1β, IL-6, TNF-α, IFN-γ was downregulated, and the expression of SREBP and IκB-α genes was upregulated. Furthermore, our findings suggest that honey intake can influence the gut microbiota composition of mice, leading to increased diversity and variations in specific bacteria at various taxonomic levels. Honey consumption also positively affected the α-diversity of the gut microbiota, as evidenced by an increase in the abundance of OTUs. Moreover, honey intake resulted in differences in the gut microbiota composition among the Honey groups, indicating an impact on the β-diversity of the gut microbiota. Finally, honey and its phenolic compounds intake was found to significantly increase the levels of SCFAs, thereby revealing its potential to modulate gut microbiota metabolites associated with CKD development. Taken together, these results highlight the promising use of honey as a dietary supplement for the prevention and treatment of CKD. Our study also proposes a potentially valuable dietary concept for replacing equal amounts of monosaccharides with honey, which can provide a theoretical basis for the prevention of CKD and obesity. Importantly, our findings may serve as a useful reference for developing functional foods using bee products with antioxidant and anti-inflammatory properties.
Author contributions
Suggestions: software, writing—review and editing, designed the research, performed the research, writing—original draft preparation, investigation, supervision, project administration, funding acquisition, etc.
Supplemental Material
Download PDF (351.8 KB)Acknowledgement
All authors participated in reviewing the manuscript and have no conflicts to declare.
Disclosure statement
No potential conflict of interest was reported by the author(s).
Additional information
Funding
References
- de Vries APJ, Ruggenenti P, Ruan XZ, et al. Fatty kidney: emerging role of ectopic lipid in obesity-related renal disease. Lancet Diabetes Endocrinol. 2014;2(5):1–15. doi: 10.1016/S2213-8587(14)70065-8.
- Asghari G, Momenan M, Yuzbashian E, et al. Dietary pattern and incidence of chronic kidney disease among adults: a population-based study. Nutr Metab. 2018;15(1):88. doi: 10.1186/s12986-018-0322-7.
- van der Heijden RA, Bijzet J, Meijers WC, et al. Obesity-induced chronic inflammation in high fat diet challenged C57BL/6J mice is associated with acceleration of age-dependent renal amyloidosis. Sci Rep. 2015;5(1):16474. doi: 10.1038/srep16474.
- Gai Z, Wang T, Visentin M, et al. Lipid accumulation and chronic kidney disease. Nutrients. 2019;11(4):722. doi: 10.3390/nu11040722.
- Targher G, Byrne CD. Non-alcoholic fatty liver disease: an emerging driving force in chronic kidney disease. Nat Rev Nephrol. 2017;13(5):297–310. doi: 10.1038/nrneph.2017.16.
- Nallu A, Sharma S, Ramezani A, et al. Gut microbiome in chronic kidney disease: challenges and opportunities. Transl Res. 2017;179:24–37. doi: 10.1016/j.trsl.2016.04.007.
- Sampaio-Maia B, Simões-Silva L, Pestana M, et al. The role of the gut microbiome on chronic kidney disease. Adv Appl Microbiol. 2016;96:65–94. doi: 10.1016/bs.aambs.2016.06.002.
- Vaziri ND, Wong J, Pahl M, et al. Chronic kidney disease alters intestinal microbial flora. Kidney Int. 2013;83(2):308–315. doi: 10.1038/ki.2012.345.
- Jiang S, Xie S, Lv D, et al. Alteration of the gut microbiota in Chinese population with chronic kidney disease. Sci Rep. 2017;7(1):2870. doi: 10.1038/s41598-017-02989-2.
- Cosola C, Rocchetti MT, Sabatino A, et al. Microbiota issue in CKD: how promising are gut-targeted approaches? J Nephrol. 2019;32(1):27–37. doi: 10.1007/s40620-018-0516-0.
- Kalantar-Zadeh K, Fouque D. Nutritional management of chronic kidney disease. N Engl J Med. 2018;378(6):584–585. doi: 10.1056/NEJMc1715765.
- Chen S, Wu F, Yang C, et al. Alternative to sugar, honey does not provoke insulin resistance in rats based on lipid profiles, inflammation, and IRS/PI3K/AKT signaling pathways modulation. J Agric Food Chem. 2022;70(33):10194–10208. doi: 10.1021/ACS.JAFC.2C03639.
- Chen S, Xu Y, Cheng N, et al. Mitigation of DSS-induced colitis potentially via Th1/Th2 cytokine and immunological function balance induced by phenolic-enriched buckwheat (Fagopyrum esculentum Moench) bee pollen extract. Foods. 2022;11(9):1293. doi: 10.3390/FOODS11091293.
- Zhang J, Cao W, Zhao H, et al. Protective mechanism of Fagopyrum esculentum Moench. Bee pollen EtOH extract against type II diabetes in a high-fat diet/streptozocin-induced C57BL/6J mice. Front Nutr. 2022;9:925351. doi: 10.3389/FNUT.2022.925351.
- Rapa SF, Di Iorio BR, Campiglia P, et al. Inflammation and oxidative stress in chronic kidney disease—potential therapeutic role of minerals, vitamins and plant-derived metabolites. Int J Mol Sci. 2019;21(1):263. doi: 10.3390/ijms21010263.
- Mafra D, Borges N, Alvarenga L, et al. Dietary components that may influence the disturbed gut microbiota in chronic kidney disease. Nutrients. 2019;11(3):496. doi: 10.3390/nu11030496.
- Bogdanov S, Jurendic T, Sieber R, et al. Honey for nutrition and health: a review. J Am Coll Nutr. 2008;27(6):677–689. doi: 10.1080/07315724.2008.10719745.
- Meo SA, Al-Asiri SA, Mahesar AL, et al. Role of honey in modern medicine. Saudi J Biol Sci. 2017;24(5):975–978. doi: 10.1016/j.sjbs.2016.12.010.
- Erejuwa OO, Aja DOJ, Uwaezuoke NI, et al. Effects of honey supplementation on renal dysfunction and metabolic acidosis in rats with high-fat diet-induced chronic kidney disease. J Basic Clin Physiol Pharmacol. 2021;32(1):20190151. doi: 10.1515/jbcpp-2019-0151.
- Cianciosi D, Forbes-Hernández TY, Afrin S, et al. Phenolic compounds in honey and their associated health benefits: a review. Molecules. 2018;23(9):2322. doi: 10.3390/molecules23092322.
- Gil MI, Ferreres F, Ortiz A, et al. Plant phenolic metabolites and floral origin of rosemary honey. J Agric Food Chem. 1995;43(11):2833–2838. doi: 10.1021/jf00059a012.
- Aronne G, Giovanetti M, Sacchi R, et al. From flower to honey bouquet: possible markers for the botanical origin of Robinia honey. The Scientific World Journal. 2014;2014:1–7. doi: 10.1155/2014/547275.
- Catalkaya G, Venema K, Lucini L, et al. Interaction of dietary polyphenols and gut microbiota: microbial metabolism of polyphenols, influence on the gut microbiota, and implications on host health. Food Frontiers. 2020;1(2):109–133. doi: 10.1002/fft2.25.
- Ozdal T, Sela DA, Ao J, et al. The reciprocal interactions between polyphenols and gut microbiota and effects on bioaccessibility. Nutrients. 2016;8(2):78. doi: 10.3390/nu8020078.
- Maalej A, Mahmoudi A, Bouallagui Z, et al. Olive phenolic compounds attenuate deltamethrin-induced liver and kidney toxicity through regulating oxidative stress, inflammation and apoptosis. Food Chem Toxicol. 2017;106(Pt A):455–465. doi: 10.1016/j.fct.2017.06.010.
- Tzounis X, Rodriguez-Mateos A, Vulevic J, et al. Prebiotic evaluation of cocoa-derived flavanols in healthy humans by using a randomized, controlled, double-blind, crossover intervention study. Am J Clin Nutr. 2011;93(1):62–72. doi: 10.3945/ajcn.110.000075.
- Massot-Cladera M, Pérez-Berezo T, Franch A, et al. Cocoa modulatory effect on rat faecal microbiota and colonic crosstalk. Arch Biochem Biophys. 2012;527(2):105–112. doi: 10.1016/j.abb.2012.05.015.
- Bialonska D, Ramnani P, Kasimsetty SG, et al. The influence of pomegranate by-product and punicalagins on selected groups of human intestinal microbiota. Int J Food Microbiol. 2010;140(2–3):175–182. doi: 10.1016/j.ijfoodmicro.2010.03.038.
- Shackelford C, Long G, Wolf J, et al. Qualitative and quantitative analysis of nonneoplastic lesions in toxicology studies. Toxicol Pathol. 2002;30(1):93–96. doi: 10.1080/01926230252824761.
- Zhao H, Cheng N, Zhou W, et al. Honey polyphenols ameliorate DSS‐ulcerative colitis via modulating gut microbiota in rats. Mol Nutr Food Res. 2019;63(23):e1900638. doi: 10.1002/mnfr.201900638.
- Miller DN, Bryant JE, Madsen EL, et al. Evaluation and optimization of DNA extraction and purification procedures for soil and sediment samples. Appl Environ Microbiol. 1999;65(11):4715–4724. doi: 10.1128/AEM.65.11.4715-4724.1999.
- Tucker PS, Scanlan AT, Dalbo VJ. Chronic kidney disease influences multiple systems: describing the relationship between oxidative stress, inflammation, kidney damage, and concomitant disease. Oxid Med Cell Longev. 2015;2015:806358–806358. doi: 10.1155/2015/806358.
- Kurts C, Panzer U, Anders HJ, et al. The immune system and kidney disease: basic concepts and clinical implications. Nat Rev Immunol. 2013;13(10):738–753. doi: 10.1038/nri3523.
- Chang CL, Marra G, Chauhan DP, et al. Oxidative stress inactivates the human DNA mismatch repair system. Am J Physiol Cell Physiol. 2002;283(1):C148–C154. doi: 10.1152/ajpcell.00422.2001.
- Djudjaj S, Boor P. Cellular and molecular mechanisms of kidney fibrosis. Mol Aspects Med. 2019;65:16–36. doi: 10.1016/j.mam.2018.06.002.
- Zoccali C, Vanholder R, Massy ZA, European Renal and Cardiovascular Medicine (EURECA-m) Working Group of the European Renal Association–European Dialysis Transplantation Association (ERA-EDTA), et al. The systemic nature of CKD. Nat Rev Nephrol. 2017;13(6):344–358. doi: 10.1038/nrneph.2017.52.
- Zhao H, Cheng N, He L, et al. Antioxidant and hepatoprotective effects of A. cerana honey against acute alcohol-induced liver damage in mice. Food Res Int. 2017;101:35–44. doi: 10.1016/j.foodres.2017.08.014.
- Zhao H, Cheng N, Wang Q, et al. Effects of honey-extracted polyphenols on serum antioxidant capacity and metabolic phenotype in rats. Food Funct. 2019;10(5):2347–2358. doi: 10.1039/c8fo02138d.
- Abrass CK. Cellular lipid metabolism and the role of lipids in progressive renal disease. Am J Nephrol. 2004;24(1):46–53. doi: 10.1159/000075925.
- Moorhead JF, El-Nahas M, Chan MK, et al. Lipid nephrotoxicity in chronic progressive glomerular and tubulo-interstitial disease. Lancet. 1982;2(8311):1309–1311. doi: 10.1016/s0140-6736(82)91513-6.
- Panov A, Mayorov VI, Dikalov S. Metabolic syndrome and β-oxidation of long-chain fatty acids in the brain, heart, and kidney mitochondria. Int J Mol Sci. 2022;23(7):4047. doi: 10.3390/ijms23074047.
- Juszczak F, Caron N, Mathew AV, et al. Critical role for AMPK in metabolic disease-induced chronic kidney disease. Int J Mol Sci. 2020;21(21):7994. doi: 10.3390/ijms21217994.
- Declèves A-E, Mathew AV, Cunard R, et al. AMPK mediates the initiation of kidney disease induced by a high-fat diet. J Am Soc Nephrol. 2011;22(10):1846–1855. doi: 10.1681/ASN.2011010026.
- Juszczak F, Vlassembrouck M, Botton O, et al. Delayed exercise training improves obesity-induced chronic kidney disease by activating AMPK pathway in high-fat diet-fed mice. Int J Mol Sci. 2020;22(1):350. doi: 10.3390/ijms22010350.
- Ahmed S, Sulaiman SA, Baig AA, et al. Honey as a potential natural antioxidant medicine: an insight into its molecular mechanisms of action. Oxid Med Cell Longev. 2018;2018:8367846–8367819. doi: 10.1155/2018/8367846.
- Susla O, Shin HS, Jung YS, et al. Nutrition, inflammation and oxidative stress – CKD 1-5. Nephrol Dial Transplant. 2012;27(suppl 2):ii405–ii413. doi: 10.1093/ndt/gfs238.
- Colgan SM, Hashimi AA, Austin RC. Endoplasmic reticulum stress and lipid dysregulation. Expert Rev Mol Med. 2011;13:e4. doi: 10.1017/S1462399410001742.
- Arany I, Hall S, Reed DK, et al. Nicotine enhances high-fat diet-induced oxidative stress in the kidney. Nicotine Tob Res. 2016;18(7):1628–1634. doi: 10.1093/ntr/ntw029.
- Qiu M, Li S, Jin L, et al. Combination of chymostatin and aliskiren attenuates ER stress induced by lipid overload in kidney tubular cells. Lipids Health Dis. 2018;17(1):183. doi: 10.1186/s12944-018-0818-1.
- Pasupuleti VR, Arigela CS, Gan SH, et al. A review on oxidative stress, diabetic complications, and the roles of honey polyphenols. Oxid Med Cell Longev. 2020;2020:8878172–8878116. doi: 10.1155/2020/8878172.
- Le Chatelier E, Nielsen T, Qin J, MetaHIT Consortium, et al. Richness of human gut microbiome correlates with metabolic markers. Nature. 2013;500(7464):541–546. doi: 10.1038/nature12506.
- Dalby MJ, Aviello G, Ross AW, et al. Diet induced obesity is independent of metabolic endotoxemia and TLR4 signalling, but markedly increases hypothalamic expression of the acute phase protein, SerpinA3N. Sci Rep. 2018;8(1):15648. doi: 10.1038/s41598-018-33928-4.
- Ley RE, Turnbaugh PJ, Klein S, et al. Human gut microbes associated with obesity. Nature. 2006;444(7122):1022–1023. doi: 10.1038/4441022a.
- Yan H, Fei N, Wu G, et al. Regulated inflammation and lipid metabolism in colon mRNA expressions of obese germfree mice responding to Enterobacter cloacae B29 combined with the high fat diet. Front Microbiol. 2016;7:1786. doi: 10.3389/fmicb.2016.01786.
- Duda-Chodak A, Tarko T, Satora P, et al. Interaction of dietary compounds, especially polyphenols, with the intestinal microbiota: a review. Eur J Nutr. 2015;54(3):325–341. doi: 10.1007/s00394-015-0852-y.
- Foley KP, Zlitni S, Denou E, et al. Long term but not short term exposure to obesity related microbiota promotes host insulin resistance. Nat Commun. 2018;9(1):4681. doi: 10.1038/s41467-018-07146-5.
- Ding T, Wang S, Zhang X, et al. Kidney protection effects of dihydroquercetin on diabetic nephropathy through suppressing ROS and NLRP3 inflammasome. Phytomedicine. 2018;41:45–53. doi: 10.1016/j.phymed.2018.01.026.
- Firrman J, Liu L, Zhang L, et al. The effect of quercetin on genetic expression of the commensal gut microbes Bifidobacterium catenulatum, Enterococcus caccae and Ruminococcus gauvreauii. Anaerobe. 2016;42:130–141. doi: 10.1016/j.anaerobe.2016.10.004.
- Li Q, Van de Wiele T. Gut microbiota as a driver of the interindividual variability of cardiometabolic effects from tea polyphenols. Crit Rev Food Sci Nutr. 2023;63(11):1500–1526. doi: 10.1080/10408398.2021.1965536.
- Tzounis X, Vulevic J, Kuhnle GG, et al. Flavanol monomer-induced changes to the human faecal microflora. Br J Nutr. 2008;99(4):782–792. doi: 10.1017/S0007114507853384.
- Li L, Ma L, Fu P. Gut microbiota–derived short-chain fatty acids and kidney diseases. Drug Des Devel Ther. 2017;11:3531–3542. doi: 10.2147/DDDT.S150825.
- Mythri RB, Bharath MS. Omics and epigenetics of polyphenol-mediated neuroprotection: the curcumin perspective. In: Farooqui T, Farooqui AA, editors. Curcumin for neurological and psychiatric disorders. Academic Press; 2019. p. 169–189. doi: 10.1016/B978-0-12-815461-8.00009-8.
- Zhou M, Wang S, Zhao A, et al. Transcriptomic and metabonomic profiling reveal synergistic effects of quercetin and resveratrol supplementation in high fat diet fed mice. J Proteome Res. 2012;11(10):4961–4971. doi: 10.1021/pr3004826.
- van der Beek CM, Dejong CH, Troost FJ, et al. Role of short-chain fatty acids in colonic inflammation, carcinogenesis, and mucosal protection and healing. Nutr Rev. 2017;75(4):286–305. doi: 10.1093/nutrit/nuw067.