
Abstract
Background
Cellular senescence, macrophages infiltration, and vascular smooth muscle cells (VSMCs) osteogenic transdifferentiation participate in the pathophysiology of vascular calcification in chronic kidney disease (CKD). Senescent macrophages are involved in the regulation of inflammation in pathological diseases. In addition, senescent cells spread senescence to neighboring cells via Interferon-induced transmembrane protein3 (IFITM3). However, the role of senescent macrophages and IFITM3 in VSMCs calcification remains unexplored.
Aims
To explore the hypothesis that senescent macrophages contribute to the calcification and senescence of VSMCs via IFITM3.
Methods
Here, the macrophage senescence model was established using Lipopolysaccharides (LPS). The VSMCs were subjected to supernatants from macrophages (MCFS) or LPS-induced macrophages (LPS-MCFS) in the presence or absence of calcifying media (CM). Senescence-associated β-galactosidase (SA-β-gal), Alizarin red (AR), immunofluorescent staining, and western blot were used to identify cell senescence and calcification.
Results
The expression of IFITM3 was significantly increased in LPS-induced macrophages and the supernatants. The VSMCs transdifferentiated into osteogenic phenotype, expressing higher osteogenic differentiation markers (RUNX2) and lower VSMCs constructive makers (SM22α) when cultured with senescent macrophages supernatants. Also, senescence markers (p16 and p21) in VSMCs were significantly increased by senescent macrophages supernatants treated. However, IFITM3 knockdown inhibited this process.
Conclusions
Our study showed that LPS-induced senescence of macrophages accelerated the calcification of VSMCs via IFITM3. These data provide a new perspective linking VC and aging, which may provide clues for diagnosing and treating accelerated vascular aging in patients with CKD.
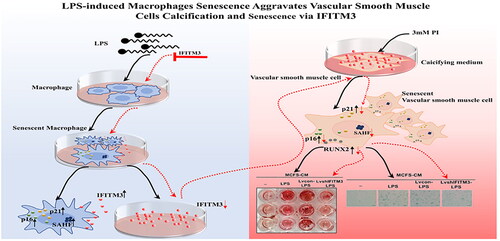
Graphical Abstract
1. Introduction
Cardiovascular disease (CVD) often has been recognized as a significant contributor to morbidity and mortality in patients with chronic kidney disease (CKD) [Citation1]. Vascular calcification (VC) is a robust and independent risk predictor in CVD that progresses rapidly once dialysis is initiated [Citation2,Citation3]. Moreover, the incidence of VC is dramatically higher in patients who undergo dialysis than in age and sex-matched healthy subjects, even children and young adults [Citation4–7]. VC in patients with CKD exhibits pathological changes similar to the aged [Citation8]. Notably, the degree of VC can be used to measure the biological vascular age, suggesting that patients with CKD may present with accelerated vascular aging [Citation9].
The calcification of vascular smooth muscle cells (VSMCs) in the vessel medial layer is a hallmark of vascular aging [Citation10]. The osteogenic differentiation of VSMCs is an essential cytological basis for VC [Citation11]. Several studies have suggested that macrophages play a critical role in VC [Citation12,Citation13]. Indeed, macrophages can enhance VSMCs calcification [Citation12–14]. Macrophages are essential to innate immunity, as they maintain tissue homeostasis [Citation15] and have emerged as critical drivers of age-related inflammation. The central role of macrophaging was first described in the theory of inflammaging, which describes the slow activation of macrophages with age [Citation16]. Significantly, senescent macrophages has attracted extensive attention, which accumulated in the subendothelial space and drive the pathological progression of atherosclerosis [Citation17], induced pulmonary fibrosis [Citation18], and promoted cancer [Citation19]. However, the roles of molecules and their functions in VC development caused by senescent macrophages remain unclear.
Interferon-induced transmembrane protein3 (IFITM3) is an innate immune protein. Several studies have focused on its antiviral effects against the influenza, hepatitis C, and human immunodeficiency virus (HIV) [Citation20,Citation21]. Most recently, IFITM3 has attracted attention for its important roles in cancer development, immunity response, and age-related inflammation [Citation13,Citation22–24]. Inflammatory cytokines induce the expression of IFITM3 in neurons and astrocytes in Alzheimer’s disease—an age-related illness [Citation25]. Furthermore, Harmon et al. revealed that IFITM3 was upregulated in LPS-treated microglia, a type of macrophage widely distributed in the nervous system [Citation26]. Nevertheless, the role of IFITM3 in senescent macrophages-mediated VC is still unclear.
In this study, we hypothesized that senescent macrophages contribute to VSMCs calcification and confirmed the role of IFITM3 in this process.
2. Materials and methods
2.1. Cell culture
The mouse RAW264.7 cells were purchased from the American Type Culture Collection (ATCC), and mouse VSMCs were from CellCook (CC9011). Cells were cultured in DMEM medium (Gibco) supplemented with 10% fetal bovine serum (FBS, Gibco) and 1% penicillin–streptomycin (Invitrogen). For inducing macrophages senescence, RAW 264.7 cells were cultured in DMEM medium supplemented with 10% FBS and treated with 1 μg/mL lipopolysaccharides (LPS, L4391, Sigma) for 48h. Following this, the medium was replaced with DMEM containing 0.2% FBS, called growth medium (GM) here. The macrophages and cell-free supernatants levels of IFITM3 were measured at 0, 6, 12, 24, and 48 h during the culture period. The macrophages cell-free supernatants (MCFS) and were collected after centrifugation (Eppendorf) at 2000 rpm for 15 min to get rid LPS-induced macrophages cell-free supernatants (LPS-MCFS) of the cell debris, and used for follow-up experiments. For stimulating VSMCs calcification, the calcifying medium (CM) was used, containing inorganic phosphate (NaH2PO4-Na2HPO4 3 mmol/L, pH 7.4) in GM base. The culture chamber condition was kept at 37 °C in a 5% CO2 atmosphere. The intervention groups of VSMCs were divided as follows: MCFS + GM (MCFS-GM); LPS-MCFS + GM (LPS-MCFS-GM); MCFS + CM (MCFS-CM); and LPS-MCFS + CM (LPS-MCFS-CM).
2.2. Lentiviral transduction of IFITM3 in vitro
To specifically knock down IFITM3 expression, the sequences of lentivirus carrying short hairpin RNA against IFITM3 (LvshIFITM3) (5′-CAGAACTACTGTGATCAACAT-3′) and negative control (Lvcon) (5′-TTCTCCGAACGTGTCACGT-3′) were purchased from GeneChem, which was seeded in macrophages with a confluence of 40% approximately. After transduction, puromycin (ST551, Beyotime Biotechnology) was employed to select positive cells until infected macrophages accounted for 80–90%. The supernatants from macrophages were collected and used to treat VSMCs. The intervention groups of VSMCs were divided as follows: Lvcon-LPS-MCFS + CM (Lvcon-LPS-MCFS-CM); LvshIFITM3-LPS-MCFS + CM (LvshIFITM3-LPS-MCFS-CM).
To overexpress IFITM3, lentivirus-expressing mouse IFITM3 gene produced by Gene Chem was seeded in macrophages with a confluence of 40% approximately. After transduction, puromycin (ST551, Beyotime Biotechnology) was employed to select positive cells until infected macrophages accounted for 80–90%. The cell-free supernatants from macrophages were collected and used to treat VSMCs. The intervention groups of VSMCs were divided as follows: Lvcon(over)-LPS-MCFS + CM (Lvcon(over)-LPS-MCFS-CM); Lvsh(over)IFITM3-LPS-MCFS + CM (Lvsh(over)IFITM3-LPS-MCFS-CM).
2.3. Alizarin red (AR) staining and quantification
To assess calcification of VSMCs, the VSMCs were exposed to different conditions for seven days, with the medium being refreshed every two days. The cells were washed with PBS, fixed in 4% paraformaldehyde (G1101, Servicebio) for 20 min at room temperature (RT), and stained with Alizarin red S (G1038, Servicebio) for 20 min at RT. To quantify AR staining, 100ul hexadecyl pyridinium chloride (C9002, Sigma) solution (100 mmol/L) was added in the 96-well plates wells. The optical density (OD) was detected at 560 nm wavelength, making use of hexadecyl pyridinium chloride solution as a blank.
2.4. Senescence-associated β-galactosidase (SA-β-gal) staining activity
The SA-β-Gal activity was detected by a senescence-associated-β-Galactosidase (SA-β-Gal) Staining Kit (C0602, Beyotime Biotechnology), according to the manufacturer’s instructions. The random fields were imaged by a light microscope system (IX71, Olympus).
2.5. ELISA analysis
The IFITM3 level in cell-free supernatants was measured by the Elisa kit (Ruixin Bio Quanzhou) following the manufacturer’s instructions.
2.6. Immunofluorescent staining
Macrophages and VSMCs were blocked with 5% BSA for one hour, after 0.25% Triton X-100 for 5 min at RT. Immunofluorescent analysis was performed on cellular samples with diluted primary antibodies against IFITM3 (11714-1-AP, Proteintech), RUNX2 (12556S, Cell Signaling Technology), p16 (sc-16611, Santa Cruz Biotechnology), p21 (sc-817, Santa Cruz Biotechnology), subsequently, fluorescently labeled secondary antibodies were applied to the samples (Ab150116 594, Ab150077 488, Abcam) at 1:500 dilution ratio. Samples were scanned by a confocal laser scanning microscope (FV 3000, Olympus).
2.7. Flow cytometry analysis
After exposure with or without LPS, the macrophages were collected and stained by IFITM3 and washed three times with sterile PBS, followed by anti-rabbit IgG. Single cells were detected using a flow cytometer (Guava easyCyte HT, Luminex) and assessed by Flow Jo software.
2.8. Quantitative real-time PCR assay
The total RNA of cells was extracted by RNAiso Plus (Vazyme). 5× HiScript III qRT SuperMix was used to perform Reverse transcription (Vazyme). Quantitative real-time PCR was performed using 2 × ChamQ SYBR qPCR Master Mix (Vazyme) and a 7300 real-time PCR System (Applied Biosystems). The sequences of all the RT-PCR primers are listed in .
Table 1. Primers of quantitative RT-PCR.
2.9. Western blotting assay
Cells were lysed in RIPA lysis buffer (KeyGEN BioTECH), and the protein concentration was detected using BCA assay (KeyGEN BioTECH). The operation details followed the standard protocols as previously reported [Citation27]. Primary antibodies as follows: anti-iNOS (ab15323, Abcam,1:1000), anti-IFITM3 (11714-1-AP, Proteintech, 1:1000), anti-P16(sc-16611, Santa Cruz Biotechnology, 1:200), anti-P21 (sc-817, Santa Cruz Biotechnology,1:200), anti-RUNX2 (12556S, Cell Signaling Technology, 1:1000), anti-SM22α (ab14106, Abcam,1:1000), secondary HRP-conjugated antibodies (goat anti-mouse IgG, goat anti-rabbit IgG, Absin, 1:5000) were applied for detection through hypersensitive ECL detection kit (BL520A, Biosharp). GAPDH as an endogenous reference gene (Ab2000, Abways, ZF2000, ZFdows Bio, 1:10000). The relative expressions were analyzed by Image J software.
2.10. Statistical analysis
Data were displayed as the mean ± standard deviation (SD). A two-tailed unpaired Student’s t-test was used to compare the differences between the two groups. In comparison, a one-way ANOVA was used to compare among three or more groups, followed by Bonferroni correction for multiple comparisons. Statistical data were analyzed by GraphPad Prism 8.0. p < 0.05 was considered statistically significant.
3. Results
3.1. Induction of macrophages senescence by LPS
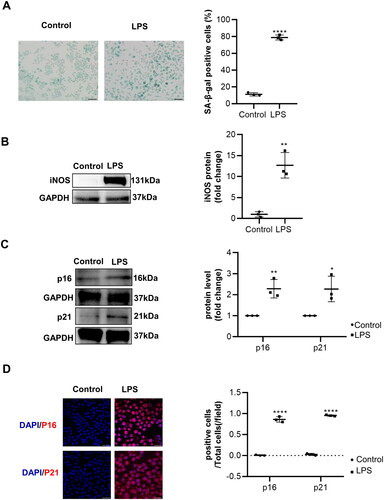
To establish the model of inflammation-associated macrophages senescence, the murine macrophages cell line RAW264.7 was treated with LPS. An increase in β-galactosidase activity was detected in senescent macrophages. The rate of SA-β-Gal positive cells was approximately 78.8% of senescent macrophages versus 11.2% of control cells (Figure1(A)). Correspondingly, inflammatory factor iNOS and senescence makers p16 and p21 were increased in LPS-induced macrophages, which were detected ()). The macrophages senescence was evidenced by immunofluorescence detection of p16 and p21 (). Collectively, these results indicated that LPS could induce macrophages senescence.
Figure 1. The senescence of macrophages induced by lipopolysaccharide (LPS) cultures of RAW 264.7 macrophages and usage of lipopolysaccharide (LPS, 1 μg/mL) were performed to induce macrophages senescence. (A) The senescence detection of LPS-induced macrophages was achieved by utilizing SA-β-gal staining as well as performing a quantitative analysis of the number of positive cells. n = 3. Scale bar, 50 μm. (B–C) Representative images of WB and statistical data showing the protein levels of iNOS and senescence markers p16 and p21, with or without LPS. n = 3. (D) Representative immunofluorescence staining images of p16, p21, and nuclei in macrophages treated with or without LPS. Scale bar, 20 μm. Data are presented as mean ± SD, two-tailed t-test (A, B, and C), * p < 0.05, ** p < 0.01, *** p < 0.001.
3.2. Enhanced release of IFITM3 by LPS-induced macrophages
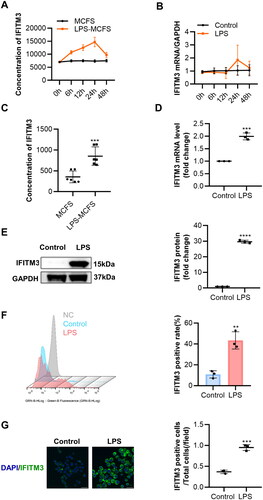
Borghesan et al. showed that IFITM3 was derived from senescent cells [Citation24]. We next examined the expression of IFITM3 in senescent macrophages. The IFITM3 levels in macrophages cell-free supernatants and mRNA were measured at different time points, with or without LPS ()). Surprisingly, IFITM3 expression was excellently increased in the LPS group, both in the cell-free supernatants and mRNA levels ()) at a 24-h time point during the culture period with CM. Moreover, the expression of IFITM3 at the protein level was further verified (). Flow cytometry showed a higher rate of IFITM3-positive cells in the group treated with LPS compared to the control group. (). The fluorescence levels of IFITM3 were consistent with the above results ().
Figure 2. Increased IFITM3 release from LPS-induced macrophages (A–B) total concentration in supernatants and mRNA expression of IFITM3 were examined respectively at different time points after intervention with or without LPS. n = 3. (C) The total concentrations of IFITM3 in MCFS and LPS-MCFS were measured at 24 h after intervention with or without LPS. ELISA n = 6. (D–E) mRNA and protein levels of IFITM3 were detected in macrophages, with or without LPS. n = 3. (F) Flow cytometry was used to analyze the rate of IFITM3-positive cells in macrophages with or without LPS. n = 3. (G) Representative immunofluorescence staining images of IFIMT3 in macrophages, with or without LPS. Scale bar, 20 μm. Data are presented as mean ± SD, two-tailed t-test (C, D, E, F, and G), **p < 0.01; ***p < 0.001; ****p < 0.0001.
3.3. Promotion of VSMCs calcification and osteogenic differentiation by LPS-induced macrophages
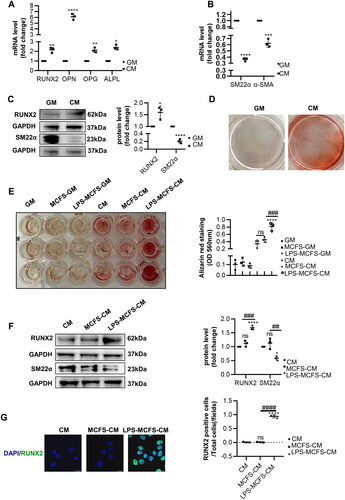
Previous studies have shown that macrophages can enhance VSMCs calcification in vitro [Citation12,Citation14,Citation28]. Firstly, we measured the mRNA levels of osteogenic differentiation markers (RUNX2, OPN, OPG, and ALPL) and constructive makers (SM22α and α-SMA) in VSMCs incubated with CM. Moreover, the increase of RUNX2, OPN, OPG, and ALPL mRNA levels was detected, while SM22α and α-SMA were decreased (). In addition, Western blot analysis partially further confirmed the increased RUNX2 and decreased SM22α of VSMCs in CM. (). Furthermore, AR staining confirmed that CM promoted calcification significantly (). Secondly, we investigated the effect of LPS-induced macrophages on VSMCs calcification and osteogenic differentiation. AR staining revealed that LPS-induced macrophages did not affect VSMCs calcification under the condition of GM, while its pro-calcification was investigated in the presence of CM. And the mineralized nodules were significantly higher in the group of LPS-MCFS-CM than in MCFS and CM (). Then, we evaluated whether LPS-MCFS-CM accelerates VSMCs calcification and osteogenic differentiation. The results showed that the group of LPS-MCFS-CM exhibited upregulated expression of RUNX2, and yet the downregulated expression of SM22α, compared with the MCFS-CM and the CM (). RUNX2 is a vital transcription factor for the osteogenic differentiation of VSMCs, the results show that LPS-MCFS-CM induces a higher representation of RUNX2 for VSMCs than MCFS-CM and CM ().
Figure 3. LPS-induced macrophages promote VSMCs calcification and osteogenic differentiation. (A–B) QPCR analysis of RUNX2, OPN, OPG, ALPL, α-SMA, and SM22α in VSMCs with calcifying medium (CM) versus growth medium (GM). n = 3. (C) Representative Western blot images of RUNX2 and SM22α in VSMCs with CM compared to GM are shown. n = 3. (D) Alizarin red staining was used to evaluate the calcification of VSMCs after 7 days of CM or GM intervention. (E) AR staining and quantification revealed the role of macrophages in VSMC calcification under both GM and CM conditions. n = 3. (F) Western blot analysis was performed to investigate the expression of RUNX2 and SM22α in VSMCs treated with CM, MCFS-CM, and LPS-MCFS-CM. n = 3. (G) Immunofluorescence staining was utilized to detect the presence of RUNX2 in VSMCs. Scale bar, 20 μm. Data are presented as mean ± SD, two-tailed t-test (A, B, and C), *p < 0.05, **p < 0.01, ***p < 0.001, ****p < 0.0001 versus GM. One-way ANOVA (E, F and G), *p < 0.05, ****p< 0.0001 versus CM, ##p < 0.01, ###p < 0.001, ####p< 0.0001 versus MCFS-CM.
3.4. Promotion of VSMCs senescence by LPS-induced macrophages
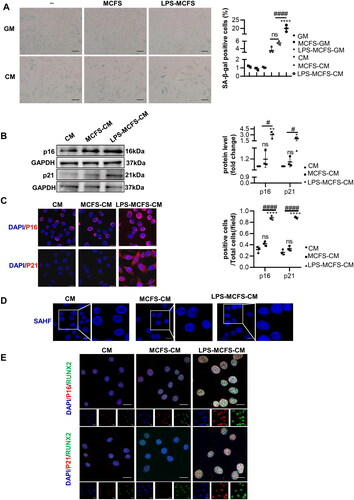
Given that IFITM3 can transmit senescence to nearby cells [Citation24]. To mainly test the role of IFITM3 in cellular senescence, SA-β-gal staining was used to assess VSMCs senescence. Senescent macrophages accelerated VSMCs senescence only in the case of CM. Especially, the extent of VSMCs senescence was remarkably higher in the group of LPS-MCFS-CM than in the MCFS and CM (). As well, the protein levels of p16 and p21 of VSMCs were also dramatically increased in the group of LPS-MCFS-CM (). The immunofluorescence staining delivered the same results (). As we all know, SAHFs are a universal hallmark of senescent cells [Citation29]. Following LPS-MCFS-CM induction, we found that the VSMCs progressed into senescence and formed senescence-associated heterochromatin foci (SAHF), in contrast, a bit bright DAPI foci appear in MCFS and CM (). In addition, by immunofluorescence staining, co-localization of p16 and p21 with RUNX2 in VSMCs was also found after intervention with LPS-MCFS-CM (). Thus, our data showed that LPS-induced macrophages cause VSMCs senescence.
Figure 4. LPS-induced macrophages promote VSMCs senescence. (A) The senescence of VSMCs was assessed by SA-β-gal staining and quantification under GM and CM conditions. n = 3. Scale bar, 50 μm. (B) Representative Western blot images of senescent protein p16 and p21 in VSMCs treated with CM, MCFS-CM, and LPS-MCFS-CM. n = 3. (C) Immunofluorescence staining was performed to investigate the expression of p16 and p21 in VSMCs treated with CM, MCFS-CM, and LPS-MCFS-CM. Scale bar, 20 μm. (D) Senescence-associated heterochromatin foci (SAHF) were detected in VSMCs treated with CM, MCFS-CM, and LPS-MCFS-CM, indicating the presence of heterochromatin aggregation in the cell nucleus. Scale bar 20 μm. (E) Immunofluorescence double staining of RUNX2 with p16 and p21 respectively. Scale bar, 20 μm. Data are presented as mean ± SD, one-way ANOVA (A, B and C), *p < 0.05, **p < 0.01, ****p < 0.0001 versus CM, # p < 0.05, #### p < 0.0001 versus MCFS-CM.
3.5. Critical role of IFITM3 from LPS-induced macrophages in VSMCs calcification and senescence
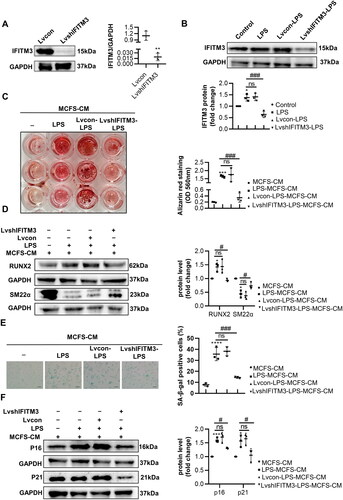
To further investigate whether IFITM3 plays a causal role in mediating the calcification and senescence of VSMCs. We utilized lentivirus carrying shIFITM3 to knock down IFITM3 expression in macrophages (). Moreover, the LPS-induced LvshIFITM3-macrophages displayed downregulation of IFITM3, compared with LPS-induced macrophages (). Mineralized nodules were considerably decreased in the LVshIFITM3-LPS-MCFS-CM group of VSMCs, in comparison to the LPS-MCFS-CM group (). Additionally, the results showed that the knockdown of IFITM3 remarkably attenuated VSMCs calcification, confirmed by a decrease in protein levels of RUN2 and an increase in SM22α (). Meanwhile, SA-β-gal staining showed that VSMCs senescence in LPS-MCFS-CM group was significantly alleviated in LVshIFITM3-LPS-MCFS-CM group () and verified by protein expression of p16 and p21 ().
Figure 5. Knockdown of IFITM3 ameliorated calcification and senescence of VSMCs. (A) The knockdown of IFITM3 was confirmed by Western blot analysis. n = 3. (B) Western blot analysis was performed to assess the expression of IFITM3 in macrophages subjected to different interventions. n = 3. (C) AR staining and quantification were used to demonstrate that LvshIFITM3-LPS-MCFS-CM group attenuated VSMC calcification compared to LPS-MCFS-CM group. n = 3. (D) The expression of osteogenic markers (RUNX2, SM22α) in VSMCs was determined by Western blot analysis. n = 3. (E) Senescence in VSMCs was assessed by performing SA-β-gal staining and quantifying the percentage of positive cells. n = 3. Scale bar, 50 μm. (F) Western blot analysis was performed to assess the expression of senescent markers (p16 and p21) in VSMCs. n = 3. Data are presented as mean ± SD, two-tailed t-test (a), **p < 0.01 versus lvcon, one-way ANOVA (B, C, D, E, and F), *p < 0.05, ***p < 0.001, ****p < 0.0001 versus MCFS-CM, #p < 0.05, ###p < 0.001 versus LPS-MCFS-CM.
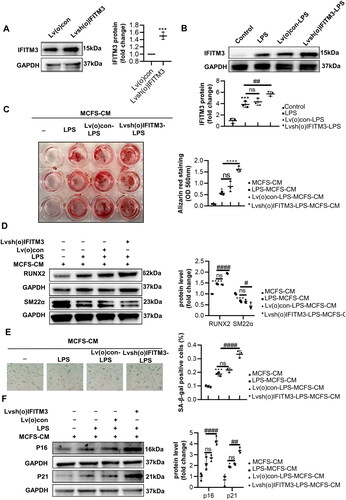
As expected, we found that IFITM3 overexpression aggravated the calcification and senescence of VSMCs. IFITM3 overexpressed in macrophages (called Lvsh(o)IFITM3-macrophages here) was shown in . The LPS-induced Lvsh(o)IFITM3-macrophages displayed upregulated IFITM3, compared with LPS-induced macrophages (). Besides, Lvsh(o)IFITM3-LPS-MCFS-CM group aggravated calcification were verified by an increase in mineralized nodules and in protein levels of RUN2 and a decrease in SM22α, compared to LPS-MCFS-CM group (). Meanwhile, Lvsh(o)IFITM3-LPS-MCFS-CM group promoted senescence proven by SA-β-gal staining and protein expression of p16 and p21 ().
Figure 6. Overexpression of IFITM3 aggravated calcification and senescence of VSMCs. (A) The overexpression of IFITM3 was confirmed by Western blot analysis. n = 3. (B) Western blot analysis was performed to assess the expression of IFITM3 in macrophages subjected to different interventions. n = 3. (C) AR staining and quantification were used to demonstrate that lvsh(o)IFITM3-LPS-MCFS-CM treatment aggravated VSMC calcification compared to LPS-MCFS-CM group. n = 3. (D) The expression of osteogenic markers (RUNX2, SM22α) in VSMCs was determined by Western blot analysis. n = 3. (E) Senescence in VSMCs was assessed by performing SA-β-gal staining and quantifying the percentage of positive cells. n = 3. Scale bar, 50 μm. (F) Western blot analysis was performed to assess the expression of senescent markers (p16 and p21) in VSMCs. n = 3. Data are presented as mean ± SD, two-tailed t-test (a), ***p < 0.001 versus Lv(o)con, one-way ANOVA (B, C, D, E, and F), *p < 0.05, ***p < 0.001, ****p < 0.0001 versus MCFS-CM, # p < 0.05, #### p < 0.0001 versus LPS-MCFS-CM.
4. Discussion
One of our key findings is the identification of IFITM3 released from LPS-induced senescent macrophages. Notably, this study showed that senescent macrophages accelerate VSMCs calcification via IFITM3, which is involved in VSMCs senescence in CKD. These data will pave the way for a deeper understanding of the association between VC and premature senescence in CKD.
Vascular calcification acts as a complex inflammatory pathology in CKD. Accumulating reports indicated that patients with CKD are exposed to numerous uremic toxins and significantly elevated phosphate, which drives cellular calcification [Citation30,Citation31]. Hyperphosphatemia also unbalanced the oxidant/antioxidant process, which leads to vascular senescence and potentiates vascular inflammation [Citation32]. Our study identified that treatment with macrophage supernatants alone did not stimulate calcification of VSMCs, but the CM did, and senescence occurred.
It has been demonstrated that aging of the immune system has a causal role in systemic aging [Citation33], and immunosenescence is characterized by an increase in intrinsic immune cells, such as macrophages [Citation34]. In human-aged skin, proinflammation M1-like phenotype impressed by the aged microenvironment [Citation35]. Wang et al. reported that LPS promotes the macrophages’ senescence with upregulated protein expression SASP in atherosclerosis [Citation36]. We are curious whether and how the pro-inflammatory senescent macrophages influence calcification under the chronic pro-inflammatory state caused by CKD. Therefore, we developed an LPS-induced senescent macrophage model for simulating the effects of a proinflammatory environment on macrophages closely associated with various diseases of aging [Citation35,Citation37]. Macrophages showed an aging phenotype as expected, and the cell-free supernatants promoted the progress of VSMCs calcification.
Studies have found that senescent cells have transmitted senescence to nearby cells through IFITM3, but the mechanisms are poorly understood. As we all know, there is a piece of solid evidence linking the senescence of VMSCs with VC [Citation38–40]. Interestingly, IFITM3 belongs to Interferon-induced transmembrane proteins (IFITMs), which were induced by interferon signaling. IFN-1 triggered the VSMCs phenotypic switching and premature senescence [Citation41]. Here, we identified that IFITM3 was increased in the senescent macrophages. Moreover, VSMCs cultured with cell-free supernatants from senescent macrophages exhibited features of senescence, and IFITM3 overexpression accelerated this process. By contrast, the knockdown of the IFITM3 generates the opposite results. We speculated that the release of IFITM3 is critical to the pro-calcific mechanisms of senescent macrophages. Moreover, the presumed mechanism by which IFITM3 promotes vascular calcification is by affecting VSMCs senescence.
Vascular calcification is a complicated disorder process. This study still has some limitations when applying the results to guide clinical decision-making. First, our study lacks experimental data from calcific animal models in vivo. Second, macrophages used RAW264.7 cell lines, which does not represent the results of primary macrophages. Although LPS-induced primary microglia highly express IFITM3, and the effect on primary macrophages on LPS needs further observation. Third, there may be a parallel relationship between the VSMCs calcification and senescence, and the detailed mechanisms will be further explored in our subsequent work.
In conclusion, the results demonstrated the role of senescent macrophages in accelerating the calcification and senescence of VSMCs via IFITM3. These data provide a new perspective linking VC and aging. This study may provide clues for diagnosing and treating accelerated vascular aging in patients with CKD.
Author contributions
Yu Zhao and Ya-Ping Fang conceived and designed the research; Yu Zhao and Xiao-Liang Zhang supervised the project; Ya-Ping Fang performed all the experiments and data analysis with the help of Xin Yang, Ying Zhang, Xiao-Dong Zhu, Xiao-Xu Wang, Yan Liu, Wen Shi, and Jia-Yi Huang; Ya-Ping Fang wrote the article; Ya-Ping Fang and Xiaoliang Zhang revised the paper; All authors approved the final version of the manuscript.
Disclosure statement
No potential conflict of interest was reported by the author(s).
Data availability statement
The data are available from the corresponding author on reasonable request.
Additional information
Funding
References
- Mok Y, Ballew SH, Matsushita K. Chronic kidney disease measures for cardiovascular risk prediction. Atherosclerosis. 2021;335:1–14. doi: 10.1016/j.atherosclerosis.2021.09.007.
- Schlieper G, Krüger T, Djuric Z, et al. Vascular access calcification predicts mortality in hemodialysis patients. Kidney Int. 2008;74(12):1582–1587. doi: 10.1038/ki.2008.458.
- Raggi P, Bellasi A, Bushinsky D, et al. Slowing progression of cardiovascular calcification with snf472 in patients on hemodialysis: results of a randomized phase 2b study. Circulation. 2020;141(9):728–739. doi: 10.1161/circulationaha.119.044195.
- Sanchis P, Ho CY, Liu Y, et al. Arterial "inflammaging" drives vascular calcification in children on dialysis. Kidney Int. 2019;95(4):958–972. doi: 10.1016/j.kint.2018.12.014.
- Shroff R, Long DA, Shanahan C. Mechanistic insights into vascular calcification in CKD. J Am Soc Nephrol. 2013;24(2):179–189. doi: 10.1681/ASN.2011121191.
- Braun J, Oldendorf M, Moshage W, et al. Electron beam computed tomography in the evaluation of cardiac calcification in chronic dialysis patients. Am J Kidney Dis. 1996;27(3):394–401. doi: 10.1016/s0272-6386(96)90363-7.
- Goodman WG, Goldin J, Kuizon BD, et al. Coronary-artery calcification in young adults with end-stage renal disease who are undergoing dialysis. N Engl J Med. 2000;342(20):1478–1483. doi: 10.1056/nejm200005183422003.
- Virchow R. Cellular pathology. As based upon physiological and pathological histology. Lecture xvi–atheromatous affection of arteries. 1858. Nutr Rev. 1989;47(1):23–25. doi: 10.1111/j.1753-4887.1989.tb02747.x.
- Shaw LJ, Raggi P, Berman DS, et al. Coronary artery calcium as a measure of biologic age. Atherosclerosis. 2006;188(1):112–119. doi: 10.1016/j.atherosclerosis.2005.10.010.
- Shanahan CM. Mechanisms of vascular calcification in CKD-evidence for premature ageing? Nat Rev Nephrol. 2013;9(11):661–670. doi: 10.1038/nrneph.2013.176.
- Huang J, Huang H, Wu M, et al. Connective tissue growth factor induces osteogenic differentiation of vascular smooth muscle cells through ERK signaling. Int J Mol Med. 2013;32(2):423–429. doi: 10.3892/ijmm.2013.1398.
- Tintut Y, Patel J, Territo M, et al. Monocyte/macrophage regulation of vascular calcification in vitro. Circulation. 2002;105(5):650–655. doi: 10.1161/hc0502.102969.
- Lu J, Xie S, Deng Y, et al. Blocking the nlrp3 inflammasome reduces osteogenic calcification and m1 macrophage polarization in a mouse model of calcified aortic valve stenosis. Atherosclerosis. 2022;347:28–38. doi: 10.1016/j.atherosclerosis.2022.03.005.
- Li X, Speer MY, Yang H, et al. Vitamin d receptor activators induce an anticalcific paracrine program in macrophages: requirement of osteopontin. Arterioscler Thromb Vasc Biol. 2010;30(2):321–326. doi: 10.1161/ATVBAHA.109.196576.
- Murray PJ, Wynn TA. Protective and pathogenic functions of macrophage subsets. Nat Rev Immunol. 2011;11(11):723–737. doi: 10.1038/nri3073.
- Franceschi C, Bonafè M, Valensin S, et al. Inflamm-aging. An evolutionary perspective on immunosenescence. Ann N Y Acad Sci. 2000;908:244–254. doi: 10.1111/j.1749-6632.2000.tb06651.x.
- Childs BG, Baker DJ, Wijshake T, et al. Senescent intimal foam cells are deleterious at all stages of atherosclerosis. Science. 2016;354(6311):472–477. doi: 10.1126/science.aaf6659.
- Su L, Dong Y, Wang Y, et al. Potential role of senescent macrophages in radiation-induced pulmonary fibrosis. Cell Death Dis. 2021;12(6):527. doi: 10.1038/s41419-021-03811-8.
- Haston S, Gonzalez-Gualda E, Morsli S, et al. Clearance of senescent macrophages ameliorates tumorigenesis in KRAS-driven lung cancer. Cancer Cell. 2023;41(7):1242–1260.e6. doi: 10.1016/j.ccell.2023.05.004.
- Bailey CC, Zhong G, Huang IC, et al. Ifitm-family proteins: the cell’s first line of antiviral defense. Annu Rev Virol. 2014;1:261–283. doi: 10.1146/annurev-virology-031413-085537.
- Lei N, Li Y, Sun Q, et al. Ifitm3 affects the level of antibody response after influenza vaccination. Emerg Microbes Infect. 2020;9(1):976–987. doi: 10.1080/22221751.2020.1756696.
- Gómez-Herranz M, Taylor J, Sloan RD. Ifitm proteins: understanding their diverse roles in viral infection, cancer, and immunity. J Biol Chem. 2023;299(1):102741. doi: 10.1016/j.jbc.2022.102741.
- Gan CP, Sam KK, Yee PS, et al. Ifitm3 knockdown reduces the expression of ccnd1 and cdk4 and suppresses the growth of oral squamous cell carcinoma cells. Cell Oncol. 2019;42(4):477–490. doi: 10.1007/s13402-019-00437-z.
- Borghesan M, Fafián-Labora J, Eleftheriadou O, et al. Small extracellular vesicles are key regulators of non-cell autonomous intercellular communication in senescence via the interferon protein ifitm3. Cell Rep. 2019;27(13):3956–3971 e6. doi: 10.1016/j.celrep.2019.05.095.
- Hur J-Y, Frost GR, Wu X, et al. The innate immunity protein ifitm3 modulates γ-secretase in Alzheimer’s disease. Nature. 2020;586(7831):735–740. doi: 10.1038/s41586-020-2681-2.
- Harmon E, Doan A, Bautista-Garrido J, et al. Increased expression of interferon-induced transmembrane 3 (ifitm3) in stroke and other inflammatory conditions in the brain. Int J Mol Sci. 2022;23(16):8885. doi: 10.3390/ijms23168885.
- Tang T-T, Wang B, Wu M, et al. Extracellular vesicle-encapsulated IL-10 as novel nanotherapeutics against ischemic AKI. Sci Adv. 2020;6(33):eaaz0748. doi: 10.1126/sciadv.aaz0748.
- Deuell KA, Callegari A, Giachelli CM, et al. Rankl enhances macrophage paracrine pro-calcific activity in high phosphate-treated smooth muscle cells: dependence on IL-6 and tnf-alpha. J Vasc Res. 2012;49(6):510–521. doi: 10.1159/000341216.
- Sati S, Bonev B, Szabo Q, et al. 4d genome rewiring during oncogene-induced and replicative senescence. Mol Cell. 2020;78(3):522–538 e9. doi: 10.1016/j.molcel.2020.03.007.
- Tölle M, Henkel C, Herrmann J, et al. Uremic mouse model to study vascular calcification and inflammaging. J Mol Med. 2022;100(9):1321–1330. doi: 10.1007/s00109-022-02234-y.
- Ohyama Y, Kurabayashi M, Masuda H, et al. Molecular cloning of rat klotho CDNA: markedly decreased expression of klotho by acute inflammatory stress. Biochem Biophys Res Commun. 1998;251(3):920–925. doi: 10.1006/bbrc.1998.9576.
- Asenjo-Bueno A, Alcalde-Estévez E, El Assar M, et al. Hyperphosphatemia-induced oxidant/antioxidant imbalance impairs vascular relaxation and induces inflammation and fibrosis in old mice. Antioxidants (Basel). 2021;10(8):1308. doi: 10.3390/antiox10081308.
- Yousefzadeh MJ, Flores RR, Zhu Y, et al. An aged immune system drives senescence and ageing of solid organs. Nature. 2021;594(7861):100–105. doi: 10.1038/s41586-021-03547-7.
- Kovtonyuk LV, Fritsch K, Feng X, et al. Inflamm-aging of hematopoiesis, hematopoietic stem cells, and the bone marrow microenvironment. Front Immunol. 2016;7:502. doi: 10.3389/fimmu.2016.00502.
- Gather L, Nath N, Falckenhayn C, et al. Macrophages are polarized toward an inflammatory phenotype by their aged microenvironment in the human skin. J Invest Dermatol. 2022;142(12):3136–3145 e11. doi: 10.1016/j.jid.2022.06.023.
- Wang H, Fu H, Zhu R, et al. Brd4 contributes to LPS-induced macrophage senescence and promotes progression of atherosclerosis-associated lipid uptake. Aging. 2020;12(10):9240–9259. doi: 10.18632/aging.103200.
- Kim KA, Jeong JJ, Yoo SY, et al. Gut microbiota lipopolysaccharide accelerates inflamm-aging in mice. BMC Microbiol. 2016;16(1):9. doi: 10.1186/s12866-016-0625-7.
- Zuccolo E, Badi I, Scavello F, et al. The microrna-34a-induced senescence-associated secretory phenotype (SASP) favors vascular smooth muscle cells calcification. Int J Mol Sci. 2020;21(12):4454. doi: 10.3390/ijms21124454.
- Badi I, Mancinelli L, Polizzotto A, et al. Mir-34a promotes vascular smooth muscle cell calcification by downregulating sirt1 (sirtuin 1) and axl (axl receptor tyrosine kinase). Arterioscler Thromb Vasc Biol. 2018;38(9):2079–2090. doi: 10.1161/ATVBAHA.118.311298.
- Nakano-Kurimoto R, Ikeda K, Uraoka M, et al. Replicative senescence of vascular smooth muscle cells enhances the calcification through initiating the osteoblastic transition. Am J Physiol Heart Circ Physiol. 2009;297(5):H1673–84. doi: 10.1152/ajpheart.00455.2009.
- Bi X, Du C, Wang X, et al. Mitochondrial damage-induced innate immune activation in vascular smooth muscle cells promotes chronic kidney disease-associated plaque vulnerability. Adv Sci. 2021;8(5):2002738. doi: 10.1002/advs.202002738.