
Abstract
Objective
To identify the risk factors of refractory peritoneal dialysis related peritonitis (PDRP) and construct a nomogram to predict the occurrence of refractory PDRP.
Methods
Refractory peritonitis was defined as the peritonitis episode with persistently cloudy bags or persistent dialysis effluent leukocyte count >100 × 109/L after 5 days of appropriate antibiotic therapy. The study dataset was randomly divided into a 70% training set and a 30% validation set. Univariate logistic analysis, LASSO regression analysis, and random forest algorithms were utilized to identify the potential risk factors for refractory peritonitis. Independent risk factors identified using multivariate logistic analysis were used to construct a nomogram. The discriminative ability, calibrating ability, and clinical practicality of the nomogram were evaluated using the receiver operating characteristic curve, Hosmer–Lemeshow test, calibration curve, and decision curve analysis.
Results
A total of 294 peritonitis episodes in 178 patients treated with peritoneal dialysis (PD) were enrolled, of which 93 were refractory peritonitis. C-reactive protein, serum albumin, diabetes mellitus, PD duration, and type of causative organisms were independent risk factors for refractory peritonitis. The nomogram model exhibited excellent discrimination with an area under the curve (AUC) of 0.781 (95% CI: 0.716–0.847) in the training set and 0.741 (95% CI: 0.627–0.855) in the validation set. The Hosmer–Lemeshow test and calibration curve indicated satisfactory calibration ability of the predictive model. Decision curve analysis revealed that the nomogram model had good clinical utility in predicting refractory peritonitis.
Conclusion
This nomogram can accurately predict refractory peritonitis in patients treated with PD.
Introduction
Peritoneal dialysis (PD) has advantages such as convenience, flexibility, cheap, simple operation, and preservation of residual kidney function, making it a significant renal replacement therapy for patients with kidney failure. However, peritoneal dialysis related peritonitis (PDRP) remains a huge challenge for the management of patients and has resulted in many patients discontinuing PD [Citation1]. Even if peritonitis is successfully cured, it may accelerate peritoneal injury [Citation2]. In recent years, with the wide application of antibiotics, the rate of antimicrobial resistance has gradually increased [Citation3], consequently raising the incidence of refractory peritonitis. Refractory peritonitis often indicates a poor prognosis. Even if the catheter was removed, persistent peritoneal inflammation and ascites formation may still occur, leading to prolonged hospitalization and even death [Citation4,Citation5]. An important task of the PD center is to reduce the incidence of peritonitis, especially refractory peritonitis, and improve the prognosis of peritonitis. This requires us to identify the risk factors for refractory peritonitis and take timely and effective intervention measures.
Although previous studies have explored the risk factors of peritonitis, there exists variability in the findings among different studies [Citation6,Citation7]. In addition, there were few studies on the potential risk factors of refractory peritonitis, and there were no studies to establish a visual prediction model after identifying the risk factors, which makes clinicians lack an intuitive and practical tool for individualized prediction of the occurrence of refractory peritonitis. With the advancement of medical technology, personalized medicine, which means tailoring treatment plans for individual patients, is receiving increasing attention [Citation8]. Therefore, this study aims to identify the potential risk factors of refractory peritonitis and construct a nomogram to personalize clinical decision-making, improve patient care, and enhance the quality of peritonitis treatment.
Materials and methods
Study population
This study included the episode of peritonitis in adult patients treated with PD at the Second Affiliated Hospital of Anhui Medical University from 1 January 2015 to 31 September 2023. All patients were used glucose-based dialysis solution and treated with continuous ambulatory peritoneal dialysis or daytime ambulatory peritoneal dialysis, and no patients were treated with automated peritoneal dialysis. The exclusion criteria were as follows: (1) patients whose dialysis effluent was not cultured, because the causative organisms could not be identified; (2) patients who lack data of dialysate white blood cell (WBC) count on day 5 after appropriate antibiotic therapy, because we could not make a diagnosis of refractory peritonitis; (3) patients with fungal peritonitis or mycobacterium peritonitis. According to the 2022 International Society for Peritoneal Dialysis (ISPD) peritonitis guideline recommendations [Citation9], peritonitis was diagnosed when the presence of any 2 of the following criteria: (1). clinical features consistent with peritonitis, that is, abdominal pain and/or cloudy dialysis effluent; (2). dialysis effluent white cell count >100/μL or >0.1 × 10⁹/L (after a dwell time of at least 2h), with >50% polymorphonuclear leukocytes; (3) positive dialysis effluent culture. Refractory peritonitis was defined as the peritonitis episode with persistently cloudy bags or persistent dialysis effluent leukocyte count >100 × 109/L after 5 days of appropriate antibiotic therapy. Multiple peritonitis refers to 2 or more peritonitis episodes, including recurrent peritonitis that occurs within 4 weeks and repeat peritonitis that occurs more than 4 weeks [Citation9]. Relapsing peritonitis was regard as one episode with the prior episode. Polymicrobial peritonitis was defined as the presence of 2 or more cultured pathogens in PD effluent. Peritonitis was treated with empirical antibiotic therapy comprising vancomycin or first-generation cephalosporin in combination with aminoglycosides or third-generation cephalosporin. This regimen was chosen to ensure comprehensive coverage of both gram-positive and gram-negative organisms. Upon the effluent culture was positive, antibiotics were adjusted based on the results of the antibiotic sensitivities test. All participants provided written informed consent. The study protocol was approved by the Ethics Committee of the Second Affiliated Hospital of Anhui Medical University (approval number: YX2022-014).
Data collection
Data were obtained from the medical records at our PD center. Upon admission for a peritonitis episode, demographic characteristics, comorbidities, and laboratory data were collected. Demographic characteristics include age, sex, and body mass index (BMI). Comorbidities include hypertension, diabetes mellitus, and cardiovascular diseases. Laboratory data were measured using standard methods, including hemoglobin, WBC, platelet, C-reactive protein (CRP), fibrinogen, creatinine, urea nitrogen, uric acid, calcium, phosphorus, potassium, magnesium, sodium, chlorine, carbon dioxide combining power (CO2CP), albumin, triglycerides, total cholesterol, and intact parathyroid hormone (iPTH). In addition, PD duration, number of peritonitis episodes, antibiotics used before admission, dialysate WBC count on day 5 after antibiotic therapy, and the type of causative organisms were also recorded. The data of patients using antibiotics before admission were obtained through detailed medical records review and patient interviews. The specimens of dialysis effluent culture were obtained before empirical antibiotic therapy was given at our center, and the method of culturing PD effluent was the inoculation of 5–10 mL effluent in 2 blood-culture bottles (aerobic and anaerobic).
Statistical analysis
In this study, all variables had less than 5% missing values (Table S1). All missing data was filled by multiple interpolation methods using the ‘mice’ package in R software, which is a well-established method for dealing with missing values. Continuous variables that follow a normal distribution were represented as mean ± standard deviation and compared using the t-test. Continuous variables that do not follow a normal distribution were represented as median (interquartile range) and compared using the Mann–Whitney U test. Categorical variables were presented as frequencies and percentages (%) and compared using the chi-square test. The study dataset was randomly divided into a training set for developing the nomogram model and a validation set for validating it. This division was achieved using simple random sampling. The table for patient characteristics was generated using the ‘CBCgrps’ package. Univariate logistic analysis, Least Absolute Shrinkage and Selection Operator (LASSO) regression analysis, and random forest (RF) algorithms were employed to determine the potential risk factors in the training set. For univariate logistic analysis, variables with p < 0.05 were regarded as potential biomarkers. LASSO regression analysis was chosen for its ability to be used to penalize the variables to reduce the risk of overfitting. We used 10-fold cross-validation to identify the most predictive variables selected by the minimum cross-validated error. For RF algorithms, which can rank variable importance based on decision-trees, the optimal hyperparameter including mtry and ntree was determined by random search, and the 5 variables of the highest importance were identified as potential biomarkers. The variables obtained by the above 3 methods were included and the backward stepwise regression was used in multivariate logistic analysis to determine the final model. Variance inflation factor (VIF) ≤5 signified the absence of collinearity between the final model variables. Based on the independent variables, the nomogram for predicting refractory peritonitis was developed by the ‘regplot’ package in R software. The discriminative ability of the nomogram was evaluated using the receiver operating characteristic (ROC) curve in both the training and validation sets. Hosmer-Lemeshow test and calibration curve were used to evaluate the calibrating ability. Moreover, Decision curve analysis (DCA) was applied to assess the clinical practicality of the nomogram. All statistical analyses were performed using R software (version 4.3.1). p < 0.05 was considered statistically significant.
Results
Patient characteristics
A total of 325 peritonitis episodes were screened in our study. 31 peritonitis episodes were excluded for the following reasons: 1 lacked dialysis effluent culture, 10 had no dialysate WBC count on day 5, and 20 were fungal peritonitis or mycobacterium peritonitis. Finally, 294 peritonitis episodes in 178 patients were included in the study, of which 93 were refractory peritonitis (). The cohort was randomly divided into a training set (70%, n = 206) and a validation set (30%, n = 88). The results of statistical analysis between the training and validation sets were presented in . Compared with the validation set, patients in the training set had a longer PD duration, higher hemoglobin levels, and a higher proportion of multiple peritonitis (p < 0.05). The characteristics of refractory peritonitis and non-refractory peritonitis in the training set were compared in . Patients with refractory peritonitis exhibited higher CRP levels, longer PD duration, a higher proportion of diabetes mellitus, use of antibiotics before admission, and multiple peritonitis. Additionally, they had lower levels of serum albumin and total cholesterol compared to those with non-refractory peritonitis (p < 0.05). Furthermore, a significant difference was observed in the type of causative organisms between the 2 groups (p < 0.05).
Figure 1. Flow chart of the participants.
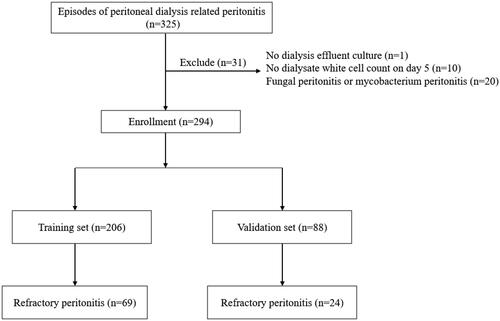
Table 1. Characteristics of the training and validation sets.
Table 2. Characteristics of refractory and non-refractory peritonitis in the training set.
Screening for potential risk factors
Univariate logistic regression analysis showed that PD duration, diabetes mellitus, CRP, serum albumin, type of causative organisms, antibiotics before admission, and multiple peritonitis were the potential risk factors of refractory peritonitis (). For LASSO regression, the optimal tuning parameter λ with 10-fold cross-validation was 0.091, following the one standard error of the minimum criteria. At this λ optimal value, PD duration, CRP, and serum albumin were identified as risk factors for refractory peritonitis (). The importance order of variables in the RF was shown in , and the top 5 important variables (CRP, iPTH, serum albumin, PD duration, and fibrinogen) were selected as potential biomarkers for refractory peritonitis. Potential biomarkers obtained by the above 3 methods were included in multivariate logistic regression analysis and backward stepwise regression was applied to identify the most reliable predictors. The results showed that CRP, serum albumin, diabetes mellitus, PD duration, and type of causative organisms were significant independent risk factors for refractory peritonitis (). The mean VIF of the model was 1.17, indicating that there is no direct multicollinearity among variables.
Figure 2. LASSO regression analysis for refractory peritonitis. Selection of tuning parameter (λ) using 10-fold cross-validation (A) and LASSO coefficient profiles of variables (B).
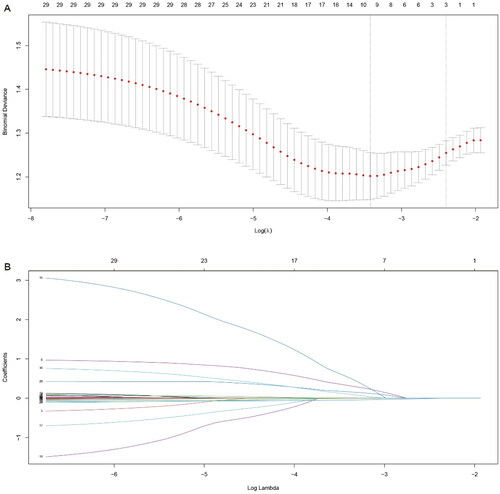
Figure 3. Random Forest algorithm to identify potential biomarkers for refractory peritonitis. CRP: C-reactive protein; iPTH: intact parathyroid hormone; PD: peritoneal dialysis; CO2CP: carbon dioxide combining power.
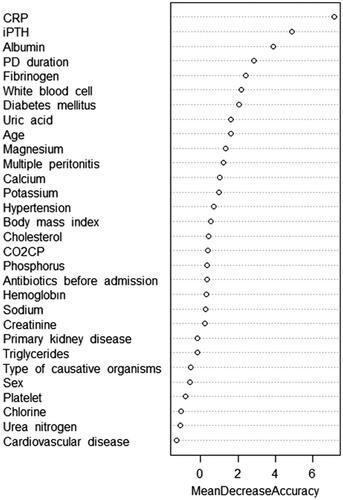
Table 3. Univariate logistic regression analysis for refractory peritonitis in the training set.
Table 4. Multivariate logistic regression analysis for refractory peritonitis in the training set.
Nomogram establishment
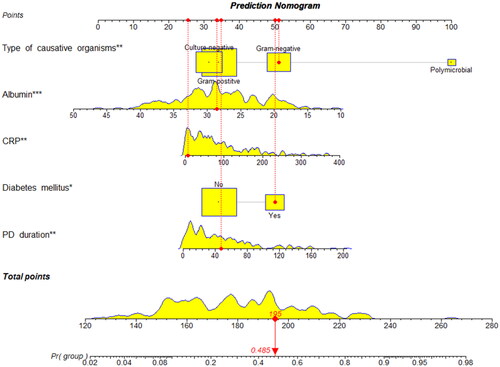
The prediction model was established based on the training set. Apply the predictors obtained from multiple logistic regression analysis to construct a nomogram, and scores were assigned to the selected variables based on their regression coefficients (). The cutoff value was 0.444, calculated as the Youden index, with a sensitivity of 0.609 and specificity of 0.825. For example, a PD patient with diabetes mellitus, culture results of gram-negative, PD duration of 47 months, CRP of 7.3 mg/L, and serum albumin of 28.6 g/L had a total score of 195, which represented the probability of 0.485 of refractory peritonitis (, vertical lines).
Figure 4. Nomogram for predicting refractory peritonitis. CRP: C-reactive protein; PD: peritoneal dialysis; *means p < 0.05; **means p < 0.01; ***means p < 0.001.
Discrimination and calibration
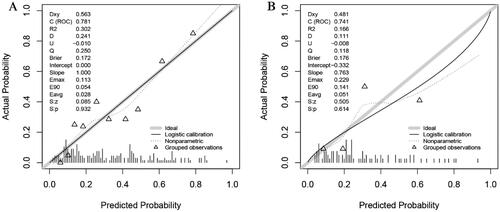
ROC curve was plotted to examine the discriminative ability of the nomogram (). The AUC values of the nomogram for predicting refractory peritonitis were 0.781 (95% CI: 0.716–0.847) in the training set and 0.741 (95% CI: 0.627–0.855) in the validation set, indicating an excellent ability to discriminate patients with refractory peritonitis. The calibration of the nomogram was examined by the Hosmer-Lemeshow test. The result of the training set was χ2=10.678, p = 0.221, and the validation set was χ2=9.784, p = 0.281. Additionally, the calibration curves for the nomogram were plotted and consistent between the observation and prediction (), indicating the good calibration ability of the predictive model.
Figure 5. The ROC curves of nomogram for predicting refractory peritonitis in the training set (A) and validation set (B).
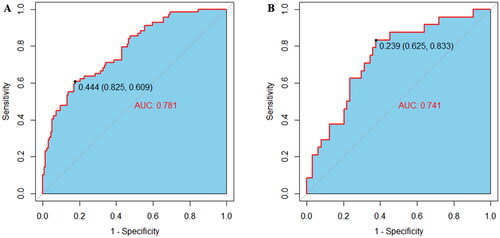
Figure 6. The calibrate curves of nomogram for predicting refractory peritonitis in the training set (A) and validation set (B).
Clinical practicality
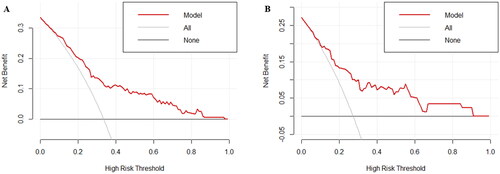
To evaluate the clinical practicality of the nomogram, the decision curves were plotted in both the training and validation sets (). The results showed that the nomogram model exhibits good clinical practicality in predicting refractory peritonitis.
Figure 7. The decision curves of nomogram for predicting refractory peritonitis in the training set (A) and validation set (B).
Discussion
Our study found that CRP, serum albumin, diabetes mellitus, PD duration, and type of causative organisms were risk factors for refractory peritonitis in patients treated with PD, and successfully developed and validated a nomogram for predicting refractory PDRP.
The nomogram is a simple, intuitive, and widely used predictive model that can be used to personalize an accurate assessment of disease risk and facilitate clinical decision-making [Citation10]. Patients with refractory peritonitis often have poor prognosis. A multicenter study explored the risk factors for treatment failure of PDRP and pointed out that dialysate WBC count on day 5 was a predictive factor [Citation11]. We know that the main diagnostic criterion for refractory peritonitis is that dialysate WBC count on day 5 is still not normal after appropriate antibiotic therapy, but there is currently no research on developing a visual predictive model for refractory peritonitis that can be diagnosed before treatment failure. The 2022 update of the ISPD peritonitis guidelines [Citation9] states that even if the PD effluent is still not normal on day 5, if it is decreasing toward normal, then mandatory PD catheter removal is not necessary. The update of the guidelines tells us that the cutoff of 5 days is just an arbitrary reference tool, and refractory peritonitis does not mean that antibiotic therapy will fail, or that the PD catheter must be removed. Therefore, identifying risk factors for refractory peritonitis and establishing a nomogram to predict its occurrence are important for making personalized clinical decision-making before treatment failure, and may help guide peritonitis treatment and prolong PD catheter survival.
CRP is a widely recognized inflammatory indicator that is highly sensitive to bacterial infections. During the acute phase of inflammation, CRP synthesis increases, and after the inflammation subsides, it drops to normal levels [Citation12]. Previous studies have confirmed that CRP was a predictive factor for treatment failure in peritonitis [Citation13]. This study found that CRP was a risk factor for refractory peritonitis, which may be due to elevated levels of CRP indicating a persistent and severe inflammatory response, and this continuous condition may further damage the body’s immune function and weaken the defense capability.
Serum albumin is a significant protein in human physiology, contributing to functions including maintaining colloid osmotic pressure, transporting substances, and anti-inflammatory [Citation14]. In our study, we identified serum albumin levels as a risk factor for refractory peritonitis. Consistent with prior research, hypoalbuminemia has been recognized as a risk factor for peritonitis [Citation15] and treatment failure in peritonitis [Citation11] among patients treated with PD. Hypoproteinemia is associated with various factors, including protein loss, malnutrition, inflammation, and others. In patients treated with PD, the disruption of the peritoneal charge barrier [Citation16] and the increased peritoneal protein clearance [Citation17] contribute to continuous protein loss from the peritoneal dialysate. Malnutrition and inflammation both reduce serum albumin levels by inhibiting albumin synthesis, and inflammation is also associated with a higher fractional catabolic rate, which also results in lower albumin levels [Citation18]. Additionally, insufficient intake is also the reason for hypoproteinemia in patients treated with PD. The cumulative effect of these factors results in reduced serum albumin levels, which may impair the host immune response, thereby increasing the risk of refractory peritonitis.
A significant association was found between diabetes mellitus and refractory peritonitis in this study. Diabetes mellitus stands as one of the common reasons for kidney failure. While some studies have pointed out that diabetes mellitus was an independent risk factor for the poor prognosis of peritonitis [Citation19], others have reported no correlation between diabetes mellitus and peritonitis outcomes [Citation20]. Patients with diabetes have an increased risk of infections and are associated with impaired immunity [Citation21]. Diabetes mellitus may also impair peritoneal defenses, especially in patients with poorly controlled diabetics [Citation22]. The incidence of malnutrition was also higher in patients diagnosed with diabetes [Citation23]. Therefore, we suspect that the above reasons may lead to the unsatisfactory treatment effect of peritonitis and the occurrence of refractory peritonitis in diabetes mellitus patients.
The relationship between PD duration and peritonitis prognosis has been widely discussed. Previous studies have shown that PD duration was significantly associated with treatment failure and was an independent risk factor for poor prognosis in peritonitis [Citation6,Citation24]. With the extension of PD duration, the peritoneum is continuously exposed to non-biocompatible glucose-based dialysis solution, which results in a change in peritoneal morphology and impaired function [Citation25]. In addition, peritoneal immune defense function was also affected in patients with long PD duration [Citation26]. In summary, we suspect that these structural and functional changes contribute to the development of refractory peritonitis.
This study observed that compared to gram-positive peritonitis, both gram-negative and polymicrobial infection peritonitis were associated with a higher incidence of refractory peritonitis. Gram-negative peritonitis, typically originating from the intestines, may have a poor prognosis due to factors such as constipation, colitis, or abdominal cavity infections [Citation27]. The presence of immunocompromised comorbidities, an extended PD duration, and increased antimicrobial resistance may contribute to this unfavorable outcome [Citation28]. Additionally, biofilm production can also lead to unsuccessful treatment of gram-negative peritonitis [Citation29]. For polymicrobial peritonitis, Ribera-Sánchez et al. noted that the adverse outcome of polymicrobial peritonitis was associated with the presence of specific microorganisms [Citation30]. Overall, there is a reasonable suspicion that the combination of these conditions leads to the failure of complete bacterial clearance in a short time, resulting in the occurrence of refractory peritonitis.
This study possesses several strengths. First, we employed a diverse array of methods to screen potential risk factors, minimizing the risk of overlooking important variables. Second, to the best of our knowledge, this is the first nomogram model for predicting refractory peritonitis, offering a visually intuitive, individualized, comprehensive, and quantitative approach to risk assessment. Third, while previous studies predominantly concentrated on the treatment failure of peritonitis, there has been a relative scarcity of research on the risk factors for refractory peritonitis. Our identification of potential risk factors and the construction of predictive models may enhance patient prognosis through personalized decision-making prior to peritonitis treatment failures, including optimizing antibiotic regimens and adjusting dialysis prescriptions based on individual patient characteristics and risk profiles. However, certain limitations should be acknowledged in our study. First, as a retrospective study, we were able to incorporate all potential variables, including dialysate WBC count on day 3, peritoneal transport functional characteristics, the presence or absence of exit-site or tunnel infections, and so on. We also did not include patients treated with automated peritoneal dialysis. Second, our analysis solely focused on the dialysis effluent culture result, without conducting further statistical analysis on drug resistance. Third, the nomogram we developed can only predict those who will have a persistent dialysis effluent leukocyte count >100 × 109/L after 5 days of appropriate antibiotic therapy, but we cannot distinguish those who truly are not responsive to antibiotics with treatment failure and those who merely have a persistently raised dialysis effluent leukocyte count at day 5. Further studies into the actual outcome are required. Fourth, the training and validation sets had a significant difference in PD duration, hemoglobin levels, and the proportion of multiple peritonitis. This study also lacks external validation. Thus, other external datasets will encourage widespread use of this nomogram to validate the generalizability of the model.
In summary, we successfully developed and validated a nomogram to predict the occurrence of refractory peritonitis in patients treated with PD. This nomogram holds promise in facilitating early identification of refractory peritonitis, enabling timely and personalized clinical decisions to improve peritonitis outcomes.
Ethnic approval
This study was approved by the Ethics Committee of the Second Affiliated Hospital of Anhui medical University (authorization number: YX2022-014).
Author contributions
Qiqi Yan designed study, performed analysis, and drafted the manuscript. Deguang Wang designed and directed the study. Guiling Liu, Ruifeng Wang, Dandan Li, and Xiaoli Chen collected data. All authors approved the final manuscript.
Supplemental Material
Download ()Acknowledgement
We gratefully acknowledge all participants in this study.
Disclosure statement
No potential conflict of interest was reported by the author(s).
Data availability statement
Data will be made available on request.
Additional information
Funding
References
- Mcgill RL, Weiner DE, Ruthazer R, et al. Transfers to hemodialysis among US patients initiating renal replacement therapy with peritoneal dialysis. Am J Kidney Dis. 2019;74(5):1–12. doi: 10.1053/j.ajkd.2019.05.014.
- Trionfetti F, Marchant V, González-Mateo GT, et al. Novel aspects of the immune response involved in the peritoneal damage in chronic kidney disease patients under dialysis. Int J Mol Sci. 2023;24(6):24. doi: 10.3390/ijms24065763.
- Zelenitsky SA, Howarth J, Lagacé-Wiens P, et al. Microbiological trends and antimicrobial resistance in peritoneal dialysis-related peritonitis, 2005 to 2014. Perit Dial Int. 2017;37(2):170–176. doi: 10.3747/pdi.2016.00136.
- Thammishetti V, Kaul A, Bhadauria DS, et al. A retrospective analysis of etiology and outcomes of refractory CAPD peritonitis in a tertiary care center from North India. Perit Dial Int. 2018;38(6):441–446. doi: 10.3747/pdi.2017.00145.
- Lee CC, Tu KH, Chen HH, et al. Risk factors for drainage-requiring ascites after refractory peritonitis in peritoneal dialysis patients. Int Urol Nephrol. 2016;48(10):1721–1730. doi: 10.1007/s11255-016-1376-y.
- Liang Q, Zhao H, Wu B, et al. Effect of different dialysis duration on the prognosis of peritoneal dialysis-associated peritonitis: a single-center, retrospective study. Ren Fail. 2023;45(1):2177496. doi: 10.1080/0886022X.2023.2177496.
- Liao CT, Zheng CM, Lin YC, et al. Aberrant serum parathyroid hormone, calcium, and phosphorus as risk factors for peritonitis in peritoneal dialysis patients. Sci Rep. 2021;11(1):1171. doi: 10.1038/s41598-020-80938-2.
- Admas T, Banjaw A. Healthcare professionals’ knowledge, attitudes and future expectations towards personalized medicine. Per Med. 2021;18(5):483–490. doi: 10.2217/pme-2020-0185.
- Li PK, Chow KM, Cho Y, et al. ISPD peritonitis guideline recommendations: 2022 update on prevention and treatment. Perit Dial Int. 2022;42(2):110–153. doi: 10.1177/08968608221080586.
- Shariat SF, Capitanio U, Jeldres C, et al. Can nomograms be superior to other prediction tools? BJU Int. 2009;103(4):492–497. doi: 10.1111/j.1464-410X.2008.08073.x.
- Meng L, Zhu X, Yang L, et al. Development and validation of a prediction model for treatment failure in peritoneal dialysis-associated peritonitis patients: a multicenter study. Nan Fang Yi Ke Da Xue Xue Bao. 2022;42(4):546–553. doi: 10.12122/j.issn.1673-4254.2022.04.10.
- Yao Z, Zhang Y, Wu H. Regulation of C-reactive protein conformation in inflammation. Inflamm. Res. 2019;68(10):815–823. doi: 10.1007/s00011-019-01269-1.
- Mao Y, Xiao D, Deng S, et al. Development of a clinical risk score system for peritoneal dialysis-associated peritonitis treatment failure. BMC Nephrol. 2023;24(1):229. doi: 10.1186/s12882-023-03284-1.
- Gremese E, Bruno D, Varriano V, et al. Serum albumin levels: a biomarker to be repurposed in different disease settings in clinical practice. J Clin Med. 2023;12(18):6017. doi: 10.3390/jcm12186017.
- Dai R, Peng C, Sang T, et al. Construction and validation of a predictive model for the risk of peritoneal dialysis-associated peritonitis after peritoneal dialysis catheterization. Front Med. 2023;10:1193754. doi: 10.3389/fmed.2023.1193754.
- Yu GQ, Chen J, Li JX. The association between peritoneal charge barrier dysfunction and protein lost during continuous ambulatory peritoneal dialysis. Kidney Blood Press Res. 2013;37(4–5):252–258. doi: 10.1159/000350150.
- Yu Z, Lambie M, Chess J, et al. Peritoneal protein clearance is a function of local inflammation and membrane area whereas systemic inflammation and comorbidity predict survival of incident peritoneal dialysis patients. Front Physiol. 2019;10:105. doi: 10.3389/fphys.2019.00105.
- Don BR, Kaysen G. Serum albumin: relationship to inflammation and nutrition. Semin Dial. 2004;17(6):432–437. doi: 10.1111/j.0894-0959.2004.17603.x.
- Liu X, Qin A, Zhou H, et al. Novel predictors and risk score of treatment failure in peritoneal dialysis-related peritonitis. Front Med. 2021;8:639744. doi: 10.3389/fmed.2021.639744.
- Meng LF, Yang LM, Zhu XY, et al. Comparison of clinical features and outcomes in peritoneal dialysis-associated peritonitis patients with and without diabetes: a multicenter retrospective cohort study. World J Diabetes. 2020;11(10):435–446. doi: 10.4239/wjd.v11.i10.435.
- Muller LM, Gorter KJ, Hak E, et al. Increased risk of common infections in patients with type 1 and type 2 diabetes mellitus. Clin Infect Dis. 2005;41(3):281–288. doi: 10.1086/431587.
- Santamaría B, Sanz A, Justo P, et al. Peritoneal defence–lessons learned which apply to diabetes complications. Nephrol Dial Transplant. 2006;21(Suppl 2):ii12–ii15. doi: 10.1093/ndt/gfl185.
- Ran Q, Zhao X, Tian J, et al. A nomogram model for predicting malnutrition among older hospitalized patients with type 2 diabetes: a cross-sectional study in China. BMC Geriatr. 2023;23(1):565. doi: 10.1186/s12877-023-04284-4.
- Guo S, Yang L, Zhu X, et al. Multidrug-resistant organism-peritoneal dialysis associated peritonitis: clinical and microbiological features and risk factors of treatment failure. Front Med. 2023;10:1132695. doi: 10.3389/fmed.2023.1132695.
- Bartosova M, Schaefer B, Vondrak K, et al. Peritoneal dialysis vintage and glucose exposure but not peritonitis episodes drive peritoneal membrane transformation during the first years of PD. Front Physiol. 2019;10:356. doi: 10.3389/fphys.2019.00356.
- Parikova A, Hruba P, Krediet RT, et al. Long-term peritoneal dialysis treatment provokes activation of genes related to adaptive immunity. Physiol Res. 2019;68(5):775–783. doi: 10.33549/physiolres.934158.
- Zeng Y, Jiang L, Lu Y, et al. Peritoneal dialysis-related peritonitis caused by gram-negative organisms: ten-years experience in a single center. Ren Fail. 2021;43(1):993–1003. doi: 10.1080/0886022X.2021.1939050.
- Lin WH, Tseng CC, Wu AB, et al. Clinical and microbiological characteristics of peritoneal dialysis-related peritonitis caused by Escherichia coli in southern Taiwan. Eur J Clin Microbiol Infect Dis. 2018;37(9):1699–1707. doi: 10.1007/s10096-018-3302-y.
- Dias RCB, Vieira MA, Moro AC, et al. Characterization of Escherichia coli obtained from patients undergoing peritoneal dialysis and diagnosed with peritonitis in a Brazilian centre. J Med Microbiol. 2019;68(9):1330–1340. doi: 10.1099/jmm.0.001043.
- Ribera-Sánchez R, Pérez-Fontán M, López-Iglesias A, et al. Comprehensive approach to peritoneal dialysis-related peritonitis by enteric microorganisms. comparison between single organism and polymicrobial infections. Perit Dial Int. 2018;38(2):139–146. doi: 10.3747/pdi.2017.00184.