
Abstract
Aims
This study aimed to investigate the correlations between estimated small dense low-density lipoprotein-cholesterol (esd-LDL-c) and the development of end-stage kidney disease (ESKD), cardiovascular mortality, and all-cause mortality in individuals with diabetic kidney disease (DKD) or diabetes mellitus (DM) concomitant chronic kidney disease (CKD).
Methods
We analyzed the data from a biopsy-proven DKD cohort conducted at West China Hospital of Sichuan University between 2009 and 2021 (the DKD cohort) and participants with DM and CKD in the National Health and Nutrition Examination Survey (NHANES) 2011–2014 (the NHANES DM-CKD cohort). Cox regression analysis was also used to estimate associations between esd-LDL-c and the incidence of ESKD, cardiovascular mortality, and all-cause mortality.
Results
There were 175 ESKD events among 338 participants in the DKD cohort. Patients were divided into three groups based on esd-LDL-c tertiles (T1 < 33.7 mg/dL, T2 ≥ 33.7 mg/dL to <45.9 mg/dL, T3 ≥ 45.9 mg/dL). The highest tertile of esd-LDL-c was associated with ESKD (adjusted HR 2.016, 95% CI 1.144–3.554, p = .015). Furthermore, there were 99 deaths (39 cardiovascular) among 293 participants in the NHANES DM-CKD cohort. Participants were classified into three groups in line with the tertile values of esd-LDL-c in the DKD cohort. The highest tertile of esd-LDL-c was associated with cardiovascular mortality (adjusted HR 3.95, 95% CI 1.3–12, p = .016) and all-cause mortality (adjusted HR 2.37, 95% CI 1.06–5.32, p = .036).
Conclusions
Higher esd-LDL-c was associated with increased risk of ESKD in people with biopsy-proven DKD, and higher cardiovascular and all-cause mortality risk among those with DM-CKD.
1. Introduction
The incidence of diabetes mellitus (DM) has been steadily rising [Citation1]. This situation leads to an increase in the prevalence of chronic kidney disease (CKD) attributed to DM (i.e., diabetic kidney disease, DKD) [Citation2]. Individuals with DKD face elevated risk of developing end-stage kidney disease (ESKD), cardiovascular disease (CVD), heart failure, and premature mortality [Citation3]. Despite the implementation of comprehensive intervention strategies targeting lifestyle, glycemia, blood pressure, and lipids, along with the emergence of novel risk mitigation drugs (such as sodium-glucose cotransporter-2 inhibitors, glucagon-like peptide-1 receptor agonists, and mineralocorticoid receptor antagonists), people with DKD still experience a high residual risk of kidney disease progression and cardiovascular complications [Citation4]. The prognosis of DKD exhibits substantial variability that cannot be fully explained by traditional risk factors alone [Citation5]. Therefore, it is critical to find new predictors related to DKD so that high-risk individuals can be identified and given the appropriate early care.
A variety of pathophysiological factors lead to DKD. Excessive glucose produces many harmful reactive oxygen species (ROS), causing renal intrinsic cells dysfunction, inflammation, and apoptosis [Citation5]. Prolonged high kidney filtration, hypertension, and an overactive renin–angiotensin–aldosterone system further increase renal stress and promote renal injury and fibrosis [Citation6]. Additionally, DM patients are often characterized by dyslipidemia, such as elevated triglycerides (TGs) and low-density lipoprotein cholesterol (LDL-c), posing another significant risk of DKD [Citation7]. Redundant lipid mediators trigger inflammation and ROS, disrupt cell energy production, induce endoplasmic reticulum stress, and lead to cell death [Citation8]. Current guidelines focus on LDL-c levels for intervention to mitigate these risks [Citation9]. However, many people remain susceptible to cardiovascular events even with effective reduction of LDL-c [Citation10]. Notably, LDL-c exists in different subfractions. The smaller particle subfractions from LDL-c, known as small dense LDL-c (sd-LDL-c), exhibit distinct characteristics. sd-LDL-c is easier to be oxidized, permeable to the endothelium, and has a longer time for circulation than LDL-c with larger particle subfractions (large buoyant LDL-c, lb-LDL-c) [Citation11]. Moreover, some people with low LDL-c still exhibit high sd-LDL-c [Citation12], which may explain the presence of residual risk. Furthermore, sd-LDL-c has been successively reported to be a significant risk factor for CVD events and independent of conventional CVD risk factors [Citation13–17]. In addition, several small-scale investigations have also found that sd-LDL-c is associated with the CKD stages [Citation18] and the occurrence of CVD events [Citation19], such as acute coronary syndrome and stroke in patients with CKD. Although DKD often presents with average levels of LDL-c but higher levels of sd-LDL-c [Citation20], the relationship between sd-LDL-c and the kidney and cardiovascular prognosis in people with DKD has not been thoroughly investigated.
Recently, a new equation based on the standard lipid panel for calculating sd-LDL-c has emerged [Citation21]. Significantly, it enhances the estimation of atherosclerotic cardiovascular disease (ASCVD) risk [Citation21] and the prediction of type 2 diabetes mellitus (T2DM) onset [Citation22] in the general population. Notably, sd-LDL-c requires advanced lipid testing, but simple and reliable prediction equations are more conducive to the clinical and epidemiological study of sd-LDL-c. Therefore, this research aimed to assess the association between estimated sd-LDL-c (esd-LDL-c) and the likelihood of developing ESKD and cardiovascular mortality in individuals diagnosed with DKD or DM combined with CKD.
2. Methods
2.1. Study design and participants
Our study comprised two cohorts. One of the cohorts was conducted at West China Hospital of Sichuan University and included patients over 18 years old with T2DM and biopsy-confirmed DKD between April 2009 and August 2021. We aimed to explore the association of esd-LDL-c levels with the risk of ESKD. However, our cohort was not explicitly designed to track cardiovascular events or causes of death. To address this aspect, the National Health and Nutrition Examination Survey (NHANES) database, containing a nationally representative sample to assess the health and nutritional status of US citizens, was utilized. The NHANES database is also linked to mortality status and cause of death from the National Death Index (NDI). Furthermore, we extracted relevant data to investigate the relation of esd-LDL-c with cardiovascular mortality and all-cause mortality.
For our cohort, the study design received approval from the ethics committee of West China Hospital, Sichuan University (Ethical number 20231143). All individuals provided written informed consent. The diagnostic criteria of T2DM were based on the 2018 American Diabetes Association (ADA) diagnostic criteria [Citation23] or self-reported. The diagnostic criteria of diabetic nephropathy (DN) were based on the requirements established by the Renal Pathology Society (RPS) in 2010 [Citation24], indicating DKD is strictly proven by kidney biopsy. Moreover, patients with T2DM and biopsy-proven DKD were eligible. We excluded people if they (1) were in ESKD at baseline; (2) with a follow-up duration of fewer than 12 months; (3) with incomplete blood examination data at baseline; (4) suffered malignant tumor, hepatic cirrhosis, or severe infection. Finally, 338 people with DKD were included in the overall population and named the DKD cohort ().
Figure 1. Flowchart of included patients in this study. (a) The DKD cohort; (b) the NHANES DM-CKD cohort. DM: diabetes mellitus; DKD: diabetic kidney disease; CKD: chronic kidney disease; NHANES: National Health and Nutrition Examination Survey; ESKD: end-stage kidney disease; LDL-c: low-density lipoprotein cholesterol; TG: triglycerides.
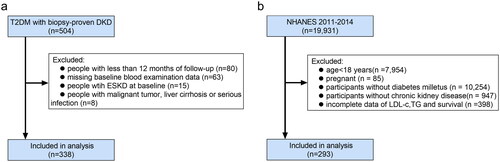
The NHANES protocol was approved by the National Center for Health Statistics (NCHS) Ethics Review Board [Citation25]. Written informed consent was obtained from all participants [Citation25]. DM was defined as a previously reported diagnosis by healthcare providers, or glycosylated hemoglobin (HbA1c) ≥6.5 mmol/L, or using diabetes drugs. CKD was diagnosed for estimated glomerular filtration rate (eGFR) <60 mL/min/1.73 m2 (assessed by using the Chronic Kidney Disease Epidemiology Collaboration) or albumin creatinine ratio (ACR) ≥30 mg/g. Furthermore, participants in 2011–2014 NHANES were included and excluded for (1) age <18 years; (2) pregnancy; (3) without DM; (4) without CKD; (5) missing LDL-c, TG value, and mortality data. A total of 293 participants with DM-CKD were enrolled in NHANES 2011–2014 and named the NHANES DM-CKD cohort ().
2.2. Procedures
From the DKD cohort, we collected information on demographics, disease history, medical history, and laboratory and pathological data from the hospital information system. Individuals underwent regular follow-up visits per year, depending on the severity of their condition. The eGFR was calculated using the formula of Chronic Kidney Disease Epidemiology Collaboration [Citation26]. Moreover, pathological lesions were assessed by two renal pathologists following the 2010 RPS criteria [Citation24]. The study outcome in the DKD cohort was the progression to ESKD (eGFR <15 mL/min/1.73 m2, or the initiation of long-term dialysis) or treatment of kidney transplantation.
From the NHANES DM-CKD cohort, we extracted clinical variables of interest from the NCHS website (https://www.cdc.gov/nchs/nhanes/index.htm). Additionally, mortality data were obtained through a linkage process between personal identifiers from NHANES and death certificates from the NDI until 2019 (https://www.cdc.gov/nchs/ndi/index.htm). Furthermore, the study outcomes in the NHANES DM-CKD cohort were CVD mortality (determined based on the recorded cause of death utilizing International Classification of Diseases 10 (ICD-10) codes (I00–I09, I11, I13, and I20–151)) and all-cause mortality. Additional definitions can be found in Table S1.
2.3. The formula and measurement for sd-LDL-c
The equation for esd-LDL-c needed TG and LDL-c values, according to previous reports [Citation21]. esd-LDL-c was calculated by the following equation: (1) esd-LDL-c = LDL-c − estimated large buoyant LDL cholesterol (elb-LDL-c); (2) elb-LDL-c = 1.43 × LDL-c − (0.14 × [ln (triglyceride) × LDL-c]) − 8.99.
In addition, we attempted to assess the validity of this formula in people with DKD. sd-LDL-c was tested by the Vertical Auto Profile (VAP) method from 30 people’s serum samples in the DKD cohort. The 30 samples were selected from individuals with available specimens and complete follow-up data. Notably, the process of VAP can simultaneously measure cholesterol concentrations of all five lipoprotein classes and their subclasses via inverted rate zonal, single vertical spin, and density gradient ultracentrifugation technique [Citation27].
2.4. Statistical analysis
The baseline characteristics of the overall study population and across the esd-LDL-c groups were described as mean ± standard deviation if normally distributed or median (25% quantile, 75% quantile) if skewed distributed for continuous variables. Categorical variables were described as frequency (%). The Shapiro–Wilk test was used to assess whether variables were normally distributed. The one-way ANOVA or Kruskal–Wallis test was used to analyze the differences among groups for continuous variables. The Chi-square test or Fisher’s test was used to compare categorical variables. The Spearman rank correlation coefficient was used to assess the correlation between variables. Restricted cubic splines were plotted to flexibly model the association of esd-LDL-c with ESKD, cardiovascular death, and all-cause mortality. Comparisons of survival rates among different groups were evaluated by the Kaplan–Meier method and log-rank test. Moreover, multivariate Cox regression analysis was performed to analyze the influence of esd-LDL-c on kidney outcomes, cardiovascular outcomes, and all-cause mortality. Notably, the relationship between esd-LDL-c and measured sd-LDL-c (msd-LDL-c) was assessed by linear regression. For the NHANES DM-CKD cohort, we additionally considered stratification and clustering in the design. We utilized weighted samples in all analyses to generate estimates generalizable to the 2011–2014 US citizens. A two-sided p < .05 indicated statistical significance.
3. Results
3.1. Baseline characteristics
A total of 338 patients were included in the DKD cohort (), with a median esd-LDL-c of 39.99 (29.92, 52.03) mg/dL, median age of 51 (46, 58) years, median HbA1c of 7.4 (6.35, 8.6) %, median eGFR of 58.51 (42.37, 91.48) mL/min/1.73 m2, and median proteinuria of 4.17 (2.01, 7.14) g/day. 71.9% were male. All the patients were divided into three groups based on esd-LDL-c tertiles (T1 < 33.7 mg/dL, T2 ≥ 33.7 mg/dL to <45.9 mg/dL, T3 ≥ 45.9 mg/dL). People with higher esd-LDL-c demonstrated higher levels of fasting blood glucose (FBG), proteinuria, TG, total cholesterol, and LDL-c (). Furthermore, an elevated level of esd-LDL-c was positively correlated (r = 0.147, p = .007) with worse interstitial inflammation (Table S2).
Table 1. Clinical and pathological features of patients stratified across the tertiles of esd-LDL-c in DKD cohort.
Two hundred and ninety-three participants were admitted to the NHANES DM-CKD cohort, as illustrated in . The median esd-LDL-c was at 31.82 (23.88, 40.90) mg/dL, and the median age was 67 (56, 76) years. The median HbA1c was 7.20 (6.50, 8.67) %. The median eGFR was 56.64 (46.72, 88.02) mL/min/1.73 m2, and the median ACR was 46.82 (13.25, 111.45) mg/g. 55.1% were male. To investigate the applicability of the thresholds of esd-LDL-c, participants in the NHANES DM-CKD cohort were classified into three groups using thresholds identical to those employed in the DKD cohort (T1 < 33.7 mg/dL, T2 ≥ 33.7 mg/dL to <45.9 mg/dL, T3 ≥ 45.9 mg/dL). Notably, participants with higher esd-LDL-c levels demonstrated a tendency toward younger age and a more significant proportion of Hispanic ethnicity. Furthermore, they displayed elevated levels of HbA1c, ACR, eGFR, TG, total cholesterol, high-density lipoprotein cholesterol (HDL-c), and LDL-c ().
Table 2. Clinical features of patients stratified by esd-LDL-c in NHANES DM-CKD cohort.
3.2. Association of esd-LDL-c with ESKD in patients with DKD
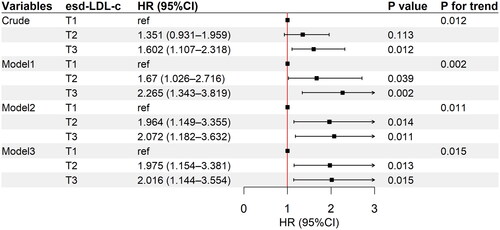
During the median follow-up of 27.5 (16–47) months, 175 of 338 (51.8%) patients progressed to ESKD. Additionally, Kaplan–Meier’s analysis indicated that patients with higher esd-LDL-c at baseline had a significantly higher risk of progressing to ESKD (p = .04, ). The non-linear test (p = .436) indicated the linearity of the effect of esd-LDL-c levels on kidney survival. Restricted cubic splines were also used to flexibly model and visualize the relation of esd-LDL-c with kidney survival (). Univariable Cox regression analysis suggested that the highest tertile was associated with higher risk of ESKD (HR 1.602, 95% CI 1.107–2.318, p = .012) (Table S3). Moreover, after adjusting for age, sex, DM duration, hypertension, HbA1c, hemoglobin, smoking, alcohol drinking, eGFR, proteinuria, and statins and RASI use (model 3), the second tertile (HR 1.975, 95% CI 1.154–3.381, p = .013) and the third tertile (HR 2.016, 95% CI 1.144–3.554, p = .015) in esd-LDL-c were associated with a higher incidence of ESKD, with p linear trend = .015 (, Table S3). However, LDL-c did not show any association with ESKD after multifactor correction (tertile 3, HR 1.561, 95% CI 0.891–2.733, p = .119) (Table S4).
Figure 2. Association between esd-LDL-c and ESKD in the DKD cohort. (a) Kaplan–Meier’s curves of kidney survival rate in patients with different esd-LDL-c levels; (b) restricted cubic spline plot for the association of esd-LDL-c with ESKD; (c) proportions of four different lipid patterns cross-classified according to the 33th percentile of LDL-c (95.06 mg/dL) and esd-LDL-c (33.74 mg/dL); (d) Kaplan–Meier’s curves of kidney survival rate in patients with four different lipid patterns. 1# LDL-c < 95.06 mg/dL and esd-LDL-c <33.74 mg/dL; 2# LDL-c <95.06 mg/dL and esd-LDL-c ≥33.74 mg/dL; 3# LDL-c ≥95.06 mg/dL and esd-LDL-c <33.74 mg/dL; 4# LDL-c ≥95.06 mg/dL and esd-LDL-c ≥33.74 mg/dL. esd-LDL-c: estimated small dense low-density lipoprotein cholesterol; DKD: diabetic kidney disease; LDL-c: low-density lipoprotein cholesterol; ESKD: end-stage kidney disease.
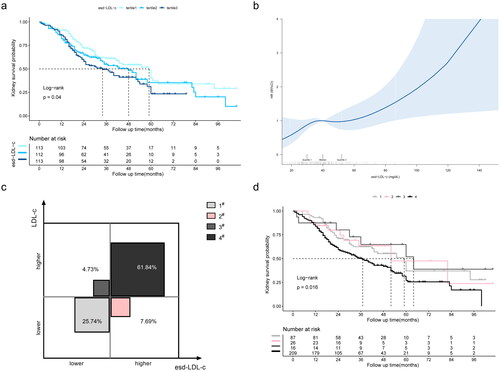
Figure 3. Adjusted HR for esd-LDL-c with ESKD in the DKD cohort. T1, <33.7 mg/dL; T2, 33.7–45.9 mg/dL; T3, ≥45.9 mg/dL. Model 1 adjusted for age, sex, DM duration, hypertension, HbA1c, hemoglobin, smoking, and alcohol drinking; model 2 adjusted for covariates in model 1 plus eGFR and proteinuria; model 3 adjusted for covariates in model 2 plus statins and RASI use. HR: hazard ratio; CI: confidence interval; esd-LDL-c: estimated small dense low-density lipoprotein cholesterol; ESKD: end-stage kidney disease; DKD: diabetic kidney disease; eGFR: estimated glomerular filtration rate; RASI: renin–angiotensin system inhibitor.
The population was divided into four different lipid patterns by cross-classification based on the 33rd percentile of LDL-c (95.1 mg/dL) and esd-LDL-c (33.7 mg/dL) (). Among our participants, 7.69% had lower LDL-c but higher esd-LDL-c levels (around 1/5 in those with lower LDL-c). Not surprisingly, the median survival time was shortest among individuals with concordantly higher levels of LDL-c and esd-LDL-c (37 months). Furthermore, among people with lower LDL-c, those with higher esd-LDL-c had a shorter median survival time than those with lower esd-LDL-c (52 months vs. 59 months) ().
To estimate the relationship reliability between esd-LDL-c and msd-LDL-c, we analyzed the data from 30 patients with sd-LDL-c measured by VAP. The R2 of the linear model was 0.521 with p < .001 (Figure S1(a)). The association between msd-LDL-c and the ESKD was visualized using a restricted cubic spline plot, which demonstrated a linear relationship (non-linear test: p = .949) (Figure S1(b)). Moreover, the optimal cut-point for msd-LDL-c (28.96 mg/dL) was determined according to standardized log-rank statistics (Figure S1(c)). Furthermore, Kaplan–Meier’s analysis indicated that patients with higher msd-LDL-c at baseline had a significantly higher risk of progressing to ESKD (p = .023, Figure S1(d)).
3.3. Association of esd-LDL-c with cardiovascular and all-cause mortality in patients with DM-CKD
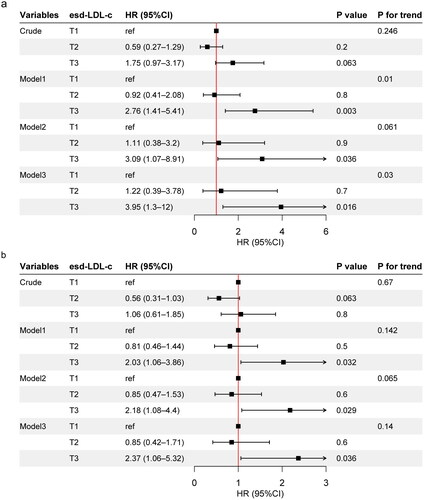
There were 39 deaths from cardiovascular causes among 293 participants (13.3%) over a median follow-up period of 76 (61–91) months. Kaplan–Meier’s analysis revealed a significant association between higher baseline esd-LDL-c levels and an increased risk of CVD death (p = .035, Figure S2(a)). The restricted cubic splines displayed a linear trend in Figure S2(b). Following adjustment for age, sex, HbA1c, eGFR, and ACR (model 1), the highest tertile of esd-LDL-c was associated with higher risk of CVD mortality (HR 2.76, 95% CI 1.41–5.41, p = .003). After additional correction for race, hypertension, alcohol drinking, smoking, and statins and RASI use (model 3), the highest tertile was still associated with higher incidence of CVD death (HR 3.95, 95% CI 1.3–12, p = .016), with a linear trend (p linear trend = .03) (, Table S5). For all-cause mortality, a total of 99 deaths were recorded, representing a mortality rate of 33.8%. Consequently, the highest level of esd-LDL-c was also linked to increased risk of all-cause mortality (HR 2.37, 95% CI 1.06–5.32, p = .036, model 3) ().
Figure 4. Adjusted HR for esd-LDL-c with cardiovascular mortality and all-cause mortality in the NHANES DM-CKD cohort. (a) Cardiovascular mortality, model 1 adjusted for age, sex, HbA1c, eGFR, and ACR; model 2 adjusted for covariates in model 1 plus race, hypertension, alcohol drinking, and smoking; model 3 adjusted for covariates in model 2 plus statins and RASI use. (b) All-cause mortality, model 1 adjusted for age, sex, and race; model 2 adjusted for covariates in model 1 plus HbA1c, hypertension, alcohol drinking, smoking, eGFR, and ACR; model 3 adjusted for covariates in model 2 plus statins and RASI use. T1, esd-LDL-c <33.7 mg/dL; T2, 33.7≤ esd-LDL-c <45.9 mg/dL; T3, esd-LDL-c ≥45.9 mg/dL. HR: hazard ratio; CI: confidence interval; esd-LDL-c: estimated small dense low-density lipoprotein cholesterol; DM: diabetes mellitus; CKD: chronic kidney disease; NHANES: National Health and Nutrition Examination Survey; eGFR: estimated glomerular filtration rate; ACR: albumin creatinine ratio.
4. Discussion
To our knowledge, this is the first study to explore the association between esd-LDL-c levels and the occurrence of ESKD in patients with DKD. Additionally, this is the first study to examine the association between esd-LDL-c levels and the incidence of cardiovascular-related deaths as well as all-cause deaths in patients with DM-CKD. We found (1) DKD individuals who had a higher esd-LDL-c, which was associated with increased proteinuria, more serious interstitial inflammation, and a higher risk of progressing to ESKD; DM-CKD individuals with higher esd-LDL-c were also linked to a higher risk of cardiovascular mortality and all-cause mortality; (2) despite lower LDL-c, higher esd-LDL-c still had a higher risk of progression to ESKD than lower esd-LDL-c in people with DKD; (3) esd-LDL-c indicated a value close to msd-LDL-c, increasing the interpretability of esd-LDL-c as a risk factor based on sd-LDL-c.
Gofman and colleagues first describe differences between subclasses of LDL in 1951 [Citation28]. Since then, there have been an increasing number of studies exploring whether LDL subclasses are more closely associated with the development of CVD. Austin et al.'s case-control study in 1998 found that sd-LDL particles were significantly associated with a threefold increased risk of myocardial infarction [Citation13]. Recent studies have also reconfirmed that sd-LDL-c is an excellent biomarker for the incidence [Citation29] and progression [Citation30] of coronary heart disease and the most effective predictor of residual risk for future cardiovascular events in stable coronary artery disease patients using statins [Citation31]. Moreover, there is a retrospective study involving 145 CKD patients reporting a significant association between elevated sd-LDL-c concentrations and the risk of CVD [Citation19]. However, does sd-LDL-c also predict the risk of cardiovascular death in patients with DKD? This question has not been well answered due to a lack of studies designed for DKD patients and the need for advanced techniques for sd-LDL-c assays. Thus, our study tried to fill this gap in the field by utilizing the recent emergence of simple and reliable prediction equations to sd-LDL-c.
The esd-LDL-c calculation is based on standard lipid panel results from least squares regression analysis [Citation21]. The coefficient of determination of esd-LDL-c with directly msd-LDL-c is 0.745 (results from 20,171 people), signifying a close correspondence with the concentrations of esd-LDL-c and msd-LDL-c [Citation21]. Our results also showed that there was a moderate correlation between esd-LDL-c and msd-LDL-c, with a coefficient of determination of 0.521 (n = 30), demonstrating a certain reliability of the formula in the DKD population. Notably, the present results from NHANES showed that esd-LDL-c was associated with cardiovascular mortality and all-cause mortality in people with DM-CKD. Moreover, our cohort study provided pioneering evidence that increased esd-LDL-c was independently associated with the ESKD. In addition, esd-LDL-c potentially forecasted residual kidney risk in patients with DKD, yet LDL-c did not. However, we should point out that the two cohorts studying cardiovascular and kidney outcomes were from different regions. The patients from the biopsy-confirmed DKD cohort were younger, primarily male, ethnically homogeneous, consumed less alcohol, had more proteinuria, and had similar levels of eGFR and HbA1c compared with NHANES DM-CKD cohort. However, people with biopsy-confirmed DKD were a specific population having DM combined with CKD. Furthermore, they were grouped according to the same cutoff values for esd-LDL-c, with multifactorial regression in multiple models correcting for critical factors like demographics, HbA1c, hypertension, proteinuria, CKD classification, etc. Therefore, the results were relatively reliable in the small sample of this study. However, extrapolation to larger groups requires caution.
Studies on esd-LDL-c have been reported in different disease areas. Ichikawa et al. analyze data from 120,613 individuals participating in a medical health screening program at Panasonic Corporation in Osaka, Japan, and demonstrate that esd-LDL-c (>35.9 mg/dL) is a better predictor for the incidence of diabetes at 10 years than other lipid profiles [Citation22]. Huang et al. also reported that esd-LDL-c is positively associated with the risk of developing nonalcoholic fatty liver disease (NAFLD) in a non-obese population, whereas LDL-c is not [Citation32]. The fourth quartile (43.21 (7.51), mean (standard deviation)) is associated with a 2.93-fold increased risk of NAFLD (n = 7540) [Citation32]. Sorokin et al. discovered that esd-LDL-c is more strongly associated with high-risk features of coronary atherosclerotic plaques in psoriasis patients (75 people with 210 coronary arteries) [Citation33]. In contrast, no correlation exists for LDL-c [Citation33]. Sampson et al. reported that the general population-based data from the Multi-Ethnic Study of Atherosclerosis (MESA, n = 5690) show that esd-LDL-c (1.28 (1.18–1.38), HR 95% CI) is better at predicting ASCVD events than LDL-c (1.18 (1.09–1.28), HR 95% CI), total cholesterol (1.15 (1.06–1.25), HR 95% CI), and even better than direct msd-LDL-c (1.14 (1.03–1.25), HR 95% CI) [Citation21]. However, Schaefer et al. performed a pooling project showing that direct Denka-msd-LDL-c is correlated better with ASCVD risk than esd-LDL-c (n = 15,933) [Citation34]. In conclusion, esd-LDL-c has the potential to predict residual risk beyond LDL-c and is more convenient and economical. However, additional research is needed on whether esd-LDL-c or msd-LDL-c is better for predicting risk.
Our findings also indicate that elevated levels of esd-LDL-c were not consistently associated with higher eGFR (r = 0, p = .998 in the DKD cohort; r = 0.25, p < .001 in the NHANES DM-CKD cohort), but always intimately related to more proteinuria. There are also discrepancies in the previous kidney disease observations. Cross-sectional research involving 44 individuals with CKD has revealed that higher sd-LDL levels are associated with advanced CKD stages [Citation18]. In a recent cross-sectional study with 1073 DKD patients, sd-LDL-c is obviously higher in the higher eGFR groups, and higher albuminuria levels are associated with elevated sd-LDL-c to LDL-c ratio [Citation35]. These results are likely due to lower hepatic triglyceride lipase (HTGL) activity in patients with advanced CKD. HTGL is also crucial for converting TG-rich lipoprotein to sd-LDL [Citation36]. Thus, changes in HTGL activity may lead to a complex correlation between sd-LDL and eGFR. Furthermore, nephrotic syndrome is related to increased anabolism and reduced catabolism of LDL-c, resulting in increased LDL-c levels as well as an increase in sd-LDL-c [Citation37]. This partly explains the association of proteinuria with sd-LDL-c.
The specific biophysical and biochemical atherogenic properties of sd-LDL-c [Citation38] make it potentially crucial for cardiovascular and kidney outcomes in DKD. sd-LDL-c has a longer half-life in plasma and can be absorbed more easily by arterial tissue due to its reduced LDL receptor affinity and smaller particles [Citation39]. Moreover, sd-LDL-c is more susceptible to various atherogenic modifications, including dehydrogenation, glycosylation, and oxidation, which have potential inflammation-inducing effects [Citation11]. Whereas the association between sd-LDL-c and DKD is less clarified, the development of DKD and atherosclerosis appears to share some pathophysiological mechanisms like endothelial cell injury, macrophage infiltration, hyperlipoproteinemia, and hypertension [Citation40]. Additionally, lipoproteins are deposited into the mesangium through the damaged endothelial cells and glomerular basement membrane [Citation41]. Consequently, their deposition stimulates activation and proliferation of the mesangial cell, similar to smooth muscle cell proliferation in atherosclerosis [Citation42]. Mesangial cells release chemokines and express adhesion molecules, which recruit monocytes to the mesangium [Citation43]. Monocytes are then transformed into resident macrophages and secrete proinflammatory mediators [Citation44]. Furthermore, oxidized LDL, though not explicitly oxidized sd-LDL, exerts cytotoxic, proinflammatory, and immunogenic properties by inducing apoptosis, producing superoxide and cytokines, and generating a number of neo-self-determinants to elicit immune responses [Citation45–47]. The present study observed the correlation between higher esd-LDL-c levels and more severe interstitial inflammation, which these underlying mechanisms could elucidate.
The strength of our study is that it first revealed the potential of esd-LDL-c as a predictor of ESKD risk. Additionally, the use of multiple models to correct for significant confounders made the results more reliable.
Indeed, our study has some noted limitations. First, our cohort consisted of individuals with kidney biopsy-confirmed DKD in a single-center setting, with follow-ups focused primarily on kidney outcomes. However, we supplemented our findings by utilizing the NHANES database to explore CVD mortality and all-cause mortality in people with DM-CKD, thereby enhancing the comprehensiveness of our study. However, CVD mortality was defined according to the ICD-10, and cause-of-death coding based on physicians’ level of medical care was somewhat subjective. Second, given that the evidence for kidney and cardiovascular outcomes originated from different populations, caution should be taken when extrapolating the conclusions to other ethnicities and diverse diagnostic modalities in DKD patients. Additionally, the relationship of the formula esd-LDL-c to sd-LDL-c had not been fully validated. Still, the potential residual risk-predicting ability of esd-LDL-c warranted investigation. Next, factors such as family history of diabetes or hyperlipidemia and diet were not accounted for in this study. Last, the study was constrained by a limited sample size. As such, the small sample size restricted the feasibility of conducting subgroup analyses with multifactorial adjustment. Therefore, larger cohorts with more adequate blood samples and more complete data collection are needed for further research.
5. Conclusions
In summary, our study identified an association between increased esd-LDL-c levels and the progression of DKD characterized by severe proteinuria, interstitial renal inflammation, and development of ESKD in individuals with confirmed DKD via kidney biopsy. Furthermore, among patients with DM-CKD, higher esd-LDL-c levels were associated with increased risk of cardiovascular mortality and all-cause mortality. The application of the esd-LDL-c formula holds promise in identifying individuals with residual kidney and cardiovascular risk for high esd-LDL-c levels, particularly among those with low LDL-c levels.
Author contributions
F.L. and Q.Y. designed the study. Q.Y., Y.Z., Y.L., J.Y., Y.W., X.X., C.Q., and Y.Z. contributed to patient follow-up and data collection. Q.Y. and Y.Z. participated in the data analysis. Q.Y. drafted the manuscript. F.L. supervised and advised the entire procedure and was in charge of the manuscript review and editing. All authors have read and agreed to the final manuscript.
Ethical approval
For the DKD cohort from West China Hospital, the study design received approval from the ethics committee of West China Hospital, Sichuan University (Ethical number 20231143).
Consent form
All individuals provided written informed consent. For NHANES, the protocol was approved by the National Center for Health Statistics Ethics Review Board, and written informed consent was obtained from all participants.
Supplemental Material
Download MS Word (3 MB)Acknowledgements
We thank the NHANES personnel for allowing us access to high-quality data for our clinical study. We also thank AiMi Academic Services (www.aimieditor.com) for English language editing and review services.
Disclosure statement
No potential conflict of interest was reported by the author(s).
Additional information
Funding
References
- International Diabetes Federation. IDF Diabetes Atlas. 10th ed. Brussels, Belgium: International Diabetes Federation; 2021.
- American Diabetes Association Professional Practice Committee. 11. Chronic kidney disease and risk management: standards of medical care in Diabetes—2022. Diabetes Care. 2022;45(Suppl. 1):S175–S184. doi: 10.2337/dc22-S011.
- Kidney Disease: Improving Global Outcomes (KDIGO) Diabetes Work Group. KDIGO 2020 clinical practice guideline for diabetes management in chronic kidney disease. Kidney Int. 2020;98(4S):S1–S115. doi: 10.1016/j.kint.2020.06.019.
- de Boer IH, Khunti K, Sadusky T, et al. Diabetes management in chronic kidney disease: a consensus report by the American Diabetes Association (ADA) and Kidney Disease: Improving Global Outcomes (KDIGO). Kidney Int. 2022;102(5):974–989. doi: 10.1016/j.kint.2022.08.012.
- Thomas MC, Brownlee M, Susztak K, et al. Diabetic kidney disease. Nat Rev Dis Primers. 2015;1(1):15018. doi: 10.1038/nrdp.2015.18.
- Pérez-López L, Boronat M, Melián C, et al. Animal models and renal biomarkers of diabetic nephropathy. In: Islam MdS, editor. Diabetes: from research to clinical practice. Advances in experimental medicine and biology. Vol. 1307. Cham: Springer International Publishing; 2020. p. 521–551. doi: 10.1007/5584_2020_527.
- Opazo-Ríos L, Mas S, Marín-Royo G, et al. Lipotoxicity and diabetic nephropathy: novel mechanistic insights and therapeutic opportunities. Int J Mol Sci. 2020;21(7):2632. doi: 10.3390/ijms21072632.
- Thongnak L, Pongchaidecha A, Lungkaphin A. Renal lipid metabolism and lipotoxicity in diabetes. Am J Med Sci. 2020;359(2):84–99. doi: 10.1016/j.amjms.2019.11.004.
- Grundy SM, Stone NJ, Bailey AL, et al. 2018 AHA/ACC/AACVPR/AAPA/ABC/ACPM/ADA/AGS/APhA/ASPC/NLA/PCNA guideline on the management of blood cholesterol: a report of the American College of Cardiology/American Heart Association Task Force on clinical practice guidelines. J Am Coll Cardiol. 2019;73(24):e285–e350. doi: 10.1016/j.jacc.2018.11.003.
- Superko HR, King S. Lipid management to reduce cardiovascular risk: a new strategy is required. Circulation. 2008;117(4):560–568; discussion 568. doi: 10.1161/CIRCULATIONAHA.106.667428.
- Carmena R, Duriez P, Fruchart J-C. Atherogenic lipoprotein particles in atherosclerosis. Circulation. 2004;109(23 Suppl. 1):III2–III7. doi: 10.1161/01.CIR.0000131511.50734.44.
- Hoogeveen RC, Gaubatz JW, Sun W, et al. Small dense low-density lipoprotein-cholesterol concentrations predict risk for coronary heart disease: the Atherosclerosis Risk In Communities (ARIC) study. Arterioscler Thromb Vasc Biol. 2014;34(5):1069–1077. doi: 10.1161/ATVBAHA.114.303284.
- Austin MA, Breslow JL, Hennekens CH, et al. Low-density lipoprotein subclass patterns and risk of myocardial infarction. JAMA. 1988;260(13):1917–1921. doi: 10.1001/jama.1988.03410130125037.
- Gardner CD, Fortmann SP, Krauss RM. Association of small low-density lipoprotein particles with the incidence of coronary artery disease in men and women. JAMA. 276(11):875–881.
- St-Pierre AC, Cantin B, Dagenais GR, et al. Low-density lipoprotein subfractions and the long-term risk of ischemic heart disease in men: 13-year follow-up data from the Québec Cardiovascular Study. Arterioscler Thromb Vasc Biol. 2005;25(3):553–559. doi: 10.1161/01.ATV.0000154144.73236.f4.
- Higashioka M, Sakata S, Honda T, et al. Small dense low-density lipoprotein cholesterol and the risk of coronary heart disease in a Japanese community. J Atheroscler Thromb. 2020;27(7):669–682. doi: 10.5551/jat.51961.
- Balling M, Nordestgaard BG, Langsted A, et al. Small dense low-density lipoprotein cholesterol predicts atherosclerotic cardiovascular disease in the Copenhagen General Population Study. J Am Coll Cardiol. 2020;75(22):2873–2875. doi: 10.1016/j.jacc.2020.03.072.
- Filler G, Taheri S, McIntyre C, et al. Chronic kidney disease stage affects small, dense low-density lipoprotein but not glycated low-density lipoprotein in younger chronic kidney disease patients: a cross-sectional study. Clin Kidney J. 2018;11(3):383–388. doi: 10.1093/ckj/sfx115.
- Shen H, Xu Y, Lu J, et al. Small dense low-density lipoprotein cholesterol was associated with future cardiovascular events in chronic kidney disease patients. BMC Nephrol. 2016;17(1):143. doi: 10.1186/s12882-016-0358-8.
- Hung C-C, Tsai J-C, Kuo H-T, et al. Dyslipoproteinemia and impairment of renal function in diabetic kidney disease: an analysis of animal studies, observational studies, and clinical trials. Rev Diabet Stud. 2013;10(2–3):110–120. doi: 10.1900/RDS.2013.10.110.
- Sampson M, Wolska A, Warnick R, et al. A new equation based on the standard lipid panel for calculating small dense low-density lipoprotein-cholesterol and its use as a risk-enhancer test. Clin Chem. 2021;67(7):987–997. doi: 10.1093/clinchem/hvab048.
- Ichikawa T, Okada H, Hamaguchi M, et al. Estimated small dense low-density lipoprotein-cholesterol and incident type 2 diabetes in Japanese people: population-based Panasonic cohort study 13. Diabetes Res Clin Pract. 2023;199:110665. doi: 10.1016/j.diabres.2023.110665.
- American Diabetes Association. 2. Classification and diagnosis of diabetes: standards of medical care in diabetes-2018. Diabetes Care. 2018;41(Suppl. 1):S13–S27. doi: 10.2337/dc18-S002.
- Tervaert TWC, Mooyaart AL, Amann K, et al. Pathologic classification of diabetic nephropathy. J Am Soc Nephrol. 2010;21(4):556–563. doi: 10.1681/ASN.2010010010.
- NHANES – NCHS Research Ethics Review Board Approval [cited 2023 Jun 21]; 2023 [Online]. Available from: https://www.cdc.gov/nchs/nhanes/irba98.htm
- Levey AS, Stevens LA, Schmid CH, et al. A new equation to estimate glomerular filtration rate. Ann Intern Med. 2009;150(9):604–612. doi: 10.7326/0003-4819-150-9-200905050-00006.
- Kulkarni KR. Cholesterol profile measurement by vertical auto profile method. Clin Lab Med. 2006;26(4):787–802. doi: 10.1016/j.cll.2006.07.004.
- Lindgren FT, Elliott HA, Gofman JW. The ultracentrifugal characterization and isolation of human blood lipids and lipoproteins, with applications to the study of atherosclerosis. J Phys Colloid Chem. 1951;55(1):80–93. doi: 10.1021/j150484a010.
- Williams PT, Zhao X-Q, Marcovina SM, et al. Levels of cholesterol in small LDL particles predict atherosclerosis progression and incident CHD in the HDL-Atherosclerosis Treatment Study (HATS). PLOS One. 2013;8(2):e56782. doi: 10.1371/journal.pone.0056782.
- Ikezaki H, Lim E, Cupples LA, et al. Small dense low-density lipoprotein cholesterol is the most atherogenic lipoprotein parameter in the Prospective Framingham Offspring Study. J Am Heart Assoc. 2021;10(5):e019140. doi: 10.1161/JAHA.120.019140.
- Sakai K, Koba S, Nakamura Y, et al. Small dense low-density lipoprotein cholesterol is a promising biomarker for secondary prevention in older men with stable coronary artery disease. Geriatr Gerontol Int. 2018;18(6):965–972. doi: 10.1111/ggi.13287.
- Huang H, Xie J, Hou L, et al. Estimated small dense low-density lipoprotein cholesterol and nonalcoholic fatty liver disease in nonobese populations. J Diabetes Investig. 2023;15(4):491–499. doi: 10.1111/jdi.14133.
- Sorokin AV, Patel N, Li H, et al. Estimated sdLDL-C for predicting high-risk coronary plaque features in psoriasis: a prospective observational study. Lipids Health Dis. 2023;22(1):55. doi: 10.1186/s12944-023-01819-x.
- Schaefer EJ, Ikezaki H, Diffenderfer MR, et al. Atherosclerotic cardiovascular disease risk and small dense low-density lipoprotein cholesterol in men, women, African Americans and non-African Americans: the pooling project. Atherosclerosis. 2023;367:15–23. doi: 10.1016/j.atherosclerosis.2023.01.015.
- Hirano T, Satoh N, Kodera R, et al. Dyslipidemia in diabetic kidney disease classified by proteinuria and renal dysfunction: a cross-sectional study from a regional diabetes cohort. J Diabetes Investig. 2022;13(4):657–667. doi: 10.1111/jdi.13697.
- Oi K, Hirano T, Sakai S, et al. Role of hepatic lipase in intermediate-density lipoprotein and small, dense low-density lipoprotein formation in hemodialysis patients. Kidney Int Suppl. 1999;71:S227–S228. doi: 10.1046/j.1523-1755.1999.07159.x.
- Farbakhsh K, Kasiske BL. Dyslipidemias in patients who have chronic kidney disease. Med Clin North Am. 2005;89(3):689–699. doi: 10.1016/j.mcna.2004.11.002.
- Ivanova EA, Myasoedova VA, Melnichenko AA, et al. Small dense low-density lipoprotein as biomarker for atherosclerotic diseases. Oxid Med Cell Longev. 2017;2017:1273042. doi: 10.1155/2017/1273042.
- Berneis KK, Krauss RM. Metabolic origins and clinical significance of LDL heterogeneity. J Lipid Res. 2002;43(9):1363–1379. doi: 10.1194/jlr.r200004-jlr200.
- Diamond JR, Karnovsky MJ. Focal and segmental glomerulosclerosis: analogies to atherosclerosis. Kidney Int. 1988;33(5):917–924. doi: 10.1038/ki.1988.87.
- Zatz R, Meyer TW, Rennke HG, et al. Predominance of hemodynamic rather than metabolic factors in the pathogenesis of diabetic glomerulopathy. Proc Natl Acad Sci U S A. 1985;82(17):5963–5967. doi: 10.1073/pnas.82.17.5963.
- Kasiske BL, O'Donnell MP, Schmitz PG, et al. Renal injury of diet-induced hypercholesterolemia in rats. Kidney Int. 1990;37(3):880–891. doi: 10.1038/ki.1990.62.
- Hattori M, Nikolic-Paterson DJ, Miyazaki K, et al. Mechanisms of glomerular macrophage infiltration in lipid-induced renal injury. Kidney Int Suppl. 1999;71:S47–S50. doi: 10.1046/j.1523-1755.1999.07112.x.
- Guijarro C, Kasiske BL, Kim Y, et al. Early glomerular changes in rats with dietary-induced hypercholesterolemia. Am J Kidney Dis. 1995;26(1):152–161. doi: 10.1016/0272-6386(95)90169-8.
- Heeringa P, Tervaert JWC. Role of oxidized low-density lipoprotein in renal disease. Curr Opin Nephrol Hypertens. 2002;11(3):287–293. doi: 10.1097/00041552-200205000-00004.
- Nosadini R, Tonolo G. Role of oxidized low density lipoproteins and free fatty acids in the pathogenesis of glomerulopathy and tubulointerstitial lesions in type 2 diabetes. Nutr Metab Cardiovasc Dis. 21(2):79–85.
- Chen H-C, Guh J-Y, Shin S-J, et al. Pravastatin suppress superoxide and fibronectin production of glomerular mesangial cells induced by oxidized-LDL and high glucose. Atherosclerosis. 160(1):141–146.