
 ?Mathematical formulae have been encoded as MathML and are displayed in this HTML version using MathJax in order to improve their display. Uncheck the box to turn MathJax off. This feature requires Javascript. Click on a formula to zoom.
Abstract
Background
Immune and inflammatory factors are considered the basic underlying mechanisms of IgA nephropathy (IgAN). The systemic immune inflammation index (SII) is a new inflammatory biomarker and has been identified as a prognostic indicator for various diseases. However, limited studies have been conducted on the prognostic value of the SII in patients with IgAN, and we aimed to address this gap.
Methods
A total of 374 patients with IgAN confirmed by renal biopsy performed from 1 January 2015 to 1 April 2019, were retrospectively included. The follow-up period of all patients was at least 12 months after diagnosis, and the endpoint was defined as end-stage kidney disease (ESKD). Patients were further divided into a high-risk group (SII ≥ 456.21) and a low-risk group (SII < 456.21) based on the optimal cutoff value of the SII determined by receiver operating characteristic (ROC) curve analysis. Baseline clinicopathological parameters were compared between the groups, and Cox proportional hazards analyses and Kaplan–Meier analysis were performed to assess renal survival in IgAN patients.
Results
After a median follow-up period of 32.5 months, a total of 53 patients eventually reached ESKD. Patients in the high-SII group tended to have a lower hemoglobin level (p = 0.032) and eGFR (p < 0.001), a higher serum creatinine level (p = 0.023) and 24-hour total protein level (p = 0.004), more severe tubular atrophy and interstitial fibrosis (p = 0.002) and more crescents (p = 0.030) than did those in the low-SII group. Univariate and multivariate Cox regression analyses demonstrated that an SII ≥456.21 was an independent risk factor for poor renal survival in IgAN patients (HR 3.028; 95% CI 1.486–6.170; p = 0.002). Kaplan–Meier analysis revealed that a high SII was significantly associated with poor renal prognosis (p < 0.001) and consistently exhibited remarkable discriminatory ability across different subgroups in terms of renal survival.
Conclusion
A high SII was associated with more severe baseline clinical and pathological features, and an SII ≥456.21 was an independent risk factor for progression to ESKD in IgAN patients.
1. Introduction
IgA nephropathy (IgAN), also known as Berger disease, is the most common primary glomerulonephritis worldwide, with 30–40% of patients eventually developing end-stage kidney disease (ESKD) within 20–30 years after diagnosis [Citation1], leading to a heavy burden on individuals, families and society. Therefore, the accurate identification of high-risk IgAN patients to reduce the occurrence of ESKD has been a popular topic in current research. The International IgAN Prediction Tool is a well-established and comprehensive statistical model that incorporates various clinical and pathological parameters known to be associated with the prognosis of IgAN, enabling accurate prediction of renal outcomes [Citation2]. Nevertheless, further exploration of novel prognostic markers for IgAN is still necessary.
The pathogenesis of IgAN is not fully understood, but immune and inflammatory mechanisms are widely recognized [Citation3, Citation4]. The systemic immune inflammation index (SII), derived from the equation (platelet count*neutrophil count)/lymphocyte count [Citation5–8], is a novel inflammatory marker with parameters obtained through simple blood examination. Previous studies have reported the prognostic value of the SII in various diseases, such as cardiovascular diseases, cerebrovascular diseases and various solid tumors [Citation5–8]. In addition, the SII has been proven to be a reliable indicator for predicting nonremission in patients with low- and moderate-risk idiopathic membranous nephropathy [Citation9]. However, to our knowledge, the potential of the SII to predict adverse renal outcomes in IgAN patients has not been investigated. Thus, this study aimed to address this gap.
2. Materials and methods
2.1. Study population
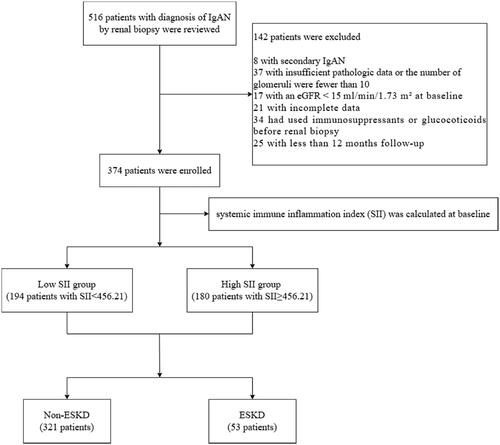
The clinical data of 374 patients who were diagnosed with primary IgAN by renal biopsy between 1 January 2015 and 1 April 2019, at the First Affiliated Hospital of Zhengzhou University were collected for this study. The diagnostic criteria were based on the presence of IgA deposits in the glomerular mesangium as determined by immunofluorescence detection and the presence of electron dense substances in the mesangium as determined by ultrastructural examination. The inclusion criteria were as follows: (1) primary IgAN was diagnosed by pathological examination of renal biopsy tissue; (2) the follow-up time was more than 12 months; and (3) the initial estimated glomerular filtration rate (eGFR) was ≥15 mL/min/1.73 m2 at the time of renal biopsy. The exclusion criteria were as follows: (1) did not have IgAN, such as membranous nephropathy or membranous proliferative glomerulonephritis; (2) had secondary IgAN, including IgAN secondary to chronic hepatitis B, allergic purpura, ankylosing spondylitis, systemic lupus erythematosus or rheumatoid arthritis; (3) had <10 glomeruli in renal biopsy specimens; (4) had an eGFR <15 mL/min/1.73 m2 at the time of renal biopsy; (5) had incomplete clinical data; and (6) had used immunosuppressants or glucocorticoids before renal biopsy. The study flow chart is shown in .
Figure 1. The flow chart of the study.
The study protocol was approved by the Ethics Review Committee of the First Affiliated Hospital of Zhengzhou University. The requirement to obtain informed consent was waived due to the retrospective and fully anonymized nature of the data.
2.2. Demographic and clinical data collection
Baseline demographic and laboratory data of patients at the time of renal biopsy were collected, including age, sex, hypertension status (yes or no), hemoglobin (Hb), serum creatinine (sCr), estimated glomerular filtration rate (eGFR), uric acid (UA), albumin (ALB), total cholesterol (TCHO), triglyceride (TG), 24-h total urine protein (24 h-UTP), and urine red blood cell (URBC) levels. The equation to calculate the SII was (platelet count*neutrophil count)/lymphocyte count.
2.3. Pathological data
The renal biopsy specimens of all patients were examined through the use of light microscopy, immunohistochemistry and electron microscopy. The Oxford classification (MEST-C) was used to score each patient’s condition: mesangial hypercellularity (M0/M1), endocapillary hypercellularity (E0/E1), segmental glomerulosclerosis (S0/S1), tubular atrophy and interstitial fibrosis (T0/T1/T2), and crescents (C0/C1/C2).
2.4. International IgAN prediction tool
The International IgAN Prediction Tool was used to calculate the risk of progression to ESKD in IgAN patients at 3 years after renal biopsy. The risk equations, based on readily available clinical and pathological predictor variables, were derived from a large international multiethnic cohorts including 3927 patients and were shown to be accurate and validated methods for predicting disease progression in IgAN [Citation2].
2.5. Follow-up and study outcomes
All data were retrospectively collected from the time of IgAN diagnosis to May 2024 and all patients were followed up at the outpatient/inpatient department of the First Affiliated Hospital of Zhengzhou University or via telephone for at least 12 months. The study endpoint was ESKD, defined as an eGFR <15 mL/min/1.73 m2 or the initiation of renal replacement therapy. For those patients who did not progress to the endpoint, the follow-up period ended on the date of their last outpatient/inpatient appointment or telephone follow-up. During the entire follow-up period, there were no reported deaths among the patients.
2.6. Statistical analysis
All the statistical analyses were performed using SPSS 25 and R statistical software (version 4.2.1; http://www.R-project.org). p Values less than 0.05 were regarded as significant. The quantitative variables with a normal distribution are presented as the mean ± standard deviation (). Based on the homogeneity of variance, t tests or corrected t tests were used for comparisons between two groups. Nonnormally distributed quantitative variables are presented as medians and quartiles [median (Q1, Q3)], and the Wilcoxon rank sum test was used for two-group comparisons. The categorical variables are presented as frequencies and percentages [n (%)], and the chi-square test was used for two-group comparisons. Receiver operating characteristic (ROC) curve analysis was used to assess the sensitivity and specificity of the SII for predicting ESKD. The Youden index was used to identify the optimal cutoff values. Correlation tests were conducted to investigate the associations between the SII and other key clinicopathological indicators. Univariate and multivariate Cox proportional hazards analyses were performed to assess the impact of the SII on renal progression and prognosis. The variance inflation factor (VIF) was used to identify potential collinearity between variables, and it was considered that high multicollinearity existed between independent variables when the VIF was ≥10. Cumulative renal survival curves were constructed using the Kaplan–Meier method, and the log-rank test was utilized to compare the differences between two groups. Finally, binary logistic regression model was used to analyze the independent risk factors affecting the risk of early progression to ESKD at 3 years.
3. Results
3.1. Comparison of baseline characteristics between patients in the non-ESKD and ESKD groups
A total of 374 patients were included in the present study. The median follow-up time of all patients was 32.5 (18, 61) months, the median age was 33 (25, 44) years, and 52.7% of the patients were male. As shown in , 53 patients were eventually diagnosed with ESKD. Compared with those in the non-ESKD group, patients in the ESKD group had a higher incidence of hypertension; lower Hb and eGFR levels; higher sCr, UA, 24 h-UTP, and URBC levels; greater E, S, and T scores; and less use of ACEIs or ARBs (all p values < 0.05). In addition, the SII in the ESKD group (602.31 (474.53, 865.34)) was significantly higher than that in the non-ESKD group (426.26 (282.17, 636.68)) (p < 0.001).
Table 1. Comparison of baseline demographic, clinical, and pathological data between patients in the non-ESKD and ESKD groups.
3.2. Comparison of baseline characteristics and prognoses between patients in the low-SII and high-SII groups
ROC curve analysis showed that the optimal cutoff value of the SII for predicting ESKD was 456.21, with 79.2% sensitivity and 57.0% specificity (). Then, patients were divided into a high SII group (≥456.21) and a low SII group (<456.21) based on the optimal cutoff value, and those who reached ESKD were found to have a greater proportion of patients with a high SII (70.7 vs. 42.3%, p < 0.001) (). As shown in , compared with those in the low-SII group, patients in the high-SII group had a lower Hb level and eGFR, a higher sCr 24h-UTP level, more severe tubular atrophy and interstitial fibrosis, more crescents and more patients who progressed to ESKD (all p < 0.05).
Figure 2. ROC curve of the SII for predicting ESKD in IgAN patients.
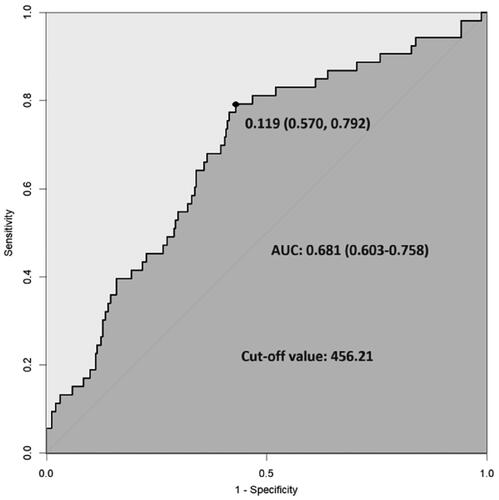
Figure 3. Comparison of ESKD rates according to the SII.
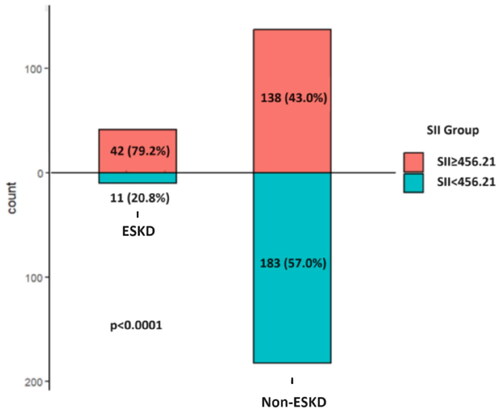
Table 2. Comparison of baseline demographic, clinical, and pathological data between patients in the low-SII and high-SII groups.
3.3. Correlation of the SII with key clinicopathological indicators
Correlation analyses were conducted to examine the associations between the SII and key clinicopathological indicators. The results showed that the SII was significantly correlated with sCr (r = 0.149, p = 0.004), eGFR (r = −0.178, p < 0.001), 24 h-UTP (r = 0.184, p < 0.001), URBC (r = 0.123, p = 0.017), E (r = 0.106, p = 0.04), T (r = 0.147, p = 0.004), and C (r = 0.142, p = 0.006).
3.4. The SII is an independent risk factor for the progression of IgAN to ESKD
As shown in , univariate Cox regression analysis revealed that an SII ≥456.21 was a risk factor for progression to ESKD (HR 4.943; 95% CI 2.541–9.615; p < 0.001). Multivariate Cox regression analysis, incorporating all parameters with a p-value less than 0.05 from the univariate analysis, indicated that an SII ≥456.21 was an independent risk factor for the progression of ESKD (HR 3.028; 95% CI 1.486–6.170; p = 0.002). In addition, the collinearity between those variables included in the multivariate Cox regression was low, with a mean VIF of 1.361. The Kaplan–Meier survival curve suggested a significant association between a high SII (>456.21) and poor renal survival in IgAN patients (p < 0.001) (). In addition, subgroup analysis was conducted to assess the ability of the SII to predict renal survival across different subgroups. Our results revealed that regardless of sex (), eGFR ≥ 60 mL/min/1.73 m2 (), 24 h-UTP ≥ 1 g (), use of immunosuppressants or glucocorticoids (), or the use of ACEIs or ARBs (), patients with an SII ≥456.21 consistently exhibited significantly poorer renal survival than those with an SII <456.21.
Figure 4. Kaplan–Meier survival curves of the SII in different subgroups according to sex, baseline eGFR, baseline 24-h UTP, use of immunosuppressants or glucocorticoids, and use of ACEIs/ARBs.
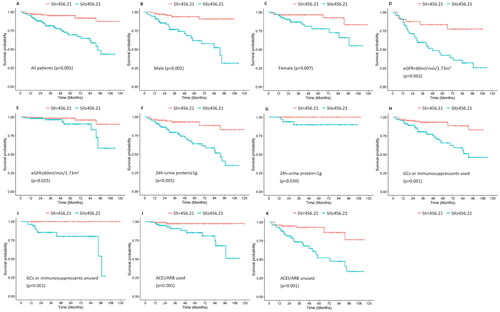
Table 3. Univariate and multivariate Cox regression analyses of renal survival in patients with IgAN.
3.5. The SII and international IgAN prediction score as predictors of progression to ESKD
The International IgAN Prediction tool was used to calculate the risk score for ESKD progression 3 years after renal biopsy, in a subpopulation that included patients who had more than 3 years of follow-up and those who had reached ESKD before the end of the 3 years (n = 204). The analysis revealed that the risk score was significantly higher in the high-SII group [4.22, (1.31, 13.14)] compared to the low-SII group [1.35, (0.91, 3.63)] (p < 0.001). Furthermore, binary logistic regression analysis showed that the risk score (OR 1.241; 95% CI 1.165–1.321; p < 0.001) and an SII ≥ 456.21 (OR 6.664; 95% CI 3.173–13.996; p < 0.001) were individually associated with a higher risk of progression within the first 3 years of follow-up. Notably, even after adjusting for the risk score (OR 1.225; 95% CI 1.148–1.306; p < 0.001), an SII ≥ 456.21 (OR 4.611; 95% CI 1.908–11.144; p < 0.001) remained significantly associated with an increased risk of early progression to ESKD.
4. Discussion
The immune and inflammatory mechanisms of IgA nephropathy have been widely acknowledged. Previous studies revealed that chronic inflammation is mainly observed in the kidneys of patients with IgAN. After the deposition of immune complexes consisting of Gd-IgA1 and anti-glycan autoantibodies in the mesangial compartment, mesangial cells immediately proliferate and produce excess mesangial matrix. Mesangial cell-derived cytokines, such as IL-6 and TGF-β, stimulate leukocytes to promote inflammatory cascades and lead to the apoptosis of mesangial cells, podocytes, and tubular epithelial cells [Citation10–14]. These cytokines are involved in the activation of leukocytes, which, in turn, contribute to further production of these cytokines and lead to the amplification of the renal inflammatory process [Citation15, Citation16]. Moreover, activated leukocytes can release superoxide radicals and proteases [Citation17], all of which promote oxidative stress and lead to further renal injury and decreased renal function. However, systemic inflammation in IgAN has rarely received attention. Severe hematuria is often associated with acute respiratory or gastrointestinal infections, which suggests that mucosal infection is one of the potentially crucial pathogeneses of systemic inflammation. Budesonide is an intestinal targeting hormone that can induce sustained release of corticosteroids to the distal ileum. In a double-blind placebo-controlled trial [Citation18], proteinuria in patients with primary IgAN continued to decrease 3 months after receiving budesonide treatment, which confirmed the relationship between mucosal inflammation and IgAN. Another potential possibility is systemic complement activation. One study revealed that systemic complement activation, particularly increased plasma levels of actC3 (neoantigens developing after C3 activation on breakdown products), could be detected in approximately one-third of patients with IgAN [Citation19]. The activation of complement then leads to the production of C3a and C5a and the mediation of many inflammatory reactions [Citation14]. Therefore, all of the evidence shows that IgAN patients are in an inflammatory state, whether that be local inflammation of the kidneys or systemic inflammation in the circulation.
Leukocytes play a vital role in inflammatory processes [Citation20]. Among the leukocyte subtypes, neutrophils are essential mediators of immune defense and can secrete many inflammatory mediators and cytokines. Their short half-life is related to the acute inflammatory response to tissue damage. Previous study findings revealed that polymeric IgA, when bound to FcαRI, induces a series of inflammatory responses, including antigen presentation, phagocytosis, the promotion of antibody-dependent cytotoxicity, the release of inflammatory mediators and cytokines, and the production of reactive oxygen species [Citation21]. Due to the abnormal glycosylation of IgA1 and the impaired salivary liquefaction of FcαRI in IgAN patients, FcαRI is highly expressed on neutrophils, which leads to proinflammatory and anti-inflammatory imbalances [Citation22]. In addition, an elevated platelet count may indicate heightened thrombocyte activation, which results in increased inflammation and a proclivity toward thrombosis and ultimately contributes to adverse renal outcomes, while lymphocytes serve as vital cellular constituents of the immune response system, playing a primary role in executing nearly all immune functions within the lymphatic system, and a reduction in the lymphocyte count may suggest a dampened immune response [Citation23, Citation24]. The SII simultaneously integrates these three types of cells, and it represents the balance between inflammatory reactions and immune function better and more stably than neutrophil, platelet or lymphocyte counts alone.
Persistent inflammation of the renal parenchyma leads to interstitial fibrosis and tubular atrophy, the main pathological changes of various types of chronic kidney disease (CKD) and the common pathway causing CKD eventually progress [Citation25]. The essence of renal insufficiency is the associated decrease in the eGFR. Our findings revealed that patients with a high SII tend to have lower eGFR levels, mostly under 60 mL/min/1.73 m2 at biopsy time, along with lower Hb and higher sCr and 24 h-UTP levels. These patients often exhibit more severe renal pathologies, particularly renal tubular atrophy, interstitial fibrosis and crescents, and seem to be more predisposed to progressing to ESKD. Furthermore, for the first time, we identified that an SII ≥456.21 is an independent risk factor for the progression of IgAN to ESKD. Notably, ACEIs/ARBs, crucial drugs in the treatment of IgAN, play an important role in reducing proteinuria and protecting renal function [Citation26]. In the present study, only approximately half of the patients received ACEI/ARB therapy, which was significantly lower than the standard treatment rate for IgAN patients globally and may explain the relatively low renal survival of this population. This finding may reflect real-world differences in treatment practice but also may have implications for the results of this study. Nonetheless, subgroup analysis revealed that regardless of whether patients received ACEI/ARB therapy, the SII showed significant differences in predicting the development of ESKD. This finding underscores the fact that the SII, as an independent prognostic indicator, is not affected by specific treatment regimens, further strengthening its significance in the prognostic assessment of IgAN.
This study had certain limitations that need to be considered. First, this was a single-center study with a relatively small sample size, and the use of the same population to estimate the SII cutoff value and perform the Cox analysis may limit the generalizability of our findings. Consequently, it would be necessary to conduct a multicenter study with a larger and more diverse population in the future to fully validate the reliability and accuracy of the SII. Second, the follow-up time was relatively short, especially when considering the study endpoint we used - ESKD. Third, the specificity of the SII for predicting ESKD still needs to be increased, which could be because the SII, an inflammatory biomarker, can be elevated in various disease states, not just in patients with IgAN leading to ESKD. In this study, despite the SII score not exhibiting exceptionally high sensitivity and specificity, it demonstrated a remarkable ability in identifying patients who are predisposed to developing ESKD. This may be attributed to the fact that the SII score, as a comprehensive inflammatory biomarker, effectively reflects the intricate immunological and inflammatory status within IgAN patients. Such a status is likely to be intimately associated with the risk of disease progression to ESKD. After adjustment for the International IgAN Prediction Score, a high SII remained significantly associated with a higher rate of early progression to ESKD. Therefore, future research could explore combining the SII with other biomarkers or clinical indicators to potentially establish a more comprehensive risk assessment model.
5. Conclusion
A high SII is associated with more severe baseline clinical and pathological manifestations in patients with IgAN, and an SII ≥456.21 is a significant and independent risk factor for renal progression to ESKD.
Author contributions
Yaling Zhai: Responsible for the overall design, quality control, and proofreading of the article. Shuaigang Sun: Data analysis and article writing. Wenhui Zhang: Data collection, organization, and verification. Huijuan Tian: Collection and organization of literature. All the authors have read and approved the final manuscript.
Disclosure statement
No potential conflict of interest was reported by the author(s).
Data availability statement
The raw data used in the current study are available from the corresponding author upon reasonable request for noncommercial use.
Additional information
Funding
References
- Lai KN, Tang SC, Schena FP, et al. IgA nephropathy. Nat Rev Dis Primers. 2016;2(1):16001. doi: 10.1038/nrdp.2016.1.
- Barbour SJ, Coppo R, Zhang H, International IgA Nephropathy Network, et al. Evaluating a new international risk-prediction tool in IgA nephropathy. JAMA Intern Med. 2019;179(7):942–952. doi: 10.1001/jamainternmed.2019.0600.
- Rauen T, Floege J. Inflammation in IgA nephropathy. Pediatr Nephrol. 2017;32(12):2215–2224. doi: 10.1007/s00467-017-3628-1.
- Barratt J, Alice CS, Karen M, et al. Immunopathogenesis of IgAN. Semin Immunopathol. 2007;29(4):427–443. doi: 10.1007/s00281-007-0089-9.
- Geraghty JR, Lung TJ, Hirsch Y, et al. Systemic immune-inflammation index predicts delayed cerebral vasospasm after aneurysmal subarachnoid hemorrhage. Neurosurgery. 2021;89(6):1071–1079. doi: 10.1093/neuros/nyab354.
- Engin M, Aydin U, Caran Karaoglu EH, et al. A simple predictive marker of inflammation: systemic immune-inflammation index. J Artif Organs. 2023;26(3):251–252. doi: 10.1007/s10047-022-01361-0.
- Kars A, Sahin A, Kılıc K, et al. Systemic immune inflammation index in differentiated thyroid cancers. Acta Otorhinolaryngol Ital. 2022;42(2):150–154. doi: 10.14639/0392-100X-N1665.
- Chen JH, Zhai ET, Yuan YJ, et al. Systemic immune-inflammation index for predicting prognosis of colorectal cancer. World J Gastroenterol. 2017;23(34):6261–6272. doi: 10.3748/wjg.v23.i34.6261.
- Kazan DE, Kazan S. Systemic immune inflammation index and pan-immune inflammation value as prognostic markers in patients with idiopathic low and moderate risk membranous nephropathy. Eur Rev Med Pharmacol Sci. 2023;27(2):642–648. doi: 10.26355/eurrev_202301_31065.
- Magistroni R, D’Agati VD, Appel GB, et al. New developments in the genetics, pathogenesis, and therapy of IgA nephropathy. Kidney Int. 2015;88(5):974–989. doi: 10.1038/ki.2015.252.
- Leung JCK, Lai KN, Tang SCW. Role of mesangial-podocytic-tubular cross-talk in IgA nephropathy. Semin Nephrol. 2018;38(5):485–495. doi: 10.1016/j.semnephrol.2018.05.018.
- Zhang Y, Yan X, Zhao T, et al. Targeting C3a/C5a receptors inhibits human mesangial cell proliferation and alleviates immunoglobulin A nephropathy in mice. Clin Exp Immunol. 2017;189(1):60–70. doi: 10.1111/cei.12961.
- Mathern DR, Heeger PS. Molecules great and small: the complement system. Clin J Am Soc Nephrol. 2015;10(9):1636–1650. doi: 10.2215/CJN.06230614.
- Tortajada A, Gutierrez E, Pickering MC, et al. The role of complement in IgA nephropathy. Mol Immunol. 2019;114:123–132. doi: 10.1016/j.molimm.2019.07.017.
- Jaillon S, Galdiero MR, Del Prete D, et al. Neutrophils in innate and adaptive immunity. Semin Immunopathol. 2013;35(4):377–394. doi: 10.1007/s00281-013-0374-8.
- Feng JF, Huang Y, Chen QX. Preoperative platelet lymphocyte ratio (PLR) is superior to neutrophil lymphocyte ratio (NLR) as a predictive factor in patients with esophageal squamous cell carcinoma. World J Surg Oncol. 2014;12(1):58. doi: 10.1186/1477-7819-12-58.
- Kedziora-Kornatowska KZ. Production of superoxide and nitric oxide by granulocytes in non-insulin-dependent diabetic patients with and without diabetic nephropathy. IUBMB Life. 1999;48(3):359–362. doi: 10.1080/713803522.
- Fellström BC, Barratt J, Cook H, NEFIGAN Trial Investigators., et al. Targeted-release budesonide versus placebo in patients with IgA nephropathy (NEFIGAN): a double-blind, randomised, placebo-controlled phase 2b trial. Lancet. 2017;389(10084):2117–2127. doi: 10.1016/S0140-6736(17)30550-0.
- Zwirner J, Burg M, Schulze M, et al. Activated complement C3: a potentially novel predictor of progressive IgA nephropathy. Kidney Int. 1997;51(4):1257–1264. doi: 10.1038/ki.1997.171.
- Qin B, Ma N, Tang Q, et al. Neutrophil to lymphocyte ratio (NLR) and platelet to lymphocyte ratio (PLR) were useful markers in assessment of inflammatory response and disease activity in SLE patients. Mod Rheumatol. 2016;26(3):372–376. doi: 10.3109/14397595.2015.1091136.
- Monteiro RC, Van De Winkel JG. IgA Fc receptors. Annu Rev Immunol. 2003;21(1):177–204. doi: 10.1146/annurev.immunol.21.120601.141011.
- Perše M, Večerić-Haler Ž. The role of IgA in the pathogenesis of IgA nephropathy. Int J Mol Sci. 2019;20(24):6199. doi: 10.3390/ijms20246199.
- Akkaya E, Gul M, Ugur M. Platelet to lymphocyte ratio: a simple and valuable prognostic marker for acute coronary syndrome. Int J Cardiol. 2014;177(2):597–598. doi: 10.1016/j.ijcard.2014.08.143.
- Balta S, Demırkol S, Kucuk U. The platelet lymphocyte ratio may be useful inflammatory indicator in clinical practice. Hemodial Int. 2013;17(4):668–669. doi: 10.1111/hdi.12058.
- Villarreal JZ, Pérez-Anker J, Puig S, et al. Ex vivo confocal microscopy detects basic patterns of acute and chronic lesions using fresh kidney samples. Clin Kidney J. 2023;16(6):1005–1013. doi: 10.1093/ckj/sfad019.
- Tunnicliffe DJ, Reid S, Craig JC, et al. Non-immunosuppressive treatment for IgA nephropathy. Cochrane Database Syst Rev. 2024;2(2):CD003962. doi: 10.1002/14651858.CD003962.pub3.