
Abstract
Introduction
Chronic kidney disease is a growing health issue, and the options of prevention and therapy remain limited. Although a number of observational studies have linked higher Lp(a) [lipoprotein(a)] levels to the kidney impairment, the causal relationship remains to be determined. The purpose of this study was to assess the causal association between Lp(a) levels and CKD.
Methods
We selected eight single-nucleotide polymorphisms (SNPs) significantly associated with Lp(a) levels as instrumental variables. Genome-wide association study (GWAS) from CKDGen consortium yielded the summary data information for CKD. We designed the bidirectional two-sample Mendelian randomization (MR) analyses. The estimates were computed using inverse-variance weighted (IVW), simple median, weighted median, and maximum likelihood. MR-Egger regression was used to detect pleiotropy.
Results
Fixed-effect IVW analysis indicated that genetically predicted Lp(a) levels were associated with CKD significantly (odds ratio, 1.039; 95% CI, 1.009–1.069; p = 0.010). The SNPs showed no pleiotropy according to result of MR-Egger test. Results from sensitivity analyses were consistent. In the inverse MR analysis, random-effect IVW method showed CKD had no causal effect on the elevated Lp(a) (odds ratio, 1.154; 95% CI, 0.845–1.576; p = 0.367).
Conclusion
In this bidirectional two-sample MR analysis, the causal deteriorating effects of genetically predicted plasma Lp(a) levels on the risk of CKD were identified. On the contrary, there is no evidence to support a causal effect of CKD on Lp(a) levels.
Introduction
Chronic kidney disease (CKD) is defined as renal damage or impaired renal function characterized by a glomerular filtration rate (GFR) of less than 60 mL/min/1.73 m2 that lasts for more than three months [Citation1]. CKD is currently a growing public health issue with substantial medical costs and morbidity, affecting 10%–15% of most populations [Citation2,Citation3]. In addition to the well-recognized factors like diabetes mellitus and hypertension closely related to the progression of CKD [Citation4], more risk factors have been found. Therefore, it is essential to establish causal factors of kidney disease to develop prevention strategies.
Lipoprotein(a) is a lipoprotein similar to LDL synthesized in the liver and contains apolipoprotein(a) and apolipoprotein B100 covalently linked by disulfide bonds [Citation5]. Plasma Lp(a) levels have a highly skewed distribution across population, ranging from 0 to >200 mg/dl, with most people in Europe having levels below 10 mg/dL [Citation6]. Unlike LDL, Lp(a) level is chiefly defined by LPA locus and is highly heritable [Citation7]. The Kringle IV type 2 (KIV-2) alleles in LPA locus have different copy number variation from 1 to >40 copies and encode apo(a) isoforms in different sizes [Citation8], leading to the size polymorphism of apo(a) [Citation9]. Overall, serum lipoprotein(a) concentration is inversely proportional to the apo(a) size. Higher Lp(a) concentrations are accompanied by smaller apo(a) sizes, which result from a lower copy number of KIV repeats [Citation10].
Previous epidemiological and basic researches have confirmed that higher serum Lp(a) level plays a causal role in cardiovascular disease, such as coronary heart disease and calcific aortic valve disease [Citation11,Citation12]. The risk of kidney disease is considered to be related with vascular disease [Citation13]. Recent researchers have identified higher serum Lp(a) concentration in decreasing eGFR, including during the initial phase of kidney impairment [Citation14,Citation15]. Kronenberg et al. [Citation15] investigated the correlation between renal function and serum Lp(a) levels, which had an inverse relationship to the apo(a) isoform size, in patients with various degrees of kidney dysfunction. They revealed that patients with kidney disorders had considerably higher Lp(a) levels. However, this relationship was only found in the patients who had larger apo(a) size. Although there is growing evidence that Lp(a) is abnormal in kidney disease, not all studies have validated this result. Katrin Uhlig et al. [Citation16] found no significant correlation between Lp(a) level and GFR in patients with CKD in stage 3 or 4. In addition, the kidney is considered to be engaged in Lp(a) degradation [Citation17,Citation18], which may account for the relationship between kidney impairment and Lp(a) levels. However, it is also worth considering whether Lp(a) has a causal effect to the development of kidney disease [Citation19]. Thus, the causal association of lipoprotein(a) with renal disease remain controversial and confused, and additional research is necessary to get a thorough understanding of the association between the two.
Mendelian randomization (MR) is a method used in epidemiological research allowing for more robust causal assumption between exposure and outcome [Citation20].
MR analysis could prevent underlying confounding factors and inverse causation as compared to conventional observational studies, by utilizing genetic variants with random assortment [Citation21,Citation22].Therefore, we used MR analysis in this study to evaluate the causative relationship between Lp(a) levels and the risk of CKD.
Methods
Study design
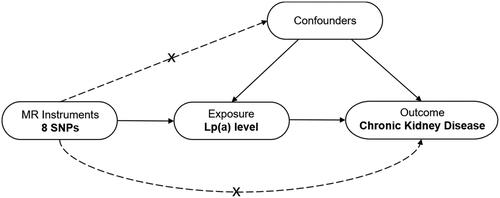
We designed a two-sample MR analysis to assess the causative relationship between Lp(a) levels and risk of CKD (). In MR analysis, three fundamental presumptions must be met by the single nucleotide polymorphisms (SNPs) identified as instrumental variables. First, these SNPs must have a significant correlation to Lp(a) level. Second, these SNPs ought not be associated with other confounding factors; Third, these SNPs should not be related with chronic kidney disease directly.
Figure 1. Design framework of the MR analysis between Lp(a) and CKD. This analysis is consistent with the hypothesis that genetic variants (SNPs) are significantly associated with Lp(a) but not with confounding factors and that SNPs are not directly related to CKD risk. MR, Mendelian randomization; SNP, single-nucleotide polymorphism; Lp(a), lipoprotein (a); CKD, chronic kidney disease.
The exposure of this study was genetically predicted serum Lp(a) level. The genetic variants correlated to Lp(a) concentration were obtained from a study applying a novel gene microarray of high-density SNPs [Citation23]. The arrays contained 48,742 SNPs in 2,100 candidate genes of 6,505 subjects from European countries. The median level of serum Lp(a) was 33 mg per deciliter (interquartile range, 15 to 89). The study outcome was the lifetime prevalence of CKD. The summary information on CKD were derived from the GWAS meta-analysis included in the CKDGen consortium, in which 480,698 subjects of European ancestry were enrolled, containing 41,395 cases of CKD (https://ckdgen.imbi.uni-freiburg.de) [Citation24]. All CKD patients in the study had eGFR< 60 mL/min per 1.73 m2, which is the clinical stage 3 or higher. Meta analysis reported no to moderate heterogeneity across studies (I2 = 0%–43%). shows the overview of data sources for the instrumental variables selected for this study. Furthermore, we additionally conducted the inverse MR analysis to clarify the causal role of CKD on Lp(a) (Supplementary Figure s1). The participants in the bidirectional MR analysis were all of European ethnicity. The studies that provided data for these GWAS analyses had received ethical permission from the relevant institutional review boards. We used the summarized data from the above trails; therefore, no separate ethics approval was needed.
Table 1. Overview of the datasets used for analyses.
Selection of genetic variants
In this MR analysis, we selected SNPs reaching a significance threshold (p < 5.0 × 10⁻⁸) determined by Clarke et al. [Citation23] as instrumental variables (IVs). The previous study screened 40 potential SNPs from the LPA region by gene chip. After excluding SNPs with low call rates, 27 SNPs were accessible for correlation analysis. They identified that 15 of the 27 SNPs achieved significance for the Lp(a) concentrations. In another study of MR analysis of Lp(a), these 15 previously published SNPs were also used by Yuesong Pan et al. [Citation25]. Furthermore, they examined the linkage disequilibrium (LD) [Citation26] of genetic variants in to check the independence of enrolled SNPs. Among these 15 SNPs, there were potential linkage disequilibrium (D′ > 50) between 7 SNPs and other SNPs (rs1321195, rs9365171, rs7765781, rs9355813, rs6923877, rs7765803, and rs13202636). Furthermore, we queried the remaining selected SNPs on PhenoScanner (http://www.phenoscanner.medschl.cam.ac.uk/). We found no associations between selected SNPs and confounding traits, including hypertension, diabetes mellitus, and obesity, at a genome-wide significance level [Citation27]. The SNP (rs10755578) was then eliminated since it was palindromic and had intermediate allele frequencies. We then extracted the information of associations between selected SNPs and CKD from CKDGen database. All remaining SNP were not associated with CKD directly at the genome-wide significance level. The remaining eight that met the criteria SNPs were determined as the instruments for the two-sample MR analysis. The SNPs indicating CKD were identified by Xiong Chen et al. These SNPs were associated with CKD of a GWAS-correlated p value < 5 × 10⁸ with a linkage disequilibrium r2 < 0.001 and index variant < 1MB [Citation28]. After removing the Lp(a)-related SNPs, 19 SNPs were identified as the instruments in the inverse two-sample MR analysis.
Statistical analysis
We performed bidirectional two-sample MR analyses to assess the causal role of Lp(a) on CKD using SNPs associated with Lp(a) and CKD described above. We regressed the SNP-CKD estimates on the SNP-Lp(a) estimates by inverse variance weighting (IVW) method [Citation24]. Specifically, the Wald ratio was estimated to assess the causal correlation of Lp(a) with CKD based on each SNP. Then, fixed-effect IVW mean was calculated as the effect estimate. The associations between each SNP and Lp(a) level were plotted as its effect on the outcome. Subsequently, we conducted the sensitivity analyses including simple and weighted median model, maximum likelihood model, and MR-Egger methods to examine the validity of the effect. The MR-Egger model allows assessing the robustness of results, as directional multivariability may violate standard instrumental variable assumptions. Therefore, possible horizontal pleiotropy were assessed by MR-Egger intercept test [Citation29] and funnel plot to provide a visual inspection [Citation30]. Cochran Q statistics were used to evaluate the heterogeneity of SNPs [Citation31]. When SNPs were heterogeneous, the random-effect IVW was utilized; otherwise, the fixed-effect IVW was employed. In addition, we conducted a leave-one-out sensitivity analysis in which each SNP was omitted in turn to determine if one single SNP strongly affects the results [Citation32]. Results were presented as odds ratios (ORs) and 95% confidence intervals (CIs) of the CKD risk per 1-SD log-transformed increasing level of Lp(a). In the present study, statistical significance was defined as a two-sided p < 0.05. The R packages were used to do all of the analyses. (‘TwoSampleMR’ [Citation33] and ‘MendelianRandomization’ [Citation34]).
Results
In total, eight SNPs associated with serum Lp(a) concentration were identified as the instrument variants after the exclusion due to linkage disequilibrium, palindrome with intermediate allele frequencies, and associations with confounding traits. In this two-sample MR analysis, all the eight SNPs (rs10455872, rs3798220, rs11751605, rs10945682, rs6919346, rs3798221, and rs6415084) and their characteristics were shown in .
Table 2. Characteristics of included eight SNPs associated with Lp(a) level.
The IVW analysis revealed a significant association between genetically predicted plasma Lp(a) levels and CKD. (Fixed-effect model: OR, 1.039; 95% CI, 1.009–1.069; p = 0.010; random-effect model: OR, 1.039; 95% CI, 1.009–1.069; p = 0.010) ( and Figure 2A). The scatter plot of each SNP with Lp(a) levels and CKD is exhibited in . Similar results were obtained in by other statistical methods, including weighted median, simple median, and maximum likelihood. However, MR-egger model showed no significant correlation between Lp(a) levels and CKD risk. Furthermore, we conducted a sensitivity analysis. The results of leave-one-out analysis in Supplementary Figure S2 revealed the significant correlation of Lp(a) levels to CKD was not contributed by one single SNP individually. MR-Egger regression results in showed the overall estimate and 95% CI of the MR-Egger intercept were 0.005 (-0.002, 0.014), p = 0.703, suggesting the correlation of Lp(a) levels to CKD does not have directional pleiotropy. showed no obvious heterogeneity for both MR-egger method (Q = 3.370, p = 0.761) and IVW method (Q = 3.515, p = 0.834).
Figure 2. Causal role of genetically predicted Lp(a) level on CKD. (A) Causal estimate of each individual SNP to CKD in fixed-effect IVW analysis. The Y-axis indicates each individual SNP, the X-axis indicates the genetic association with CKD of each SNP. The black dots and lines represent the causal estimates with 95% CI of individual SNP. The red dots and lines represent the overall effect of summarized SNPs using MR egger [estimated β = 0.028, 95% CI (−0.028, 0.085), p = 0.325] and IVW method [estimated β = 0.038, 95% CI (0.009, 0.067), p = 0.010]. (B) Scatter plot of the association of each SNP with Lp(a) and CKD. The points represented the causal estimates of each individual SNP with Lpa (X-axis) and CKD (Y-axis). The line indicated the estimate of effect of Lp(a) and CKD using fixed-IVW method. CKD, chronic kidney disease; CI, confidence interval; IVW, inverse variance weighted; Lp(a), lipoprotein(a); MR, Mendelian randomization; SE, standard error; SNP, single nucleotide polymorphism.
![Figure 2. Causal role of genetically predicted Lp(a) level on CKD. (A) Causal estimate of each individual SNP to CKD in fixed-effect IVW analysis. The Y-axis indicates each individual SNP, the X-axis indicates the genetic association with CKD of each SNP. The black dots and lines represent the causal estimates with 95% CI of individual SNP. The red dots and lines represent the overall effect of summarized SNPs using MR egger [estimated β = 0.028, 95% CI (−0.028, 0.085), p = 0.325] and IVW method [estimated β = 0.038, 95% CI (0.009, 0.067), p = 0.010]. (B) Scatter plot of the association of each SNP with Lp(a) and CKD. The points represented the causal estimates of each individual SNP with Lpa (X-axis) and CKD (Y-axis). The line indicated the estimate of effect of Lp(a) and CKD using fixed-IVW method. CKD, chronic kidney disease; CI, confidence interval; IVW, inverse variance weighted; Lp(a), lipoprotein(a); MR, Mendelian randomization; SE, standard error; SNP, single nucleotide polymorphism.](/cms/asset/7803d276-31a1-4a11-8553-8e4449cd24a9/irnf_a_2383727_f0002_c.jpg)
Table 3. Association of Lp(a) levels with CKD risk using various methods.
Table 4. MR-Egger intercept test results of association between Lp(a) and CKD.
Table 5. Heterogeneity test results of association between Lp(a) and CKD.
In the inverse MR analysis, 19 SNPs associated with CKD as the instrument variants were shown in Supplementary Table S1. Based on the results of random-effect IVW, CKD had no causal association with the elevated Lp(a) (OR, 1.154; 95% CI, 0.845–1.576; p = 0.367). Similar results were observed in other statistical methods (). P value of the MR-Egger intercept is > 0.05 (Supplementary Table S2). The P value calculated by Cochran Q < 0.05 (Supplementary Table S3) indicated heterogeneity in the association. No outliers were identified in the funnel plots and leave-one-out plot (Supplementary Figure S3).
Table 6. Association of CKD with Lp(a) using various methods.
Discussion
The causal association between the lipoprotein(a) levels and CKD were established in this two-sample MR study. Hereditary prediction of higher Lp(a) concentration was significantly associated with an elevated CKD risk. The results were consistent across sensitivity analyses conducted by various statistical methods. On the contrary, no evidence supports a causal association of CKD with the Lp(a) level.
Lp(a) containing apolipoprotein(a) and apoB100 is synthesized in the liver [Citation5] and catabolized probably in the kidney [Citation17,Citation18]. In previous research, animal experiments have confirmed that Lp(a) promotes inflammation and thrombosis [Citation35]. It was well known that elevated Lp(a) was associated with an increased risk of coronary heart disease [Citation23,Citation36]. However, the links between Lp(a) and CKD lack solid evidence. In a cross-sectional study, researchers reported lower GFR was related with mildly elevated Lp(a) [Citation37]. Penn Diabetes Heart Study analyzing 1,852 patients with type 2 diabetes also found that higher Lp(a) concentrations were significantly associated with moderate renal function impairment [Citation38]. Kronenberg et al. [Citation15] revealed an inverse relationship between Lp(a) concentration and kidney function in 227 non-renal patients. Besides, patients receiving hemodialysis for end-stage renal disease (ESRD) also had elevated Lp(a) levels [Citation39,Citation40], which were 5 to 10 times higher in patients on regular hemodialysis compared to those with early-stage CKD [Citation41]. To explore the potential role of kidney in Lp(a) elimination, a study in hemodialysis patients, by detecting stable isotopes in vivo, has showed a significant lower rate of Lp(a) [Citation42]. Together with another study [Citation18], the increased Lp(a) found in CKD patients appear to be due to the reduction of Lp(a) elimination, but not by an increase in generation. However, in our study, no evidence of CKD’s causative role in the elevation of Lp(a) was observed. It should be cautious, since the instrumental variables selected in this study were derived from previous studies, which limited the incompleteness of the selected SNPs. The selected CKD-related SNPs from CKDgen database only classified subjects according to the presence or absence of CKD, without staging of the severity of renal insufficiency, so this result cannot yield a causal association between different CKD grades and Lp(a) levels. The results are based on data from European ethnic groups and therefore cannot be generalized to other different ancestries.
Interestingly, it has also been proposed that it is Lp(a) that has a causative effect in the development of kidney disease. Yun J. S. et al. [Citation43] conducted prospective research in patients with diabetes showing that Lp(a) was an independently risk factor for the onset of CKD in patients with type 2 diabetes. Emdin et al. [Citation19] evaluated the impact of LPA gene variant score on Lp(a) concentrations and reported that genetically reduced Lp(a) concentrations were notionally correlated with a lower CKD risk with only a 9% reduction. Furthermore, Emdin et al. also revealed that genetically lowered Lp(a) level was significantly associated with the underlying quantitative trait (eGFR), consistent with a previous finding on the effect of LPA on creatinine levels [Citation44]. These findings are consistent with our present study and potentially implicated Lp(a) metabolism in CKD progression.
In addition to the observational and prospective studies described above, Mendelian randomization analysis is theoretically based on Mendel’s genetic law of independent assortment and select the appropriate genetic instruments from GWAS database, making it an efficient and cost-effective method. Furthermore, the usage of MR can ingeniously compensate the deficiencies of conventional epidemiologic studies, including unmeasured confounders and reverse causality, providing an approach for epidemiological study concerning etiology [Citation20]. These advantages have made it increasingly popular for evaluating and screening potential cause-and-effect relationships. Therefore, to identify the causal association between Lp(a) and CKD, this present study using the MR method provided evidence of the impact of genetically predicted higher Lp(a) levels on the risk of CKD. In this two-sample MR analysis based on data from GWAS studies, we examined the effects of eight genetic variants and revealed that higher Lp(a) levels had a worsening causal impact on CKD significantly. The results are aligned with two previous GWAS studies on metabolites, which showed a significant effect on creatinine of LPA rs10455872 [Citation44], and a significant association between four LPA SNPs (rs10455872, rs3798220, rs41272114, and rs143431368) and eGFR levels [Citation19]. Compared to the previous studies, our study included more identified instrumental variables associated with Lp(a) and updated summary GWAS data of CKD. These results implicated the metabolism of Lipoprotein(a) played a causal role in the progression of CKD. This elevated risk of CKD might be mediated by the increased burden of renal atherosclerosis. These results also suggested that Lp(a)-reducing therapies may be a feasible treatment strategy to prevent kidney impairment. Unfortunately, there is currently no prevailing strategy to decrease serum Lp(a) levels specifically. Some current cardiovascular therapies are known to lower Lp(a). For example, niacin can reduce Lp(a) concentration by approximately 20% and reduce LDL-C. In addition, the ability of PCSK9 mAb to lower serum Lp(a) is well established, with evolocumab found to reduce Lp(a) by 26.9%. But their cardiovascular benefit is unclear and may be small [Citation45].
Limitations
This study’s major strength included the two-sample MR study design and the scale of data sources, which improved the efficacy to detect an effect of genetically predicted Lp(a) on CKD. The potential limitations of our present study should be clarified. First, MR analysis could be potentially biased by the influence of directional pleiotropy. However, we found no pleiotropic effect in the MR-Egger intercept estimate, with consistent findings by other methods. Second, the databases we selected were all from European origin. Thereby our results may not generalize to other different ancestries. Indeed, Lp(a) levels have been demonstrated to vary considerably with ethnicity, indicating that ancestry may also determine how Lp(a) affects CKD. On the other hand, the ethnic homogeneity of the enrolled population assured that the risk of population admixture was minimal. Third, this study only reported the causative relationship between Lp(a) and CKD, but the underlying mechanisms deserve further investigation.
Conclusion
In this two-sample MR analysis based on the large-scale GWAS data, the causal deteriorating effects of genetically predicted plasma Lp(a) levels on the risk of CKD were identified. On the contrary, there was no evidence to support a causal relationship between CKD and Lp(a) level. These results suggested it is crucial to screen for CKD in individuals with elevated Lp(a) levels and Lp(a)-reducing therapies may be a feasible treatment strategy to prevent kidney impairment. In forthcoming research, investigating the underlying mechanisms by which Lp(a) escalates the risk of CKD will provide new insights and potential targets for reducing CKD risk.
Authors’ contributions
WB Z and GS F conceived and designed the study. YH Z organized these data and drafted the manuscript with the help of SZ C, Y W, and ZB C. YH Z and SZ C analyzed the data and drew the pictures. ZB C, and Y W reviewed and edited the manuscript, WB Z, and GS F detected any errors in the whole process. All authors have read and approved the manuscript for submission.
Ethics approval and consent to participate
Ethical approval and consent were not required as this study was based on publicly available data.
Supplementary material_revised.docx
Download MS Word (442.9 KB)Acknowledgments
The conference abstract “Zhu, Y., Chen, S., Fu, G., & Zhang, W. (2023). Causal Effect of Lipoprotein (A) Level On Chronic Kidney Disease: A Two-Sample Mendelian Randomization Study. Journal of the American College Of Cardiology, 81(8_Supplement), 1702.” is derived from this manuscript. Link: https://www.sciencedirect.com/science/article/pii/S0735109723021460/pdfft?md5=2ce87e709b7c001a43277fa350c7907e&pid=1-s2.0-S0735109723021460-main.pdf.
Disclosure statement
The authors declare that they have no competing interests.
Data availability statement
The datasets used and/or analyzed during the current study are available from the corresponding author on reasonable request. All data generated or analyzed during this study are included in this article. Further enquiries can be directed to the corresponding author.
Additional information
Funding
References
- Drawz P, Rahman M. Chronic kidney disease. Ann Intern Med. 2015;162(11):ITC1–IT16. doi: 10.7326/AITC201506020.
- GBD 2015 Mortality and Causes of Death Collaborators. Global, regional, and national life expectancy, all-cause mortality, and cause-specific mortality for 249 causes of death, 1980–2015: a systematic analysis for the Global Burden of Disease Study 2015. Lancet. 2016;388(10053):1459–1544. doi: 10.1016/S0140-6736(16)31012-1.
- Hill NR, Fatoba ST, Oke JL, et al. Global prevalence of chronic kidney disease - a systematic review and meta-analysis. PLoS One. 2016;11(7):e0158765. doi: 10.1371/journal.pone.0158765.
- Park S, Lee S, Kim Y, et al. Reduced risk for chronic kidney disease after recovery from metabolic syndrome: a nationwide population-based study. Kidney Res Clin Pract. 2020;39(2):180–191. doi: 10.23876/j.krcp.20.016.
- Schmidt K, Noureen A, Kronenberg F, et al. Structure, function, and genetics of lipoprotein (a). J Lipid Res. 2016;57(8):1339–1359. doi: 10.1194/jlr.R067314.
- Tsimikas S. A test in context: lipoprotein(a): diagnosis, prognosis, controversies, and emerging therapies. J Am Coll Cardiol. 2017;69(6):692–711. doi: 10.1016/j.jacc.2016.11.042.
- Tsimikas S, Hall JL. Lipoprotein(a) as a potential causal genetic risk factor of cardiovascular disease: a rationale for increased efforts to understand its pathophysiology and develop targeted therapies. J Am Coll Cardiol. 2012;60(8):716–721. doi: 10.1016/j.jacc.2012.04.038.
- Utermann G, Menzel HJ, Kraft HG, et al. Lp(a) glycoprotein phenotypes. Inheritance and relation to Lp(a)-lipoprotein concentrations in plasma. J Clin Invest. 1987;80(2):458–465. doi: 10.1172/JCI113093.
- Berg K. A new serum type system in man–the Lp system. Acta Pathol Microbiol Scand. 1963;59:369–382. doi: 10.1111/j.1699-0463.1963.tb01808.x.
- Berglund L, Ramakrishnan R. Lipoprotein(a): an elusive cardiovascular risk factor. Arterioscler Thromb Vasc Biol. 2004;24(12):2219–2226. doi: 10.1161/01.ATV.0000144010.55563.63.
- Nordestgaard BG, Langsted A. Lipoprotein (a) as a cause of cardiovascular disease: insights from epidemiology, genetics, and biology. J Lipid Res. 2016;57(11):1953–1975. doi: 10.1194/jlr.R071233.
- Nordestgaard BG, Chapman MJ, Ray K, et al. Lipoprotein(a) as a cardiovascular risk factor: current status. Eur Heart J. 2010;31(23):2844–2853. doi: 10.1093/eurheartj/ehq386.
- Liu M, Li X-C, Lu L, et al. Cardiovascular disease and its relationship with chronic kidney disease. Eur Rev Med Pharmacol Sci. 2014;18(19):2918–2926.
- Catena C, Colussi G, Nait F, et al. Early renal failure as a cardiovascular disease: focus on lipoprotein(a) and prothrombotic state. World J Nephrol. 2015;4(3):374–378. doi: 10.5527/wjn.v4.i3.374.
- Kronenberg F, Kuen E, Ritz E, et al. Lipoprotein(a) serum concentrations and apolipoprotein(a) phenotypes in mild and moderate renal failure. J Am Soc Nephrol. 2000;11(1):105–115. doi: 10.1681/ASN.V111105.
- Uhlig K, Wang S-R, Beck GJ, et al. Factors associated with lipoprotein(a) in chronic kidney disease. Am J Kidney Dis. 2005;45(1):28–38. doi: 10.1053/j.ajkd.2004.08.043.
- Albers JJ, Koschinsky ML, Marcovina SM. Evidence mounts for a role of the kidney in lipoprotein(a) catabolism. Kidney Int. 2007;71(10):961–962. doi: 10.1038/sj.ki.5002240.
- Oida K, Takai H, Maeda H, et al. Apolipoprotein(a) is present in urine and its excretion is decreased in patients with renal failure. Clin Chem. 1992;38(11):2244–2248. doi: 10.1093/clinchem/38.11.2244.
- Emdin CA, Khera AV, Natarajan P, et al. Phenotypic characterization of genetically lowered human Lipoprotein(a) levels. J Am Coll Cardiol. 2016;68(25):2761–2772. doi: 10.1016/j.jacc.2016.10.033.
- Lawlor DA, Harbord RM, Sterne JAC, et al. Mendelian randomization: using genes as instruments for making causal inferences in epidemiology. Stat Med. 2008;27(8):1133–1163. doi: 10.1002/sim.3034.
- Davey Smith G, Hemani G. Mendelian randomization: genetic anchors for causal inference in epidemiological studies. Hum Mol Genet. 2014;23(R1):R89–R98. doi: 10.1093/hmg/ddu328.
- Sekula P, Del Greco M F, Pattaro C, et al. Mendelian randomization as an approach to assess causality using observational data. J Am Soc Nephrol. 2016;27(11):3253–3265. doi: 10.1681/ASN.2016010098.
- Clarke R, Peden JF, Hopewell JC, et al. Genetic variants associated with Lp(a) lipoprotein level and coronary disease. N Engl J Med. 2009;361(26):2518–2528. doi: 10.1056/NEJMoa0902604.
- Wuttke M, Li Y, Li M, et al. A catalog of genetic loci associated with kidney function from analyses of a million individuals. Nat Genet. 2019;51(6):957–972. doi: 10.1038/s41588-019-0407-x.
- Pan Y, Li H, Wang Y, et al. Causal effect of Lp(a) [Lipoprotein(a)] level on ischemic stroke and alzheimer disease: a Mendelian Randomization Study. Stroke. 2019;50(12):3532–3539. doi: 10.1161/STROKEAHA.119.026872.
- Myers TA, Chanock SJ, Machiela MJ. An R package for rapidly calculating linkage disequilibrium statistics in diverse populations. Front Genet. 2020;11:157. doi: 10.3389/fgene.2020.00157.
- Staley JR, Blackshaw J, Kamat MA, et al. PhenoScanner: a database of human genotype-phenotype associations. Bioinformatics. 2016;32(20):3207–3209. doi: 10.1093/bioinformatics/btw373.
- Chen X, Kong J, Pan J, et al. Kidney damage causally affects the brain cortical structure: A Mendelian randomization study. eBioMedicine. 2021;72:103592. doi: 10.1016/j.ebiom.2021.103592.
- Bowden J, Davey Smith G, Burgess S. Mendelian randomization with invalid instruments: effect estimation and bias detection through Egger regression. Int J Epidemiol. 2015;44(2):512–525. doi: 10.1093/ije/dyv080.
- Sterne JAC, Sutton AJ, Ioannidis JPA, et al. Recommendations for examining and interpreting funnel plot asymmetry in meta-analyses of randomised controlled trials. BMJ. 2011;343(jul22 1):d4002–d4002. doi: 10.1136/bmj.d4002.
- Bowden J, Davey Smith G, Haycock PC, et al. Consistent estimation in Mendelian randomization with some invalid instruments using a weighted median estimator. Genet Epidemiol. 2016;40(4):304–314. doi: 10.1002/gepi.21965.
- Burgess S, Thompson SG. Interpreting findings from Mendelian randomization using the MR-Egger method. Eur J Epidemiol. 2017;32(5):377–389. doi: 10.1007/s10654-017-0255-x.
- Hemani G, Zheng J, Elsworth B, et al. The MR-base platform supports systematic causal inference across the human phenome. Elife. 2018;7:7. doi: 10.7554/eLife.34408.
- Yavorska OO, Burgess S. MendelianRandomization: an R package for performing Mendelian randomization analyses using summarized data. Int J Epidemiol. 2017;46(6):1734–1739. doi: 10.1093/ije/dyx034.
- Boffa MB, Marcovina SM, Koschinsky ML. Lipoprotein(a) as a risk factor for atherosclerosis and thrombosis: mechanistic insights from animal models. Clin Biochem. 2004;37(5):333–343. doi: 10.1016/j.clinbiochem.2003.12.007.
- Erqou S, Kaptoge S, Perry PL, et al. Lipoprotein(a) concentration and the risk of coronary heart disease, stroke, and nonvascular mortality. JAMA. 2009;302(4):412–423. doi: 10.1001/jama.2009.1063.
- Kovesdy CP, Astor BC, Longenecker JC, et al. Association of kidney function with serum Lipoprotein(a) level: the third national health and nutrition examination survey (1991-1994). Am J Kidney Dis. 2002;40(5):899–908. doi: 10.1053/ajkd.2002.36319.
- Lin J, Reilly MP, Terembula K, et al. Plasma Lipoprotein(a) levels are associated with mild renal impairment in type 2 diabetics independent of albuminuria. PLoS One. 2014;9(12):e114397. doi: 10.1371/journal.pone.0114397.
- Kronenberg F, König P, Neyer U, et al. Multicenter study of lipoprotein(a) and apolipoprotein(a) phenotypes in patients with end-stage renal disease treated by hemodialysis or continuous ambulatory peritoneal dialysis. J Am Soc Nephrol. 1995;6(1):110–120. doi: 10.1681/ASN.V61110.
- Shoji T, Nishizawa Y, Nishitani H, et al. High serum lipoprotein(a) concentrations in uremic patients treated with continuous ambulatory peritoneal dialysis. Clin Nephrol. 1992;38(5):271–276.
- Aggarwal HK, Jain D, Lathar M, et al. Lipoprotein-A and carotid intima media thickness as cardiovascular risk factors in patients of chronic kidney disease. Ren Fail. 2010;32(6):647–652. doi: 10.3109/0886022X.2010.486097.
- Frischmann ME, Kronenberg F, Trenkwalder E, et al. In vivo turnover study demonstrates diminished clearance of lipoprotein(a) in hemodialysis patients. Kidney Int. 2007;71(10):1036–1043. doi: 10.1038/sj.ki.5002131.
- Yun J-S, Ahn Y-B, Song K-H, et al. Lipoprotein(a) predicts a new onset of chronic kidney disease in people with Type 2 diabetes mellitus. Diabet Med. 2016;33(5):639–643. doi: 10.1111/dme.12862.
- Kettunen J, Demirkan A, Würtz P, et al. Genome-wide study for circulating metabolites identifies 62 loci and reveals novel systemic effects of LPA. Nat Commun. 2016;7(1):11122. doi: 10.1038/ncomms11122.
- Jang AY, Han SH, Sohn IS, et al. Lipoprotein(a) and Cardiovascular Diseases- Revisited. Circ J. 2020;84(6):867–874. doi: 10.1253/circj.CJ-20-0051.