
 ?Mathematical formulae have been encoded as MathML and are displayed in this HTML version using MathJax in order to improve their display. Uncheck the box to turn MathJax off. This feature requires Javascript. Click on a formula to zoom.
ABSTRACT
Mobility and transport patterns in border regions are highly relevant topics, as these regions still tend to be areas of limited accessibility, embedded in complex political settings of transport policy. Moreover, the contemporary call for a transition to sustainable mobility applies also to border regions. Nevertheless, limited data availability and harmonization across borders hamper the debate. In this paper, we develop a methodological approach that builds on open-source data and allows for comparative analysis and visualization of cross-border mobility and accessibility. The key elements are “space-time-lines’, combined with an indexation approach. Our study aims to position the different means of transportation in border regions. More concretely speaking, we seek to answer three main questions: In which regional settings are rail or road connections quicker? Can we identify categories of accessibility patterns? How do domestic und cross-border accessibility relate? We respond to these questions with a rail and road accessibility analysis of German border regions from a comparative perspective. Our results show that (a) the catch-up process for cross-border accessibility is not yet complete and that (b) some regions show tunnel effects, as cross-border infrastructure improvements can bypass the border region in the local sense.
1. Introduction
Mobility and transport patterns in border regions are highly relevant topics, given that these regions still tend to be areas of limited accessibility, embedded in complex political settings of transport policy. Cross-border mobility and commuting have been important issues at various spatial and political levels within Europe for decades. Border regions tend to be treated as peripheral areas in spatial planning (Caesar and Pallagst Citation2018). As a result, regional cross-border mobility concepts are often lacking. This leads to underdeveloped local public transport and car dependence in many border areas. Numerous policy programs, such as the European Regional Development Fund or INTERREG, address cross-border public transport (Basche and Spera Citation2021; EU Commission Citation2017a). Not least due to the COVID-19 pandemic, inner-European borders have drawn the focus of recent research (Chilla et al. Citation2022; Hippe et al. Citation2023; Novotný and Böhm Citation2022; Renner et al. Citation2022). The Schengen Agreement was partly suspended, and borders were not only controlled but also completely closed (Klatt Citation2020; Peyrony et al. Citation2021; Weber Citation2022). As a result, border commuters were not able to cross the border, and numerous economic sectors had to deal with enormous impacts on production and logistics (cf. Aagesen et al. Citation2022; Hippe et al. Citation2022; Medeiros et al. Citation2021; Novotný Citation2022; Rosik et al. Citation2022). Above all, public transport declined sharply during the Corona crisis, and commuters increasingly relied on cars (Eisenmann et al. Citation2021; Ferreira et al. Citation2022; Gramsch et al. Citation2022; Marra et al. Citation2022).
Moreover, mobility and transport patterns in border regions are obviously relevant to the contemporary call for a transition to sustainable mobility. For the German case, the German Federal Government aims to achieve a binding 55% reduction in greenhouse gases by 2030 with the Climate Protection Action Programme 2030 and the Climate Protection Act. In order to achieve the climate targets for the transport sector, emissions from traffic and transport must be reduced by nearly 42% by 2030 compared to 1990 emissions (German Federal Government Citation2020). In transport transition, topics like mobility behavior and instruments, such as CO2 pricing or alternative fuels, are widely discussed in this context (e.g. Haustein and Kroesen Citation2022; Kent et al. Citation2017).
It is obvious that the spatial context matters here. For example, there are significant differences when discussing transport quality in Western or Central Europe, in metropolitan or rural, in border or non-border regions, etc. As a considerable share of the population lives in border regions, those settings are especially relevant (EU Commission Citation2017b).
Against this background, a sound analytical evidence base is highly important. Nevertheless, limited data availability and harmonization across borders hamper the debate. This is unfortunate, given the importance of the topic. To address this, we develop a methodological approach that builds on open-source data and allows for comparative analysis and visualization of cross-border mobility and accessibility. The key elements are the “space-time-lines’, combined with an indexation approach.
Our study aims to position the various means of transportation in border regions. To put things in more concrete terms, we seek to answer three main questions. In which regional settings are rail or road connections quicker? Can we identify categories of accessibility patterns? How do domestic und cross-border accessibility relate? We approach these questions through an analysis of rail and road accessibility in German border regions from a comparative perspective. The German case is highly relevant, as one third of the German population lives close to the national border (Kluge et al. Citation2017). Furthermore, German border regions are diverse in their spatial setting (metropolitan, rural, mountainous, maritime, etc.).
2. Conceptual framework
2.1. Mobility across national borders
Even decades after the establishment of the European free labor movement, borders continue to be obstacles in many respects. Geomorphological barriers, variations in regional planning, limited cross-border governance, language barriers and cultural differences are just a few examples (Chilla and Heugel Citation2022; Knowles and Matthiessen Citation2009; Kurowska-Pysz et al. Citation2018; Medeiros Citation2018; Parenti and Tealdi Citation2021; Rietveld Citation2012). Nevertheless, cross-border flows have gained importance over the last two or three decades (Mathä and Wintr Citation2009; Wiesböck and Verwiebe Citation2017). Cross-border commuting is driven by various factors, including differences in salary levels and job offers. Commuter flows are characterized by complex patterns of age, gender and qualifications across many sectors (Gimenez-Nadal et al. Citation2020; Giménez-Nadal et al. Citation2021; Knotter Citation2014; Pires and Nunes Citation2018). There is competition for qualified workers – and not only in metropolitan areas close to the border (Decoville et al. Citation2013). Rural border regions are also increasingly integrated into the international labor market, as workers accept longer commuting distances and cross-border infrastructure has been punctually improved (cf. Klatt Citation2022; Lewczuk and Ustinovichius Citation2015; Möller et al. Citation2018).
Cross-border commuting is relevant across Europe, but in a spatially diverse manner: Switzerland and Luxembourg are the main attractive labor markets for cross-border commuters, complemented by several other metropolitan integration areas (Lille, Copenhagen etc.). Moreover, European enlargement has led to cross-border commuting, e.g. in the Trieste region and between Czechia and Germany (Haindorfer Citation2020).
The numerous studies address cross-border commuting in very different geographical settings. These include the Greater Region around Luxembourg (Baustert et al. Citation2019; Järv et al. Citation2022), Western Europe (Broersma et al. Citation2022; Jacobs-Crisioni and Koomen Citation2017; Vincent-Geslin and Ravalet Citation2016), the Basel metropolitan region (Meinherz and Binder Citation2020; Turner et al. Citation2022), South-Western Europe (Pires and Nunes Citation2018), the Alpine region (Cavallaro and Dianin Citation2020a; Chilla and Heugel Citation2022), maritime regions (Klatt Citation2014) as well as Central Europe (Cavallaro and Dianin Citation2020b). The thematically wide-ranging, mostly quantitative approaches are often confronted with a non-harmonised or incomplete data situation on cross-border commuting.
Studies on disparities between old and new EU member states emphasize the relevance of infrastructure for cross-border mobility (Miltiadou et al. Citation2017, for South-Eastern Europe; Knippschild Citation2011, for Central Europe). In Western European border areas, cross-border cooperation on transport infrastructure has already been possible for decades (see Bouwens Citation2004; Chilla and Lambracht Citation2022; Durand and Decoville Citation2018). In some cases, joint regional planning or local transport concepts with complementary ticketing systems have emerged. There is still potential for cross-border governance in the transport sector across Europe, even if the need might be of particular relevance between “old” and “new” member states (Gamon and Naranjo Gómez Citation2019). In this context, Cavallaro and Dianin (Citation2019) mention low population densities within border regions in Central Europe. Accordingly, national interest, the willingness to cooperate and public funds are often lacking in rail and road transport policies (Abramović et al. Citation2017; Kurowska-Pysz et al. Citation2018).
2.2. Accessibility in border regions
In recent years, accessibility concepts have gained importance in political and scientific debates (e.g. concerning the mobility transition and multi-modal transport). From a political point of view, the functionality of metropolitan areas and peripheral connectivity are key elements for balanced socio-economic development. Accessibility aims to measure the effort required to travel a certain distance (ESPON Citation2011). The scientific discussion here is highly complex. Simplifying, to a certain extent, we distinguish two strands of discussion.
First, many studies focus on distances (kilometres) or travel times, often complemented by measures of infrastructure quality. Temporal or kilometric isochrones are prominent examples (e.g. 10 km or 30-minute isochrones; Bentlage et al. Citation2021; Bertram and Chilla Citation2022; Cattaneo et al. Citation2021). Other studies use the “two-step floating catchment area method” to analyse big data (Song et al. Citation2018; Kompil et al. Citation2019; Shah et al. Citation2020). Another way to express accessibility is the space-time approach. Space-time mapping visualizes distances as proportional to travel times. It illustrates how infrastructure improvements could reduce travel times in an abstract manner (Chilla and Heugel Citation2018; Spiekermann and Wegener Citation1994). In theory, the expansion of big data has improved the data base. In practice, however, the availability of data is rather limited. Mobile phone companies, navigation systems and toll companies collect huge amounts of data, but that can hardly be used for research purposes, due to data protection policies and commercial restrictions.
Second, a series of studies has focused on indicators that combine infrastructure and distance with information on the regional socio-economic potential (e.g. population potential in catchment areas). In this context, several approaches also use line graphs to represent flows or relationships, e.g. for migration and second homes (Berroir et al. Citation2017). The weakness of this approach is that the results do not always reflect the actual accessibility quality; they are mostly limited to the material dimensions of the infrastructure. In addition, the polycentric character of many regions and mobility patterns can lead to challenges in visualization and analysis.
In both strands of the discussion, the improvement of infrastructural bottlenecks is a relevant issue, on several spatial scales (ESPON Citation2011). The concept of accessibility entails multiple interactions between spatial contexts and is also relevant in border regions. Conventional public transport services are hardly efficient when demand is low and dispersed (Farrington and Farrington Citation2005). As a result, people in rural border areas tend to depend on cars. Those who do not have access to car mobility, due to age or economic or cultural barriers, are the most affected by deficits in accessibility (Verma and Taegen Citation2019). Moreover, it is not only the physical dimension (road and rail) that determines accessibility but also the technical setup (e.g. in terms of on-demand mobility; Philip and Williams Citation2019). These challenges mainly relate to regional governance as well as decision-making at the national level and are particularly relevant in border regions.
The quantity of cross-border commuting is strongly influenced by the quality of the transport infrastructure (cf. Haindorfer Citation2020). In this paper, our focus is on the quality of private and public transport in German border regions. With one third of German inhabitants living close to a national border (Kluge et al. Citation2017), cross-border accessibility is as important as the domestic accessibility in border regions. Our approach builds on the “space-time-line” approach and shows the de facto mobility quality (including rush hour, traffic jams, etc.). The calculation of speeds based on linear distances facilitates a comparison between public and private transport. By using open-source data, this study is geared at addressing data gaps that are a fundamental characteristic of transport geography (Dobruszkes Citation2012).
3. Methodology
3.1. Spatial focus
In this study, we measure the temporal accessibility of cities and towns in German border regions and visualize the average travel times by train and car. German border regions represent a territorial diversity of European border areas. Some established border regions have cooperated since the beginning of the European Union (e.g. Germany-Netherlands); others have undergone integration processes only since the eastern enlargement of the European Union in 2004 (e.g. Germany-Poland). Furthermore, the geographical settings of Germany’s border regions are highly heterogeneous (e.g. maritime, mountainous, metropolitan and peripheral).
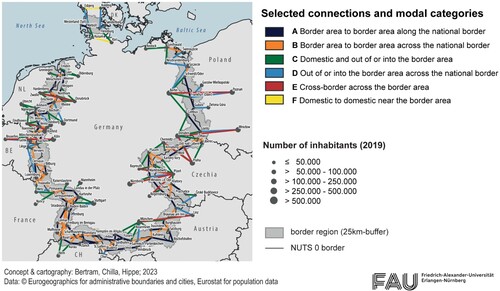
In our paper, border cities or towns are defined as local administrative units with at least 25% of their area within a 25-kilometre buffer along the German national border. The included cities are selected based on the following criteria: the presence of a railway station, number of inhabitants, spatial coverage, node hub and functionality. The set of towns in border regions is complemented by highly populated cities in the domestic “hinterland” (see ).
Table 1. Selected connections for space-time-analysis of train and car connections in German border regions.
Consequently, the chosen domestic cities in the German-Polish sample are located further away from the border than, for example, those in the German-Dutch border region. However, the latter is also an exception, as the border region is predominantly urban, and numerous metropolises are located in, or on the edge of, the border region (e.g. the Ruhr region). In contrast, the German-Polish or German-Czech border regions are more rural. This allows us to reflect on the accessibility of border regions towards domestic centers. lists the selected city/town pairs that are objects of this study. We classify the connections into six modal categories:
Border area to border area along the national border
Border area to border area across the national border
Domestic and out of or into the border area
Out of or into the border area across the national border
Cross-border across the border area
Domestic to domestic near the border area
We use identical connections for rail and road analysis. In both cases, the central railway stations serve as reference points.
Figure 1. Selected connections and modal categories of this study.
3.2. Data and methods
3.2.1. Space-time lines as methodological approach
The “space-time-lines" approach differentiates spatial accessibility and allows for cartographic visualization. A comparative perspective for different modes of transport helps us understand and interpret the accessibility patterns along the German border. Our study covers both public and private transport modes, i.e. train and car connections. Other means of transport, such as bus, airplane, on-demand offers or carpooling are not taken into account. In some rural villages, busses constitute the only public transport mode. In our study, however, rather urbanized settlements are the focus, so the limitation on rail connections is methodologically appropriate.
Our paper is based on three forms of “space-time-line” visualizations along and across the German border, namely:
– Average number, speed, and transfers of rail connections
– Average speed of car connections
– Comparison between public and private transport modes (rail and road)
Following the cartographic representation, we condense the results by categorizing linkage patterns.
3.2.2. Public transport: rail
This study is based on space-time-related data for rail and road connections between selected cities and towns. For the space-time analysis of rail accessibility, we use the following indicators: average number of daily train connections per direction, average travel time of the fastest connection, number of transfers and airline distance. The main database for public transport is the Deutsche Bahn travel site,Footnote1 which is publicly available. All rail queries refer to a working day in February 2022 (Wednesday, 2022/02/09) from 4 am to the end of the day. The data reflect train connections with a maximum of two changes between the main stations. In cases of train cancellations due to repair work, we monitored the corresponding rail replacement services as substitutes. In addition to the data on connections, transfers and travel time, airline distances between the train stations were obtained from the luftlinie.org website.Footnote2
With the collected data, the speed of each connection is calculated as follows:
Here, vt is the speed, s is the linear air distance and t is the fastest travel time between the respective railway stations.
In general, the "space-time-lines" for public transport illustrate the technical quality of the connections: the more direct and the better the technical level of the railway line, the faster the connection. Moreover, topographical barriers can also affect the speed of a given connection. The organizational quality is represented by the daily number of connections and also its speed: if a connection is part of the high-speed network, it is faster than those that are only part of the regional train network.
3.2.3. Private transport: road
For the analysis of car travel times, we use Google Maps.Footnote3 The train stations of the selected cities and towns serve as starting and finishing points. We used automatic queries (API) for the data collection. The current traffic situation is taken into account, in order to reflect possible commuting delays. This plays a major role in, for example, the metropolitan areas around Luxembourg or Basel, which exhibit high volumes of commuters and high probabilities of traffic jams or slow-downs (e.g. Baustert et al. Citation2019; Meinherz and Binder Citation2020). The timeframe of the data is two weeks in a row, on Tuesdays and Thursdays in February (1st and 3rd; 8th and 10th). This puts delays due to temporary road works or accidents into perspective. In order to acquire as broad of a traffic picture as possible throughout the day, we monitored three time periods each day:
– Timeframe A: 7 am to 9 am,
– Timeframe B: 11 am to 1 pm
– Timeframe C: 4 pm to 6 pm
We calculated average values per direction over all timeframes. Afterwards, the mean value of both directions yields the total average time per connection. The resulting speed per road connection is calculated as follows:
Here, vc represents the speed, s the linear air distance (again, luftlinie.org) and t the average travel time between train stations of the respective cities or towns.
In the cartographic illustration, the connections between the cities are also illustrated as “space-time-lines’. The color of the line represents the speed of the fastest connection. The cartographic illustration also indicates the technical quality of the connection as well as the de facto quality, including rush hour effects. Indirectly, a slow speed indicates not only a low level of technical quality but also the given infrastructure’s ability to meet the needs of daily commuters.
3.2.4. Comparison of rail and road
The present calculations merely allow for individual evaluations of each rail or road link. In contrast, the comparison of both modes of transport reveals which mode is the faster one of each specific connection. For this purpose, the speed of train connections was put into relation with the average speed of car connections by indexing:
Here, I represents the indexed comparison value, whereas vc and vt indicate the respective average speeds of the car and train connections. In order to achieve percentage values, the quotient is multiplied by 100.
In this case, the “space-time-lines’ illustrate the indexation with lines and colors. Two different color schemes indicate which means of transport is the fastest for a given connection.
Our analysis of rail connections includes several distinct variables, while the road analysis measures only the speed of the connection. For the rail connections, in particular, we consider the planned journey time, not the actual journey time. Therefore, possible delays of rail connections are not accounted for. Furthermore, train connections in our analysis have a methodical advantage, as car connections also have main rail stations as their starting- and endpoints. Especially in large cities, it takes longer to get out of the city center by car. However, identical end and start points are a prerequisite for the comparability of the two modes of transport.
4. Results and discussion
4.1. Overview
presents three “space-time-line” maps. The illustrations provide information on the quality of car and train connections between border regions in and around Germany. Map A illustrates the speed of car connections in km/h. The darker the blue line, the faster the connection. Map B depicts the speed of train connections and the number of daily connection and transfers. The line width car responds to the number of daily connections between the selected cities or towns. Line colors represent average speeds of the fastest connection in km/h. A dashed line indicates that at least one change is necessary for those travelling on this route. Map C shows the indexed quotient of the speed of train and car connections. The green color scheme (values above 100) indicates that the car is the faster means of transport on a given route. In contrast, the yellow color scheme (values below 100) illustrates that the train is the faster means of transport. The more the values deviate from 100, the higher the differences between both means of transport.
Figure 2. Space-time-lines for private and public transport in German border regions.
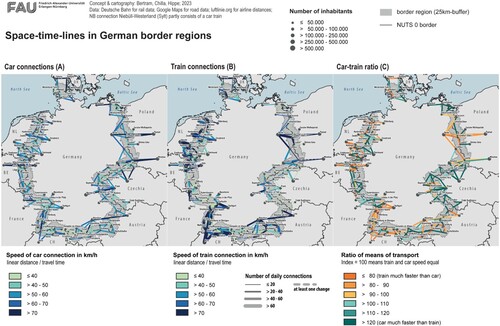
4.2. Private and public transport
The “space-time-lines’ on car connections (A) show more accessibility differences within border regions than between them. The connections between metropolises outside border areas indicate a high average speed of road connections. Examples are Berlin-Poznań, Dresden-Wrocław, Nürnberg-Plzeň, München-Linz, Strasbourg-Basel, Köln-Bruxelles and Düsseldorf-Bruxelles. In contrast, the average car speed within the border areas between medium- and small-sized cities/towns tends to be much slower. This reflects the role of priority axes, often linked to the trans-European transport network. This phenomenon is known as the “tunnel effect”, in the debate on spatial integration (De Boe et al. Citation1999; Topaloglou et al. Citation2005). This means that European integration is more likely to improve linkages between domestic centers than those within border regions in the local sense.
A series of national borders across Europe are identical with “natural” borders. The map shows the relevance of geomorphological barriers to car mobility. For example, the average road speed along Lake Constance is much lower than the speed along the other German-Swiss or German-Austrian border. Another example is the Niebüll-Sylt link, where ferry or car-train mobility constrains the average speed across the North Sea. In addition, road speeds in mountainous regions (e.g. Alpine region, Ore Mountains, Bavarian Forest/Šumava) are quite slow. In these cases, the political challenges of integration are further complicated by natural barriers.
In contrast to map A, the “space-time-lines’ for train connections (B) reveal some border-regional hotspots. The number of connections between cities and towns beyond the West German border is significantly higher than in the East (except for the Berlin-Poznań axis). Border regional hotspots, in terms of number and speed of cross-border connections, are the German-Dutch border region, the Luxembourg-Thionville-Metz axis, the Upper Rhine, the German-Swiss border region, the München-Kufstein-Innsbruck axis and the München-Linz-Passau axis.
Moreover, the results on train transport show clear differences in rail quality within border regions. In particular, the German-Polish and the German-French border regions are examples of high differences within border regions. In both cases, there is a north-south divide, in terms of rail quality. In the German-Polish border area, the quality of train connections is much higher south of the Berlin-Poznań axis than north of it. The German-French example is similar, as the rail quality on the Upper Rhine is higher than in the northern border region around Saarbrücken.
Similar to the road analysis, the rail “space-time-lines’ indicate high cross-border quality between metropolitan areas. The connections between metropolises and major cities across the borders exhibit particularly high speeds (e.g. München-Linz, Bruxelles-Köln and Stuttgart-Strasbourg). The majority of rail connections across the border area are faster than connections within the border area. However, the Germany-Netherlands example is an exception in this respect. The high population density in this region and various large cities comes along with high numbers of daily connections and fast average speeds on train routes within the border area.
It is striking that geomorphological barriers are hardly visible from this perspective. In contrast to the road analysis, topographical barriers in border regions, such as mountains (e.g. Germany-Austria) and rivers (e.g. Germany-France), are barely evident on this map scale. This is due to the fact that we focus on rather large settlements along the valleys. The patterns differ in the German-Czech border region, especially in the Bavarian Forest and Ore mountains regions. In these cases, the geomorphology is more visible, due to the lack of cross-border corridors.
4.3. Comparison between road and rail transport in border regions
Map C compares the accessibility quality of road and rail in a spatially differentiated way. The car tends to be the better choice in Germany’s border regions with Denmark, Poland, Czechia, Luxembourg and Austria for the non-metropolitan part. In contrast, the train tends to be the faster means of transport in the Upper Rhine region (German-Swiss border region), for most German-Dutch routes and especially for cross-border connections between major cities, (e.g. Berlin-Poznań, München-Innsbruck, Strasbourg-Basel, Köln-Bruxelles). The Nürnberg-Plzeň, Dresden-Praha and Dresden-Wrocław axes are exceptions in this respect. In these metropolitan cases, the car is the faster means of transport. This leads to the conclusion that the transnational rail routes between metropolises are still less developed in Eastern Germany’s border regions than in the others (except for Berlin-Poznań).
For non-metropolitan cases, the map shows mostly faster car connections across the national border and faster rail connections alongside the border. The German-Danish border region is particularly instructive. In this example, the domestic routes are faster by train, but the car is the faster means of transport for cross-border connections.
This links back to our first research question: Which means of transport is the fastest in German border regions? categorizes five connection modes in the border-regional context. We calculate the share of the faster means of transport for the respective spatial settings.
Table 2. The modal perspective of cross-border transport connections in German border regions. Bold letters stress the higher value.
In all cross-border categories (B, D and E) the car is faster for the majority of connections. In contrast, for the majority of domestic connection modes, the train is the faster means of transport (A and C). The case of category B is particularly interesting: for more than 70% of all cross-border connections within the border region, the car is the faster choice. This differs significantly from domestic connections within the border region (A). For almost 60% of these connections, the train is faster. Even though the number of connections in category E is comparatively low (11 connections), the ratio in favor of road connections (72.7%) is clearly visible. This underlines the idea that road quality across the border area (especially between metropolises) is higher than rail quality.
summarizes the results from a border-regional perspective. Around 54% of the connections in our sample indicate road links as being faster than rail links (around 46%). From a comparative border-regional view, the maritime (Germany-Denmark) and mountainous (Germany-Austria, Germany-Czechia) border regions show similar patterns. Here, the share of faster car connections is higher. These results underline the proposition that topographical settings can hamper rail infrastructure quality. Especially in rural and mountainous border areas, additional consideration of bus connections could be worthwhile.
Table 3. The German border-regional perspective of cross-border transport connections. Bold letters stress the higher value.
From the border-regional perspective, we cannot identify any Eastern border-specificities. For example, the German-Polish border region shows patterns similar to those of the German-Dutch border region. In both cases, the share of faster rail connections is higher. Moreover, the German-Czech border region exhibits values in favor of car connections comparable to those of the border region Germany-Luxembourg.
5. Conclusion
This study highlights the empirical potential of time-space-related mobility data from open-source databases for transport geography and border studies. From the border-regional perspective, two insights have to be stressed. First, a major finding is the difference between cross-border and domestic connections. For the majority of cross-border connections, travel by car is faster than travel by train. In contrast, the train is faster for domestic connections without border crossings. The average values across both categories, however, indicate that train connections are the slower mode of transport for the majority of connections. This is striking, as the methodological approach reflects traffic jams’ impacts on car mobility but, as mentioned earlier, does not account for delays in train transport. Moreover, the definition of central stations as nodes tends to shed a more positive light on train connections. An expansion of the train infrastructure and an increase in frequency could address this. The highest potential for the mobility improvement is in rural border areas, where both rail and car are mainly slow mobility modes. However, our study cannot discern the exact reasons for poor accessibility for each border area. In principle, low speeds can be caused by a number of factors, including the number of rails or bridges, the availability of train electricity and the road class. Whatever the reason is, each improvement tends to be accompanied by major challenges, such as cost-intensive expansion of the rail infrastructure and complicated and lengthy planning procedures. The path dependency of the national bias in transport planning is, at this point, obvious.
Second, cross-border linkages between larger cities beyond border regions tend to be quicker than cross-border links within border regions. This may indicate a “tunnel effect”, as border regions may profit less from investment in cross-border infrastructure than domestic centers.
Both arguments can be read from a normative perspective, indicating that the catch-up process concerning cross-border accessibility is not yet complete. Cross-border transport policy still has to consider serious gaps – particularly in public transport – that raise questions about cohesion and sustainable mobility transition. In many cases, infrastructure investment and train-track reactivation can significantly change a situation. However, it is obvious that rail infrastructure cannot fulfil all accessibility needs. Rather, a multi-modal perspective is important, linking rail, road and other modes, e.g. (E-)bikes, on demand formats, etc. In the coming years, a series of innovations, such as autonomous driving, cross-border ticketing, carpooling applications, artificial intelligence and more, will provide new options for the improvement of (domestic and cross-border) accessibility. However, the need for transport policy beyond domestic frameworks will continue to be of key importance.
Acknowledgments
We would like to thank the reviewers for constructive remarks that significantly improved our paper. Furthermore, we also thank Verena Birkmann and Theo Mannmeusel for their support in data collection.
Disclosure statement
No potential conflict of interest was reported by the author(s).
Correction Statement
This article has been corrected with minor changes. These changes do not impact the academic content of the article.
Additional information
Funding
Notes
References
- Aagesen, H.W., O. Järv, and P. Gerber. 2022. The effect of COVID-19 on cross-border mobilities of people and functional border regions: the Nordic case study from Twitter data, Geografiska Annaler: Series B, Human Geography. doi:10.1080/04353684.2022.2101135.
- Abramović, B., V. Zitricky, and P. Mesko. 2017. Draft Methodology to Specify the Railway Sections Capacity. LOGI – Scientific Journal on Transport and Logistics 8: 1–10. doi:10.1515/logi-2017-0001.
- Basche, H., and F. Spera. 2021. Interactions Between Key Factors That Influence Cross-Border Cooperation in Public Transport: The Case of the Euregio Meuse-Rhine. Journal of Borderlands Studies, doi:10.1080/08865655.2021.1957978.
- Baustert, P., T.M. Gutiérrez, T. Gibon, L. Chion, T.-Y. Ma, G.L. Mariante, et al. 2019. Coupling Activity-Based Modeling and Life Cycle Assessment—A Proof-of-Concept Study on Cross-Border Commuting in Luxembourg. Sustainability 11, no. 15: 4067. doi:10.3390/su11154067.
- Bentlage, M., C. Müller, and A. Thierstein. 2021. Becoming More Polycentric: Public Transport and Location Choices in the Munich Metropolitan Area. Urban Geography 42, no. 1: 79–102. doi:10.1080/02723638.2020.1826729.
- Berroir, S., N. Cattan, F. Dobruszkes, M. Guérois, F. Paulus, and C. Vacchiani-Marcuzzo. 2017. Les Systems Urbains Français: Une Approche Relationelle. Cybergeo: European Journal of Geography, Espace, Société, Territoire.
- Bertram, D., and T. Chilla. 2022. Polycentricity and Accessibility in Mountain Areas: The Alpine Case. European Planning Studies, 1–21. doi:10.1080/09654313.2022.214587.
- Bouwens, S. 2004. The Dynamics of Cross-Border Labor: Commuting from the Dutch to the German Part of the Euregio Meuse-Rhine, 1960-2000. Journal of Borderlands Studies 19, no. 2: 135–53. doi:10.1080/08865655.2004.9695630.
- Broersma, L., A. Edzes, and J. van Dijk. 2022. Commuting Between Border Regions in The Netherlands, Germany and Belgium: An Explanatory Model. Journal of Borderlands Studies 37, no. 3: 551–73. doi:10.1080/08865655.2020.1810590.
- Caesar, B., and K. Pallagst. 2018. Spatial Development Concepts – A Cross-Border Planning Instrument with a Future? Experiences from the German Borderlands. Borders in Perspective – UniGR-CBR thematic issue 1: 9–20.
- Cattaneo, A., A. Nelson, and T. McMenomy. 2021. Global Mapping of Urban–Rural Catchment Areas Reveals Unequal Access to Services. Proceedings of the National Academy of Sciences 118, no. 2.
- Cavallaro, F., and A. Dianin. 2019. Cross-border Commuting in Central Europe: Features, Trends and Policies. Transport Policy 78: 86–104.
- Cavallaro, F., and A. Dianin. 2020a. Cross-border Public Transport as a Driver for Tourism in the Alps. Transportation Research Procedia 48, no. 2: 2446–61. doi:10.1016/j.trpro.2020.08.262.
- Cavallaro, F., and A. Dianin. 2020b. Efficiency of Public Transport for Cross-Border Commuting: An Accessibility-Based Analysis in Central Europe. Journal of Transport Geography 89: 102876.
- Chilla, T., T. Große, S. Hippe, and B.B. Walker. 2022. COVID-19 Incidence in Border Regions: Spatiotemporal Patterns and Border Control Measures. Public Health 202: 80–3. doi:10.1016/j.puhe.2021.11.006.
- Chilla, T., and A. Heugel. 2018. Spatial Integration of Cross-Border Mobility Structures-The ‘Space-Time-Line’ Analysis in the Greater Region and the Czech Bavarian Border Region. Cross-Border Territorial Development–Challenges and Opportunities 68.
- Chilla, T., and A. Heugel. 2022. Cross-border Commuting Dynamics: Patterns and Driving Forces in the Alpine Macro-Region. Journal of Borderlands Studies 37, no. 1: 17–35. doi:10.1080/08865655.2019.1700822.
- Chilla, T., and M. Lambracht. 2022. Institutional Mapping of Cross-Border Cooperation. INTERREG Programme Analyses with KEEP Data. European Planning Studies, doi:10.1080/09654313.2022.2058321.
- De Boe, P., C. Grasland, and A. Healy. 1999. Spatial integration, final report, Strand 1.4, Study Programme on European Spatial Planning.
- Decoville, A., F. Durand, C. Sohn, and O. Walther. 2013. Comparing Cross-Border Metropolitan Integration in Europe: Towards a Functional Typology. Journal of Borderlands Studies 28, no. 2: 221–37. doi:10.1080/08865655.2013.854654.
- De Wispelaere, F., and G. Berki. 2021. The Role and Limits of the European Health Insurance Card: (Too) Great Expectations? Journal of European Social Policy 31, no. 4: 424–31. doi:10.1177/09589287211023046.
- Dobruszkes, F. 2012. Stimulating or Frustrating Research? Transport Geography and (un) Available Data. Belgeo. Revue belge de géographie: 1–2.
- Drăgușin (Trincu-Drăgușin), C.-P., I.C. Pitulice, and A. Ștefănescu. 2021. Harmonisation and Emergence Concerning the Performance Audit of the EU Member States’ Public Sector. Romania’s Case. Sustainability 13, no. 7: 3673. doi:10.3390/su13073673.
- Durand, F., and A. Decoville. 2018. Establishing Cross-Border Spatial Planning. In European Territorial Cooperation. The Urban Book Series, ed. E. Medeiros. Cham: Springer. doi:10.1007/978-3-319-74887-0_12
- Edzes, A.J.E., J. van Dijk, and L. Broersma. 2022. Does Cross-Border Commuting Between EU-Countries Reduce Inequality? Applied Geography 139: 102639. doi:10.1016/j.apgeog.2022.102639.
- Eisenmann, C., C. Nobis, V. Kolarova, B. Lenz, and C. Winkler. 2021. Transport Mode use During the COVID-19 Lockdown Period in Germany: The Car Became More Important, Public Transport Lost Ground. Transport Policy 103: 60–7.
- ESPON. 2011. Territorial Dynamics in Europe: Trends in Accessibility’, Territorial Observation No. 2. Online: https://www.espon.eu/topics-policy/publications/territorial-observations/territorial-dynamics-europe-trends-accessibility (accessed 13.09.2022).
- EU Commission. 2017a. Seeking smarter European commuting strategies. https://ec.europa.eu/regional_policy/en/newsroom/news/2017/12/17-12-2017-seeking-smarter-european-commuting-strategies (accessed 13.09.2022).
- EU Commission. 2017b. Boosting growth and cohesion in EU border regions. https://ec.europa.eu/regional_policy/en/information/publications/communications/2017/boosting-growth-and-cohesion-in-eu-border-regions (accessed 13.09.2022).
- Farrington, J., and C. Farrington. 2005. Rural Accessibility, Social Inclusion and Social Justice: Towards Conceptualisation. Journal of Transport Geography 13, no. 1: 1–12.
- Ferreira, S., M. Amorim, A. Lobo, M. Kern, N. Fanderl, and A. Couto. 2022. Travel Mode Preferences among German Commuters Over the Course of COVID-19 Pandemic. Transport Policy 126: 55–64.
- Gamon, W., and J.M. Naranjo Gómez. 2019. Main Problems of Railway Cross-Border Transport Between Poland, Germany and Czech Republic. Sustainability 11, no. 18: 4900–10.
- German Federal Government. 2020. Climate-friendly transport. https://www.bundesregierung.de/breg-en/issues/climate-action/climate-friendly-transport-1795842 (accessed 13.09.2022).
- Ghio, E., G.-J. Boon, D. Ehmke, J. Gant, L. Langkjaer, and E. Vaccari. 2021. Harmonising Insolvency Law in the EU: New Thoughts on Old Ideas in the Wake of the COVID-19 Pandemic. International Insolvency Review 30, no. 3: 427–59. doi:10.1002/iir.1432.
- Gimenez-Nadal, J.I., J.A. Molina, and J. Velilla. 2020. Commuting and Self-Employment in Western Europe. Journal of Transport Geography 88: 102856.
- Giménez-Nadal, J.I., J.A. Molina, and J. Velilla. 2021. Two-way Commuting: Asymmetries from Time use Surveys. Journal of Transport Geography 95: 103146.
- Gramsch, B., C.A. Guevara, M. Munizaga, D. Schwartz, and A. Tirachini. 2022. The Effect of Dynamic Lockdowns on Public Transport Demand in Times of COVID-19: Evidence from Smartcard Data. Transport Policy 126: 136–50.
- Haindorfer, R. 2020. Impacts of Negative Labor Market Experiences on the Life Satisfaction of European East–West Mobile Workers: Cross-Border Commuters from the Czech Republic, Slovakia and Hungary in Austria. Journal of Industrial Relations 62, no. 2: 256–77. doi:10.1177/0022185619897087.
- Haustein, S., and M. Kroesen. 2022. Shifting to More Sustainable Mobility Styles: A Latent Transition Approach. Journal of Transport Geography 103: 103394.
- Hippe, S., D. Bertram, and T. Chilla. 2022. The COVID-19 pandemic as a catalyst for cross-border cooperation? Lessons learnt for border-regional resilience. Europa XXI 43: 1. doi:10.7163/Eu21.2022.43.1.
- Hippe, S., D. Bertram, and T. Chilla. 2023. Convergence and Resilience in Border Regions. European Planning Studies, doi:10.1080/09654313.2023.2170214.
- Jacobs-Crisioni, C., and E. Koomen. 2017. Population Growth, Accessibility Spillovers and Persistent Borders: Historical Growth in West-European Municipalities. Journal of Transport Geography 62: 80–91. doi:10.1016/j.jtrangeo.2017.05.008.
- Järv, O., H.W. Aagesen, T. Väisänen, and S. Massinen. 2022. Revealing Mobilities of People to Understand Cross-Border Regions: Insights from Luxembourg Using Social Media Data. European Planning Studies, doi: 10.1080/09654313.2022.2108312.
- Kent, J., R. Dowling, and S. Maalsen. 2017. Catalysts for Transport Transitions: Bridging the gap Between Disruptions and Change. Journal of Transport Geography 60: 200–7.
- Klatt, M. 2014. (Un)Familiarity? Labor Related Cross-Border Mobility in Sønderjylland/Schleswig Since Denmark Joined the EC in 1973. Journal of Borderlands Studies 29, no. 3: 353–73. doi:10.1080/08865655.2014.938968.
- Klatt, M. 2020. The Danish–German Border in Times of COVID-19. Borders in Globalization Review 2, no. 1: 70–3. doi:10.18357/bigr21202019867.
- Klatt, M. 2022. Rural Border Cities: The Danish–German Border Region of Schleswig. In Border Cities and Territorial Development, (Hg.) Eduardo Medeiros, 148–70. London, New York, Abingdon: Routledge (Regions and cities).
- Kluge, L., B. Schwarze, and K. Spiekermann. 2017. Raumbeobachtung Deutschland und Angrenzende Regionen. Räumliche Strukturen und Verflechtungen. MORO Praxis 11. Bonn: Bundesamt für Bau-, Stadt und Raumordnung. https://www.bbsr.bund.de/BBSR/DE/veroeffentlichungen/ministerien/moropraxis/2017/moro-praxis-11-17-langdl.pdf;jsessionid=87FEF87044F9E8FA8A43E112E0AF63C8.live21302?__blob=publicationFile&v = 1 (accessed 13.09.2022).
- Knippschild, R. 2011. Cross-border Spatial Planning: Understanding, Designing and Managing Cooperation Processes in the German–Polish–Czech Borderland. European Planning Studies 19, no. 4: 629–45.
- Knotter, A. 2014. Perspectives on Cross-Border Labor in Europe: “(Un)familiarity” or “Push-and-Pull”? Journal of Borderlands Studies 29, no. 3: 319–26. doi:10.1080/08865655.2014.938972.
- Knowles, R.D., and C.W. Matthiessen. 2009. Barrier Effects of International Borders on Fixed Link Traffic Generation: The Case of Øresundsbron. Journal of Transport Geography 17, no. 3: 155–65. doi:10.1016/j.jtrangeo.2008.11.001.
- Kompil, M., C. Jacobs-Crisioni, L. Dijkstra, and C. Lavalle. 2019. Mapping Accessibility to Generic Services in Europe: A Market-Potential Based Approach. Sustainable Cities and Society 47: 101372.
- Kurowska-Pysz, J., R.A. Castanho, and J.M. Naranjo Gómez. 2018. Cross-border Cooperation—The Barriers Analysis and the Recommendations. Polish Journal of Management Studies 17: 134–47.
- Lewczuk, J., and L. Ustinovichius. 2015. The Concept of Multi-Functional Development of Cross-Border Regions: Poland Case. Procedia Engineering 122: 65–70. doi:10.1016/j.proeng.2015.10.008.
- Marra, A.D., L. Sun, and F. Corman. 2022. The Impact of COVID-19 Pandemic on Public Transport Usage and Route Choice: Evidences from a Long-Term Tracking Study in Urban Area. Transport Policy 116: 258–68.
- Mathä, T., and L. Wintr. 2009. Commuting Flows Across Bordering Regions: A Note. Applied Economics Letters 16, no. 7: 735–8.
- Medeiros, E. 2018. Should EU Cross-Border Cooperation Programmes Focus Mainly on Reducing Border Obstacles? Documents D'Anàlisi Geogràfica 64, no. 3.
- Medeiros, E., M. Guillermo Ramírez, G. Ocskay, and J. Peyrony. 2021. Covidfencing Effects on Cross-Border Deterritorialism: The Case of Europe. European Planning Studies 29, no. 5: 962–82. doi:10.1080/09654313.2020.1818185.
- Meinherz, F., and C.R. Binder. 2020. The Dynamics of Modal Shifts in (sub)Urban Commuting: An Empirical Analysis Based on Practice Theories. Journal of Transport Geography 86: 102763.
- Miltiadou, M., E. Bouhouras, B. Socrates, G. Mintsis, and C. Taxiltaris. 2017. Analysis of Border Crossings in South East Europe and Measures for Their Improvement. Transportation Research Procedia 25: 603–15.
- Möller, C., E. Alfredsson-Olsson, B. Ericsson, and K. Overvåg. 2018. The Border as an Engine for Mobility and Spatial Integration: A Study of Commuting in a Swedish–Norwegian Context. Norsk Geografisk Tidsskrift - Norwegian Journal of Geography 72, no. 4: 217–33.
- Novotný, L. 2022. Effects of ‘Covidfencing’ on Cross-Border Commuting: A Case of Czech-German Borderland. European Planning Studies 30, no. 4: 590–607. doi:10.1080/09654313.2021.1986470.
- Novotný, L., and H. Böhm. 2022. New re-Bordering Left Them Alone and Neglected: Czech Cross-Border Commuters in German-Czech Borderland. European Societies 24, no. 3: 333–53. doi:10.1080/14616696.2022.2052144.
- Parenti, A., and C. Tealdi. 2021. Cross-Border Labour Mobility in Europe: Migration Versus Commuting. In The Economic Geography of Cross-Border Migration. Footprints of Regional Science, eds. K. Kourtit, B. Newbold, P. Nijkamp, and M. Partridge. Cham: Springer. doi:10.1007/978-3-030-48291-6_9
- Peyrony, J., J. Rubio, and R. Viaggi. 2021. The Effects of COVID-19 Induced Border Closures on Cross-Border Regions: An Empirical Report Covering the Period March to June 2020. Publications Office of the European Union. doi:10.2776/092793
- Philip, L., and F. Williams. 2019. Remote Rural Home Based Businesses and Digital Inequalities: Under-Standing Needs and Expectations in a Digitally Underserved Community. Journal of Rural Studies 68: 306–18.
- Pires, I., and F. Nunes. 2018. Labour Mobility in the Euroregion Galicia–Norte de Portugal: Constraints Faced by Cross-Border Commuters. European Planning Studies 26, no. 2: 376–95. doi:10.1080/09654313.2017.1404968.
- Renner, N., J. Miggelbrink, K. Beurskens, and A. Zitterbart. 2022. Schengen Borders as Lines That Continue to Separate? Media Representations of Pandemic Dimensions of Insecurity in Eastern German Border Regions to Poland. Journal of Borderlands Studies, doi: 10.1080/08865655.2022.2039265.
- Rietveld, P. 2012. Barrier Effects of Borders: Implications for Border-Crossing Infrastructures. European Journal of Transport and Infrastructure Research 12, no. 2. doi:10.18757/ejtir.2012.12.2.2959.
- Rosik, P., T. Komornicki, P. Duma, and S. Goliszek. 2022. The Effect of Border Closure on Road Potential Accessibility in the Regions of the EU-27. The Case of the COVID-19 Pandemic. Transport Policy 126: 188–98. doi:10.1016/j.tranpol.2022.07.008.
- Shah, T.I., A.F. Clark, J.A. Seabrook, S. Sibbald, and J.A. Gilliland. 2020. Geographic Accessibility to Primary Care Providers: Comparing Rural and Urban Areas in Southwestern Ontario. The Canadian Geographer / Le Géographe Canadien 64, no. 1: 65–78.
- Song, Y., Y. Tan, Y. Song, P. Wu, J.C. Cheng, M.J. Kim, and X. Wang. 2018. Spatial and Temporal Variations of Spatial Population Accessibility to Public Hospitals: A Case Study of Rural–Urban Comparison. GIScience & Remote Sensing 55, no. 5: 718–44.
- Spiekermann, K., and M. Wegener. 1994. The Shrinking Continent: New Time - Space Maps of Europe. Environment and Planning B: Planning and Design 21: 653–73.
- Topaloglou, L., D. Kalliora, P. Manetos, and G. Petrakos. 2005. A Border Regions Typology in the Enlarged European Union. Journal of Borderlands Studies 20, no. 2: 67–89.
- Turner, C., T. Chilla, and S. Hippe. 2022. Explaining Cross-Border Cooperation Patterns in the Context of Domestic Economic Development: A Case Study of the Upper Rhine. Europa XXI, 43. https://doi.org/10.7163/Eu21.2022.43.2.
- Verma, I., and J. Taegen. 2019. Access to Services in Rural Areas from the Point of View of Older Population—A Case Study in Finland. International Journal of Environmental Research and Public Health 16, no. 23: 4854.
- Vickerman, R., K. Spiekermann, and M. Wegener. 1999. Accessibility and Economic Development in Europe. Regional Studies 33: 1–15.
- Vincent-Geslin, S., and E. Ravalet. 2016. Determinants of Extreme Commuting. Evidence from Brussels, Geneva and Lyon. Journal of Transport Geography 54: 240–7. doi:10.1016/j.jtrangeo.2016.06.013.
- Weber, F. 2022. Cross-border Cooperation in the Border Region of Germany, France, and Luxembourg in Times of Covid-19. European Societies 24, no. 3: 354–81.
- Wiesböck, L., and R. Verwiebe. 2017. Crossing the Border for Higher Status? Occupational Mobility of East–West Commuters in the Central European Region. International Journal of Sociology 47, no. 3: 162–81. doi:10.1080/00207659.2017.1335514.