
ABSTRACT
Objective
The main goal of this work was to address craniomorphological characteristics of patients with bruxism when compared to those without bruxism using cone beam computed tomography (CBCT) imaging.
Methods
Seventy CBCT images of an equal number (n = 35) of orthodontic patients with and without bruxism (age range, 18–44 years) were retrospectively analyzed. Sagittal evaluation, mandibular shape, and skeletal asymmetry were systematically assessed in both groups.
Results
Significant differences (p < 0.05) were observed between groups for Right Articular Fossa (AF) – Axial Plane (AP) and Left AF – AP (B > NB), Right Gonial Angle (GA), Left GA, Sella-Nasion and Occlusal Plane (B < NB). Age (13%), Condyle-Gonion (18%), AF to AP (67%), and Mental-AP (16%) had the greatest impact on bruxers.
Conclusion
In this study, the CBCT 3D image showed significant differences in craniofacial morphology, particularly in the mandibular structure of bruxers compared with non-bruxers.
Introduction
Bruxism (BX) is defined as repetitive activity of the masticatory muscles (MMA), which is clinically characterized by clenching and grinding of the teeth and/or by contraction, immobilization (“bracing”), and projection of the jaw during sleep (sleep BX) or wakefulness (awake BX) [Citation1,Citation2]. This motor exacerbation may affect the stomatognathic system [Citation2–5].
The estimated prevalence of BX varies from 8% to 30% in the adult population and occurs predominantly among females [Citation2,Citation5–7, Citation42]. However, the prevalence of awake BX in adults is around 20–30% [Citation6–8], while the sleep BX range oscillates between 8% and 15% [Citation6–9]. While debate regarding BX as a behavior or a pathological issue remains without definitive conclusions, some authors defend an adaptive reason based on morphological studies showing a dynamic change, arguably adaptive, to such motor phenomena [Citation10]. However, several studies have also shown a deleterious role by which BX may cause changes that eventually cause harm in both hard and soft tissues [Citation11–13, Citation46].
From a histopathological point of view, Brotto and Bonewald [Citation14] reported a mechanical and biochemical interaction between bone and muscle, proposing that overload influences not only bone remodeling but also muscle mass through the secretion of muscle regulatory factors that play a role in muscle development by increasing function and repair. Consolaro [Citation15] highlighted the importance of functional demands in the adaptive, reactional, and/or reparative capacity of the periosteum and osteocytes in determining bone morphology.
As several controversial issues remain within this topic, many studies have sought to evaluate mandibular bone changes in patients with BX [Citation13,Citation16, Citation44]. Using panoramic radiographic images, Rahmi et al. [Citation16], observed bone remodeling in the inferior and posterior borders of the mandibular angle with important correlations that only existed in patients with BX when compared to patients without. Further, Padmaja Satheeswarakumar et al. [Citation13], using the same methods, evaluated changes in the mandibular surface area, condyle, and coronoid process in patients with and without BX. Only in patients with BX did the condylar and coronoid processes show significant changes; however, there was no difference in the overall surface area. Gulec et al. [Citation17] recently investigated the effect of BX on mandibular bone trabeculae using fractal dimensional analysis of panoramic radiographs in three mandibular regions: condyle, mandibular angle, and the apical mandibular region between the second premolar and the first molar. The authors concluded that there was a difference in the trabecular bone in the condylar area, suggesting that mechanical stress on the mandibular condyle could initiate morphological changes.
Colonna et al. [Citation18] studied the effects of joint overload on condylar remodeling and compared the morphology of the temporomandibular joint (TMJ) in patients with and without temporomandibular disorder (TMD) using cone-beam computed tomography (CBCT) in a three-dimensional (3D) volumetric study. Their results suggested an association between TMD and certain craniofacial morphological features, such as increased condylar and gonial angle volumes, compared with the control group [Citation18,Citation42].
Cephalometry from CBCT is a powerful diagnostic tool with several advantages: true 3D evaluation of the hard and soft tissues of the head at full size (1:1 scale), real-time 3D cephalometric analysis, no overlap of anatomical structures, high accuracy and reliability [Citation19,Citation20], obtaining volumetric measurements and 3D reconstruction, and lower radiation dose when compared to fan-beam computed tomography (FBCT) [Citation19,Citation21]. Thus, CBCT allows for a more accurate evaluation of craniofacial structures and anatomical details of the TMJ. It is also the most suitable examination for the detailed analysis of mineralized tissues [Citation22].
Some studies [Citation13,Citation16,Citation17] have evaluated linear or angular craniofacial parameters using two-dimensional (2D) imaging to identify skeletal cephalometric features associated with TMJ disorders and BX. However, only a few studies have used 3D cephalometric analysis with CBCT and condylar morphology with volumetric evaluation. The clinical application of the volumetric study allows for the evaluation of pathologies affecting the TMJ as well as possible remodeling and quantification of actual volume. Using potential changes in condylar morphology in cases of BX overload, CBCT is the imaging modality of choice for the evaluation of bone tissues and TMJ components [Citation23]. Another CBCT evaluation parameter is asymmetry, which confirms that occlusal characteristics can be related to the remodeling of TMJ structures, creating asymmetrical relationships [Citation24–27].
This study aimed to evaluate the craniomorphological characteristics frequently observed in patients with BX by using CBCT images.
Materials and methods
Subjects
The present case–control study included CBCT scans from 70 patients. The diagnosis of BX was assumed whenever it was probable [Citation1]. All scans were previously acquired for orthodontic purposes under the same protocol: field of view (FOV) of 17.0 × 22.0 cm, spatial resolution (voxel dimension) of 0.4 mm, and acquired by an ICAT Next Generation Cone-Beam CT scanner (Imaging Science International, Hatfield, PA, USA) at an exposure time of 8.9 s, operating at 18.5 mA and 120 kVp. For sample calculation, an acceptable correlation coefficient of 0.5 was expected, close to that found in the literature of −0.516 [Citation18]. With a power of 80% and alpha (α) of 0.05, a sample of 20 individuals would be required to achieve this end, using Pearson’s correlation test for the analysis.
The bruxer (B) and non-bruxer (NB) images consisted of CBCT scans of adult subjects aged 18 to 44 years obtained from the database of the company Solutions 3D and the Ertty Orthodontic Institute, both based in Brazil, and underwent an initial evaluation in which the inclusion and exclusion criteria were evaluated. The patients from whom the sample images were collected followed the non-instrumental evaluation criteria and the grading system proposed by Lobbezoo et al. [Citation28], to determine the probability that a BX evaluation yields a valid result.
To be included in the study, CBCT images had to be of good quality, as previously obtained from patients with the following characteristics:
Age from 18 to 44 years.
Having at least 20 permanent teeth and posterior occlusal contacts.
Having at least one of the following clinical characteristics: hypertrophy of the masseter and/or temporalis muscles, indentations on the tongue or lip and/or an alba line on the inner cheek, hard tissue damage: fractured teeth, wear facets, or repeated failures of restorative work, and patient or informant self-report of the presence of BX.
CBCT images of individuals were excluded from the study due to the following reasons: carriers of mono or bimaxillary total prosthesis, individuals with unit or bilateral absence of posterior support, individuals with an image of extensive degenerative TMJ alterations, submitted to major orthognathic or buccomaxillofacial surgery, individuals with a history of facial injuries and/or surgeries, or individuals with images that did not allow qualitative and quantitative analysis. Images that had been previously selected, but during the import process into the analysis software showed operational incompatibility, were also excluded.
Study protocol
CBCT images were collected according to the clinical diagnosis criteria described in the current literature [Citation1, Citation7, Citation28] and divided into two groups: bruxers (B, n = 35) and non-bruxers (NB, n = 35). In this study, the examining radiologist was blinded.
CBCT images acquisition protocol
The patients were positioned in a sitting position with the chin supported, the Frankfort plane parallel to the horizontal plane, and the median sagittal plane perpendicular to it, with the head immobilized to minimize the production of artifacts by movements during image acquisition. The teeth were at maximum habitual intercuspation (MHI) with the lips at rest.
The images were archived in Digital Imaging and Communications in Medicine (DICOM) format and were processed in a single center using the Solutions 3D version 5.0 program developed by CDT Software (Bauru-Brazil) for the evaluation of cranial morphological characteristics, obtained by the SYM protocol. For volumetric evaluations of the mandibular condyles and upper airways, DICOM image files were exported to the ITK-SNAP 3.4.0 software (University of North Carolina, Chapel Hill, NC, USA) [Citation29].
Craniomorphological assessment
Cranial morphological measurements were obtained using the SYM Protocol for 3D diagnosis of CBCT performed by the company Solutions 3D (Analysis Craniofacial LTDA) [Citation30]. The variables studied were as follows: Sagittal evaluation (SNA, SNB, ANB (NA-A); (Po-Or) and (Pt-Gn); (Ba-Na), and (Na-Pg); (Po-Or) and S–N ocl, Me-plane (PM-XiR1); (PM-R1-DC) (PM-XiL1); (XiL1-DC); mandibular shape (GoR-Me, GoL-Me, CondR-GoR, CondL-GoL, AngleGoR, AngleGoL, ArticularFossaR-PlAxial, and ArticularFossaL-PlAxial).
The volumetric variables of the condyle and upper airways were obtained directly from the CBCT DICOM file and evaluated using the software ITK-SNAP 3.4.0, in the Radiology Clinic of the ICT-UNESP on a computer with a 19-inch LCD screen monitor. The evaluator was calibrated by analyzing 15% of the sample, which was repeated 15 days later until agreement was obtained by statistical tests. The images were analyzed with appropriate lighting. When necessary, images were adjusted to improve contrast, brightness, and zoom at the evaluator’s acuity. In each session, only 10 images were analyzed to avoid measurement errors due to visual fatigue of the evaluator.
Radiographic parameters
Sagittal and axial maxillomandibular assessments
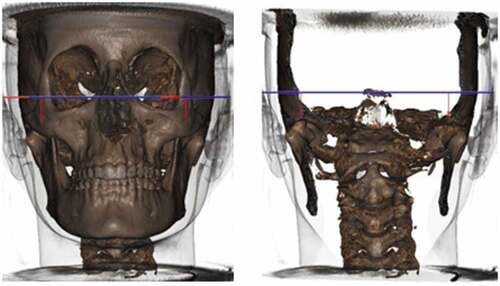
This analysis allowed the calculation of the linear discrepancy between points A and B (SNA-SNB) to quantify the true maxillomandibular discrepancy in the anteroposterior direction (skeletal Class I, Class II, or Class III). Negative values demonstrate a posterior maxilla relative to the mandible ().
Figure 1. Imaging and measurements obtained by SYM 3D Protocol assessing maxillomandibular sagittal and axial discrepancy to A-B point.
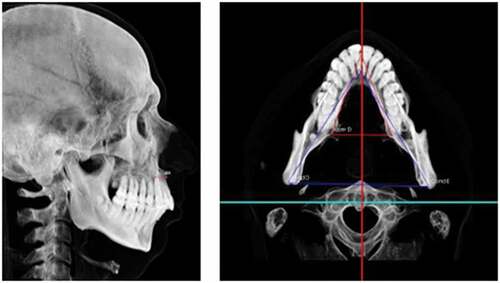
Sagittal assessment
According to this analysis, skeletal and soft-tissue contours can be observed. With the axial plane parallel to the ground, an anteroposterior relationship between the maxilla and mandible (skeletal Class I, Class II, and Class III) was observed. The greater the divergence between the planes, the greater the tendency toward Class II due to clockwise mandibular rotation. Therefore, this evaluation allowed confirmation of the facial biotype, showing the patient to be vertical, horizontal, or medial ().
Figure 2. Images and measurements obtained by the SYM 3D protocol evaluating the sagittal relationship between the maxilla and mandible.
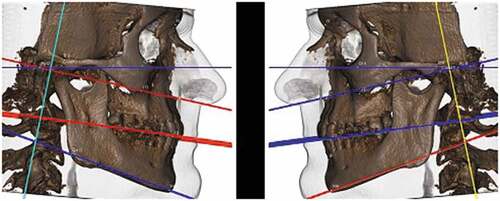
Morphological evaluation of gonial angle
This evaluation allowed the observation of possible morphological changes in the mandible concerning the angle between the mandibular ramus and body, comparing the right and left sides. Possible facial asymmetries can be observed due to morphological changes, and not only due to changes in the size of the facial skeleton. Later, these data were compared to the mandibular craniometric evaluation ().
Figure 3. Images and measurements obtained by the SYM 3D protocol evaluating the morphology of the gonial angle.
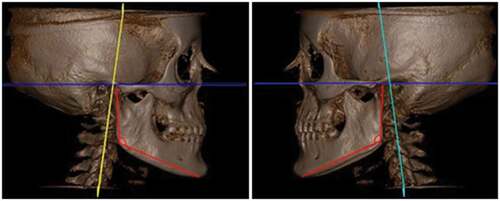
Mandibular craniometric evaluation
This assessment allowed the length of the right and left mandibular bodies and branches to be evaluated. When interpreting these factors (), it is essential to observe possible changes in mandibular length concerning the mandibular body and ramus and to compare the right and left sides. Possible facial asymmetries can be observed due to growth and morphological, muscular, and/or mandibular posture alterations.
Figure 4. Images and measurements obtained using the SYM 3D protocol that allows mandibular craniometric evaluation.
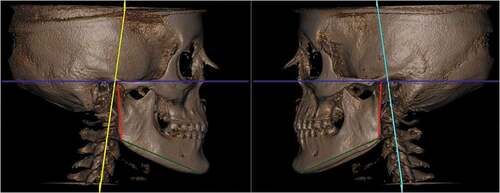
Articular fossa to axial plane
This evaluation allowed the observation of possible compensation for the asymmetric growth of the mandibular branches. Some mandibular asymmetries can be compensated for in this condyle-articular fossa relationship, without leading to greater deviations in the center of the mandible ().
Figure 5. Image and measurements obtained by the SYM 3D protocol that allows the evaluation of Articular Fossa to Axial Plane (Articular Fossa-Pl. Axial).
Condylar volume
All measurements from condyle volume bilaterally and all images were exported in DICOM format to ITK-SNAP software version 3.4.0 [Citation29], in which volume was calculated through semi-automatic segmentation (in voxels per cubic millimeter) [Citation23,Citation31–34].
To standardize the limits of anatomical structures, the occlusal plane was initially adjusted parallel to the axial line of orientation of the multiplanar reconstruction (MPR) window by the coronal slice, to be parallel to the horizontal plane, to the lower limit of the coronal window.
In the ITK-SNAP software, an automatic segmentation tool was selected, which made it possible to limit the region of interest (ROI) to the axial, sagittal, and coronal windows, where the condyle was limited. For inferior delimitation of the condyle, in the most central sagittal section of the TMJ, the inferior plane of the ROI that touched the mandibular notch was considered.
Once the ROI corresponding to the condyle was obtained, automatic segmentation began through “bubbles” inside the condyle. As this structure is involved in the cortical bone and its lower limit was delimited, as explained above, the increasing development of the implanted bubbles, which occurs by similarity of voxel values, was limited to the TMJ structure within the ROI (i.e., the condyle, generating the volumetry and statistical data referring to the value of this volume in cubic millimeters).
The process was performed on the right condyle and repeated on the left side following the same methodology.
Upper airway volume
The upper airway volume and all images were exported in DICOM format to the ITK-SNAP software version 3.4.0 [Citation29], in which the volume was calculated using semi-automatic segmentation (in voxels per cubic millimeter) [Citation35].
To standardize the limits of anatomical structures, the occlusal plane was initially adjusted parallel to the axial line of the orientation of the MPR window by the coronal slice, to be parallel to the horizontal plane, i.e., to the lower limit of the coronal window. Likewise, in the ITK-SNAP software, an automatic segmentation tool was selected, which made it possible to limit the ROI in the axial, sagittal, and coronal windows, which was limited to the upper airway. For the inferior delimitation of the upper airway, in the most central sagittal section of the oropharynx, the inferior plane of the ROI touching the vertex of the hyoid bone and the superior plane touching the posterior nasal spine were considered [Citation35].
The automatic segmentation process by “bubbles” was performed to obtain the ROI corresponding to the upper airway. As this structure is surrounded by the cortical bone and its lower limit was delimited, as explained above, the increasing development of the implanted bubbles, which occurs due to the similarity of voxel values, was limited to the structure of the upper airway within the ROI.
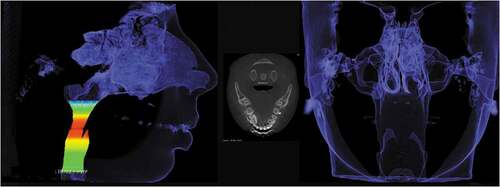
The process was performed on the right upper airway and repeated on the left side following the same methodology ().
Figure 6. Image on the upper airway dimensions and respective boundaries.
Statistical analysis
In the descriptive phase, the data were consolidated and presented as mean ± standard deviation and expressed as percentages. The verification of possible typing errors of the raw data was carried out through the distribution of frequencies in the SPSS 13.0 program by the researcher throughout the research data collection process.
The collected data were subjected to exploratory analysis using the mean, standard deviation, minimum, median, maximum, frequency, and percentage. To compare groups with respect to sex, the chi-square test was used. In other parameters, the groups were compared using the Mann–Whitney test. The correlation of age with the angle ANB, condylar volume, and upper airway volume was evaluated using the Mann–Whitney test. Multiple logistic regression was used to evaluate the parameters that together altered the likelihood of BX.
Ethical consideration
Data collection and respective analysis were approved by the research ethical committee of the Institute of Science and Technology, São José dos Campos under protocol CAAE 17729419.2.0000.0077. All patients gave informed consent for the present study.
Results
Seventy subjects participated in the study: 35 (50%) with BX and 35 (50%) without BX. The descriptive measures of each variable were studied by group, and the results were compared between the groups. There was no significant difference between the groups in terms of sex; 62.9% of the group with BX and 68.6% of the group without BX were female (p = 0.801). The group with BX, with a mean age of 39.5 years, was older than the group without BX, with a mean age of 29.1 years (p = 0.001).
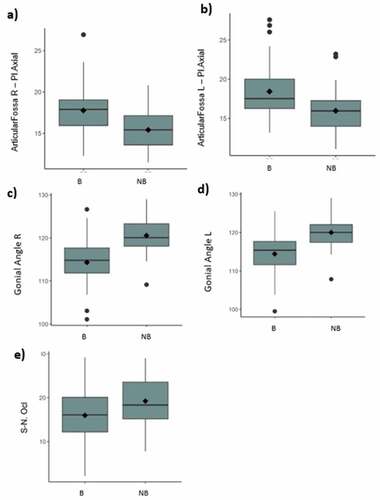
In the 3D symmetry analysis, statistically significant differences were observed between the groups for articular fossa-Pl, axial right and left (B > NB), and right and left gonial angle (B < NB).
Considering skeletal relationship factors, a statistically significant difference was observed between the S and N groups Ocl (B < NB) (-).
Figure 7. (a-e) – Boxplot of parameters that show statistically significant differences between groups (a. Right Articular Fossa – Axial Plane; b. Left Articular Fossa – Axial Plane; c. Right Gonial Angle; d. Left Gonial Angle; e. Sella – Nasion Occlusal Plane).
shows the comparison between sexes concerning the condylar volume and upper airway volume parameters. There were no statistically significant differences between sexes.
Table 1. Comparison between sexes (Mann–Whitney test).
In addition to the comparison between the groups with and without BX concerning condylar and airway volume, there is interest in evaluating whether sex and age influence this comparison; therefore, logistic regression models were adjusted for age and sex. From these models, no significant difference was observed between the groups with or without BX in relation to the condylar volume R (p = 0.956), condylar volume L (p = 0.740) and airway volume (p = 0.227).
To assess which parameters together had the greatest influence on the chance of BX, a logistic regression model with a selection of stepwise variables was adjusted. From this model, it was observed that age, Cond–Go, and articular fossa-PI, Axial, and Me-Pl axial influence the chance of BX, as shown in .
Table 2. Multiple logistic regression for bruxism. Factor OR IC 95% (OR) p-value.
Keeping the measurements Cond–Go, articular fossa-PI axial (articular fossa to axial plane) and Me-Pl axial fixed, an increase in age of one year increased the chance of BX by 13%. Similarly, fixing age, articular fossa (PI) axial (articular fossa to axial plane), and Me-fixed axial plane, an increase of one unit in Cond-Go increased the chance of BX by 18%. Fixing age, Cond–Go, and Me-Pl axial, an increase in one unit of measure in the articular fossa-PI axial (articular fossa to axial plane) increased the chance of BX by 67%. Finally, by keeping age, Cond–Go, and articular fossa-PI axial (articular fossa to axial plane) fixed, an increase of one in the unit of measure in Me-Pl axial reduced the risk of BX by 16%.
Patients were classified into Classes I, II, and III on the ANB to compare VAS volume. To classify patients, Class I = 2 ≥ ANB ≥ 3, Class II = ANB ≥ 3, and Class III = ANB ≤ 2 were considered. Thus, 15 patients presented with Class I, 40 with Class II, and 15 with Class III. There was no statistically significant difference in upper airway volume between the classes (p = 0.234; Kruskal–Wallis test). The median airway volume in Class I was 16630000 mm3; in Class II, it was 14180000 mm3; and in Class III, it was 11150000 mm3.
Discussion
BX has a multifactorial etiology and may be associated with psychosocial, pathophysiological, peripheral, and central factors [Citation43]. In the current literature, these etiological factors remain controversial. However, due to its growing prevalence in the adult population, BX has now been widely studied regarding its etiological aspects and consequences.
The most cited consequences are dental wear, fractures, orofacial pain, and headaches [Citation45]. Through the association of contributing and perpetuating factors, such as facial biotype, occlusal interferences, obstructive sleep apnea, insomnia, and postural changes, some of which may also be causal factors, BX can lead to clinical consequences that are often disabling. Studies point to craniofacial alterations as possible causal factors; however, these alterations may be correlated to BX as possible consequences of it [Citation6–9]. The study of these craniofacial alterations makes it possible to select the best therapeutic options, given that some of these treatments can also have skeletal consequences.
Many authors have correlated the craniofacial anatomical features of adults with BX. This is due to the assertion that prolonged and constant loads associated with BX can promote changes in bone morphology [Citation13,Citation17] and/or lead to the damage of tissue structures [Dias et al., 2020; Citation11–13]. Based on this premise, this study aimed to evaluate cranial skeletal differences in patients with BX. Statistically significant changes were observed in the following variables: articular fossa right- and left-Pl axial, right and left gonial angle, and S-N ocls in patients with BX. Measurements were evaluated using CBCT.
Rahmi et al. [Citation16] observed a decreased gonial angle in panoramic radiographs in individuals with BX, which may be associated with the insertion of the masseter and medial pterygoid muscles. Evaluating tomography in a 3D study, a similar result was observed here, where the right and left gonial angles were smaller in individuals with BX than in individuals without BX. Corroborating these data, Padmaja Satheeswarakumar et al. [Citation13], in a study of 2D images evaluated by software and trained dentists, found a decrease in the same angle.
Within this study, condylar volume did not change in individuals with or without BX. Unlikely, Padmaja Satheeswarakumar et al. [Citation13] found significant changes in the condylar area in bruxers when compared with a control group, despite the methodology used, since for this evaluation, the authors used 2D images. Consistent with the presented results, Yamada et al. [Citation36], observed an association between condylar change and “parafunctional” habits and concluded that the greater the intensity and frequency of the muscular activity, the greater the risk of developing condylar changes and TMJ degeneration.
This association was also observed by Dias et al. [Citation11], in individuals with sleep BX, where degenerative changes were addressed using CBCT and the consequent modifications in the shape and degeneration of the condyle. Colonna et al. [Citation18] also mentioned this possible relationship. They observed a reduction in condylar volume in patients with TMD and supported the hypothesis of a correlation between low condylar volume, hyperdivergence, and TMD [Citation42, Citation47, Citation48]. The authors suggested that this alteration could be associated with condylar adaptation. Baad-Hansen et al. [Citation37] concluded that painful symptoms caused by BX may precede TMD pain, owing to the association of BX with musculoskeletal signs and symptoms.
Regarding dental hyperdivergence, a statistically significant difference (p = 0.030) was observed in the S-N variable ocls between bruxers and non-bruxers, where the values found in the group with BX were lower than those in the group without. This variable shows the trends of Classes I, II, and III. Class I individuals tend to have an occlusal plane parallel to the S.N plane; in Class II, the occlusal plane diverges in the anterior region by rotating the occlusal plane clockwise (hyperdivergent); and in Class III, the occlusal plane diverges in the posterior region by rotating it counterclockwise (hypodivergent). Although in both groups, the mean values were higher than the standard, as defined in the literature [Citation30], in the group with BX presented in this work, values were lower than those of non-bruxers. This may suggest that, due to dental occlusal wear, which is often present in individuals with BX, there is a decrease in this angle [Citation38].
In the current study, the ANB angle used for skeletal malocclusion in Classes I, II, and III was not significantly different between individuals with and without BX. When an alteration of the occlusal plane in relation to S.N is observed, but not on bone bases, it suggests a possible adaptation to other structures. A divergence of presented results compared to those from the established literature possibly occurred due to an adaptation of other structures, such as the decreased gonial angle and the altered articular fossa-Pl axial in the group with BX (p = 0.001).
The assessment of the articular fossa–Pl axial (articular fossa to axial plane) allows verification of the existence of some compensation of the branches of the mandible in the face of growth alterations and functional loads or overloads due to bruxism activity. However, this variable allows the evaluation of possible compensation for asymmetrical growth without leading to greater deviations in the center of the mandible. Higher values were observed on both the right and left sides in the group with BX than in the group without BX. The articular fossa – Pl axial (articular fossa to axial plane) measurement is directly related to the condition of the condyle. As no changes in condylar volume were observed in this study, there was potential compensation in the articular fossa-Pl axial (articular fossa to axial plane) measurement in patients with BX.
The volume of the upper airway was evaluated in this study, as many authors in the current literature suggest that sleep BX is correlated with obstructive sleep apnea (OSA) as a protective factor. As the air volume in these individuals is reduced [Citation39], authors searched for a possible correlation between upper airway volume and BX. Further, studies such as those by El and Palomo [Citation35] correlated upper airway volume with different skeletal malocclusions and found a lower upper airway volume in Class II patients, a characteristic that, in the literature, presents a greater predisposition to OSA. However, no statistically significant relationship was observed between this variable and groups with and without BX. This finding corroborates the values found in the same study regarding the ANB measure, where authors also did not observe significant differences between the groups. However, the value found for the median volume of the upper airway in Class III and Class II was lower than that of individuals in Class I (11150000, 14180000, and 16630000 mm3, respectively), which suggests that skeletal relationships may interfere with the volume of the upper airway and the pattern of individuals.
According to Ozturk et al. [Citation40], skeletal characteristics vary among individuals, and the mandibular morphology in adult individuals of both sexes does not change with increasing age. The same was observed in the present study, where no statistically significant difference was observed between the groups with and without BX [p = 0.801]. This information is also extremely important when evaluating the composition of the sample in this study, and it shows that, regardless of sex, the results are validated. Ghaffari et al. [Citation41], did not observe a statistically significant difference between males and females. However, the mandibular angle measurement and branch width observed by the authors were greater in females than in males.
Longitudinal studies on craniofacial skeletal changes in adults over time are particularly lacking as a reference for normative values used in studies that present functional alterations in the studied sample. Only cross-sectional studies, such as those by Ghaffari et al. [Citation41] and Ozturk et al. [Citation40], were conducted for this purpose. Given the studies performed thus far, it is not suggested that age directly interferes with the morphological characteristics of the mandible in healthy patients. The changes seen appear to be due to tooth loss and loss of masticatory function. Moreover, age alone is known to play only a minor role in these changes [Citation40]. Based on these findings, it can be inferred that the sample selected for this study was not influenced by age and that age did not affect the results obtained in individuals with or without BX.
Conclusion
In the present study, the CBCT 3D images showed significant differences in some features of the craniofacial morphology of bruxers compared with non-bruxers. The mandibular structures of the articular fossa–Pl axial and gonial angles revealed a statistically significant difference between groups with and without BX. The gonial angle, which is the region of insertion of the masseter, was smaller in the BX group than in the control group. Regarding condylar volumetry, no statistically significant differences were observed between the groups, i.e., BX did not influence the morphology of the mandibular head, nor did it influence the facial biotype. BX also influenced the sagittal aspect and the inclination of the occlusal plane, observed through the reduction of the S-N ocl angle.
There was no correlation between the possible differences in the upper airway and condylar volumes in patients with BX. Although not significant, when comparing upper airway volume with skeletal malocclusion, there was a smaller volume in Class III and Class II patients in both groups.
Disclosure statement
No potential conflict of interest was reported by the author(s).
Additional information
Funding
References
- Lobbezoo F, Ahlberg J, Raphael KG, et al. International consensus on the assessment of bruxism: report of a work in progress. J Oral Rehabil. 2018;45(11):837–844.
- Lobbezoo F, Rompré PH, Soucy JP, et al. Lack of associations between occlusal and cephalometric measures, side imbalance in striatal D2 receptor binding, and sleep-related oromotor activities. J Orofac Pain. 2001;15(1):64–71.
- Busanello-Stella AR, Berwig LC, Almeida FL, et al. Aspects of bruxers stomatognathic system [Aspectos do Sistema Estomatognático de indivíduos bruxistas]. Salusvita. 2011;30(1):7–20.
- Cesar GM, Tosato JP, Gonzalez TO, et al. Cervical posture and occlusal classes in bruxers and asymptomatic TMD patients. [Postura Cervical e Classes Oclusais em Bruxistas e Indivíduos Assintomáticos de DTM]. Revista de Odontologia da Universidade Cidade de São Paulo. 2006;18(2):155–160.
- Lavigne GJ, Khoury S, Abe S, et al. Bruxism physiology and pathology: an overview for clinicians. J Oral Rehabil. 2008;35(7):476–494.
- Manfredini D, Winocur E, Guarda-Nardini L, et al. Epidemiology of bruxism in adults: a systematic review of the literature. J Orofac Pain. 2013;27(2):99–110.
- Manfredini D, Colonna A, Bracci A, et al. Bruxism: a summary of current knowledge on aetiology, assessment and management. Oral Surg. 2020;13(4):358–370.
- Câmara-Souza MB, Carvalho AG, Figueredo OMC, et al. Awake bruxism frequency and psychosocial factors in college preparatory students. CRANIO®. 2020;14:1–7. Epub ahead of print. DOI:10.1080/08869634.2020.1829289
- Maluly M, Andersen ML, Dal-Fabbro C, et al. Polysomnographic study of the prevalence of sleep bruxism in a population sample. J Dent Res. 2013;92(7 Suppl):97S–103S.
- Ramfjord SP. Bruxism, a clinical and electromyographic study. J Am Dent Assoc. 1961;62(1):21–44.
- Dias GM, Bonato LL, Guimarães JP, et al. A study of the association between sleep bruxism, low quality of sleep, and degenerative changes of the temporomandibular joint. J Craniofac Surg. 2015;26(8):2347–2350.
- Manfredini D, Cantini E, Romagnoli M, et al. Prevalence of bruxism in patients with different research diagnostic criteria for temporomandibular disorders (RDC/TMD) diagnoses. CRANIO®. 2003;21(4):279–285.
- Padmaja Satheeswarakumar L, Elenjickal TJ, Ram SKM, et al. Assessment of mandibular surface area changes in bruxers versus controls on panoramic radiographic images: a case control study. Open Dent J. 2018;12(1):753–761. e-Collection 2018.
- Brotto M, Bonewald L. Bone and muscle: interactions beyond mechanical. Bone. 2015;80:109–114.
- Consolaro A. Inflammation and repair: clinical understanding and therapeutic implications. [Inflamação e Reparo: um silabo para compreensão clínica e implicações terapêuticas]. 2nd ed. Maringá: Dental Press; 2015.
- Rahmi E, Rikmasari R, Soemarsongko T. Open science index. Med Health Sci. 2017;11(10).
- Gulec M, Tassoker M, Ozcan S, et al. Evaluation of the mandibular trabecular bone in patients with bruxism using fractal analysis. Oral Radiol. 2020;37(1):36–45. Epub ahead of print.
- Colonna A, Manfredini D, Lombardo L, et al. Comparative analysis of jaw morphology and temporomandibular disorders: a three-dimension imaging study. CRANIO®. 2020;38(3):158–167.
- Barghan S, Tetradis S, Mallya S. Application of cone beam computed tomography for assessment of the temporomandibular joints. Aust Dent J. 2012;57(1):109–118.
- Jiang H, Li C, Wang Z, et al. Assessment of osseous morphology of temporomandibular joint in asymptomatic participants with chewing-side preference. J Oral Rehabil. 2015;42(2):105–112.
- Vallaeys K, Kacem A, Legoux H, et al. 3D dento-maxillary osteolytic lesion and active contour segmentation pilot study in CBCT: semi-automatic vs manual methods. Dentomaxillofac Radiol. 2015;44(8):20150079.
- Krishnamoorthy B, Mamatha N, Kumar VA. TMJ imaging by CBCT: current scenario. Ann Maxillofac Surg. 2013;3(1):80–83.
- Méndez-Manjón I, Haas OL Jr, Guijarro-Martínez R, et al. Semi-automated three-dimensional condylar reconstruction. J Craniofac Surg. 2019;30(8):2555–2559.
- Rodrigues AF, Vitral RWF. Applications of computed tomography in dentistry. [Aplicações da tomografia computadorizada na odontologia]. Pesq Bras Odontoped Clin Integr. 2007;7(3):317–324.
- Roque-Torres GD, Peyneau PD, Dantas da Costa E, et al. Correlation between midline deviation and condylar position in patients with Class II malocclusion: a cone-beam computed tomography evaluation. Am J Orthod Dentofacial Orthop. 2018;154(1):99–107.
- Vitral RW, Telles Cde S. Computed tomography evaluation of temporomandibular joint alterations in Class II division 1 subdivision patients: condylar symmetry. Am J Orthod Dentofacial Orthop. 2002;121(4):369–375.
- Vitral RW, Fraga MR, de Oliveira RS, et al. Temporomandibular joint alterations after correction of a unilateral posterior crossbite in a mixed-dentition patient: a computed tomography study. Am J Orthod Dentofacial Orthop. 2007;132(3):395–399.
- Lobbezoo F, Ahlberg J, Glaros AG, et al. Bruxism defined and graded: an international consensus. J Oral Rehabil. 2013;40(1):2–4.
- Yushkevich PA, Piven J, Hazlett HC, et al. User-guided 3D active contour segmentation of anatomical structures: significantly improved efficiency and reliability. Neuroimage. 2006;31(3):1116–1128.
- Pinho S. Deeds 3D e o Protocolo SYM 3D – diagnóstico 3D do estado de equilíbrio dentofacial por simetria. Rio de Janeiro: Biblioteca Nacional. 2017;47.
- Costa AL, Yasuda CL, Nahás-Scocate ACR. Use of free software for visualization and 3D image analysis in dentistry [Utlização de softwares livres para visualização e analise de imagens 3D na Odontologia]. Rev Assoc Paul Cir Dent. 2016;70(1):76–81.
- Gomes AF, Nejaim Y, Brasil DM, et al. Assessment of volume and height of the coronoid process in patients with different facial types and skeletal classes: a cone-beam computed tomography study. J Oral Maxillofac Surg. 2015;73(7):1395.e1–5.
- Loiola MEA, Fuziy A, Higa RH, et al. In vivo three-dimensional cephalometric landmarks using CBCT for assessment of condylar volume and surface in individuals with Class I, II, and III malocclusions. CRANIO®. 2020;9:1–6. Online ahead of print. DOI:10.1080/08869634.2020.1857616
- Lopes SL, Costa AL, Gamba TO, et al. Lateral pterygoid muscle volume and migraine in patients with temporomandibular disorders. Imaging Sci Dent. 2015;45(1):1–5.
- El H, Palomo JM. Airway volume for different dentofacial skeletal patterns. Am J Orthod Dentofacial Orthop. 2011;139(6):e511–21.
- Yamada K, Hanada K, Fukui T, et al. Condylar bony change and self-reported parafunctional habits in prospective orthognathic surgery patients with temporomandibular disorders. Oral Surg Oral Med Oral Pathol Oral Radiol Endod. 2001;92(3):265–271.
- Baad-Hansen L, Thymi M, Lobbezoo F, et al. To what extent is bruxism associated with musculoskeletal signs and symptoms? A systematic review. J Oral Rehabil. 2019;46(9):845–861.
- Manfredini D, Stellini E, Marchese-Ragona R, et al. Are occlusal features associated with different temporomandibular disorder diagnoses in bruxers? CRANIO®. 2014;32(4):283–288.
- Schwab RJ, Pasirstein M, Pierson R, et al. Identification of upper airway anatomic risk factors for obstructive sleep apnea with volumetric magnetic resonance imaging. Am J Respir Crit Care Med. 2003;168(5):522–530.
- Ozturk CN, Ozturk C, Bozkurt M, et al. Dentition, bone loss, and the aging of the mandible. Aesthet Surg J. 2013;33(7):967–974.
- Ghaffari R, Hosseinzade A, Zarabi H, et al. Mandibular dimensional changes with aging in three dimensional computed tomographic study in 21 to 50 year old men and women. 3dj. 2013;2(1):7–12.
- Gesch D, Bernhardt O, Kocher T, et al. Association of malocclusion and functional occlusion with signs of temporomandibular disorders in adults: results of the population-based study of health in Pomerania. Angle Orthod. 2004;74(4):512–520.
- Lobbezoo F, Naeije M. Bruxism is mainly regulated centrally, not peripherally. J Oral Rehabil. 2001;28(12):1085–1091.
- Miller VJ, Yoeli Z, Barnea E, et al. The effect of parafunction on condylar asymmetry in patients with temporomandibular disorders. J Oral Rehabil. 1998;25(9):721–724.
- Okeson JP. The classification of orofacial pains. Oral Maxillofac Surg Clin North Am. 2008;20(2):133–144.
- Raphael KG, Santiago V, Lobbezoo F. Is bruxism a disorder or a behaviour? Rethinking the international consensus on defining and grading of bruxism. J Oral Rehabil. 2016;43(10):791–798.
- Thilander B, Rubio G, Pena L, et al. Prevalence of temporomandibular dysfunction and its association with malocclusion in children and adolescents: an epidemiologic study related to specified stages of dental development. Angle Orthod. 2002;72(2):146–154.
- Zuaiter S, Robin O, Gebeile-Chauty S, et al. Does dental Class II division 2 predispose to temporomandibular disorders? Orthod Fr. 2013;84(3):277–285. French.