
 ?Mathematical formulae have been encoded as MathML and are displayed in this HTML version using MathJax in order to improve their display. Uncheck the box to turn MathJax off. This feature requires Javascript. Click on a formula to zoom.
ABSTRACT
In the estimation, using confidence intervals, of quantiles and reliability of the two – parameter exponential distribution based on record data, a pivot is defined and its exact cumulative distribution function and probability density function are computed. Confidence intervals using critical values from the cumulative distribution function of the pivot are obtained. Applications to crushed rock sizes and concentration of Sulfur dioxide from Long Beach, California.
1. Introduction
Reliability in the engineering context refers to the probability that an item functions without failure for a specified amount of time. Reliability is related to the time during which an operation on products such as light bulbs, car engines, or computers, is successful. The lifetime of a product is a nonnegative, continuous random variable T with probability density function The reliability function is defined as
. Reliability measures the conformity of the products to required standards.
Several probability distributions are used in the statistical study of reliability. Among them is the two-parameter exponential distribution whose probability density function, cumulative distribution function, and reliability function are
where is the threshold parameter and
the scale parameter. In order to obtain simple bounds of reliability in the two-parameter exponential distribution, Grubbs (Citation1971) showed that the reliability function is fiducially distributed as a function of a weighted sum of two chi-squared random variables. Fiducial inference is based on the assumption that the parameter is a random variable whose probability distribution, called fiducial distribution, is to be found for fixed sample values. The fiducial distribution is used to compute a confidence interval including the parameter with probability (1-α). Grubbs (Citation1971) approximated the distribution of the weighted sum and its fiducial bounds. Engelhardt and Bain (Citation1978) improved the approximate analytical confidence bounds and wrote them explicitly. Lawless (Citation2003) used simulation to obtain quasi-exact confidence bounds for reliability and quantiles in the two-parameter exponential distribution. Roy and Mathew (Citation2005) used general confidence intervals to obtain simulation-based confidence bounds. Fernandez (Citation2007), developing on Roy and Mathew (Citation2005), expressed the distribution for a modified pivotal quantity related to reliability. Paolino (Citation2010) pursued using a standard pivotal quantity.
I address interval estimation of reliability and quantiles of the two-parameter exponential distribution based on upper records. Chandler (Citation1952) consider an infinite sequence of independent and identically distributed random variables. A record is called an upper record if its value exceeds all previous observations:
for all
. I assume that
occurs at time
. The record time sequence is defined as
and
. The upper record value sequence
is defined as
n = 0, 1, 2,… Arnold et al. (Citation1998) give the theory and applications of records. Inference about reliability based on records for exponential probability distributions is in Wang and Shi (Citation2013).
In section 2, I define the two-parameter exponential model and obtain the maximum likelihood estimators of its parameters using record data. In section 3, Idefine a pivot and express its exact probability distribution. In section 4, I express confidence intervals of reliability and quantiles. I apply my theoretical results to Dunsmore’s (Citation1983) data on sizes of crushed rocks and to record data on the mean concentration of sulfur dioxide in Long Beach, California.
2. The two-parameter exponential distribution and records
are the upper record values observed from the exponential distribution
. The maximum likelihood estimators of
and
based on records are (Arnold et al., Citation1998):
I have
Moreover, let, then
where denotes the gamma distribution with parameters
and
. The random variables
and
are independent of one another.
3. The pivot and its exact distribution
In analogy with Lawless (Citation2003) and Paolino (Citation2010), I define the pivot
I have
where For
the cumulative distribution function of the chi-square random variable with
degrees of freedom and
, using EquationEquation (9)
(9)
(9) and the fact that
and
are independent of each other, I find the distribution of the pivot
.
Theorem 1: The cumulative distribution of the pivot is
Proof: Using the distribution function technique for finding the distribution of a function of random variables (Casella and Berger, Citation2001), I have
The shape of the set inside this probability depends on the sign of .
Case 1:
The integrals and the limits of integration are
Case 2:
The region of integration is a triangle in the first quadrant with right angle at the origin. Specifically
This proves the theorem. ■
The probability density function is obtained by differentiating
with respect to
and present
and
when
and
Figure 1. Cumulative distribution function of Z, n = 2 and S = 0.5.
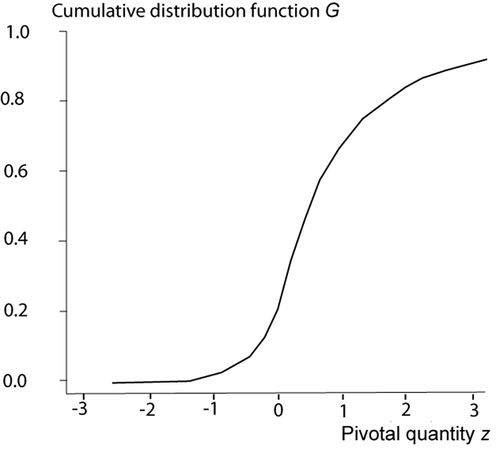
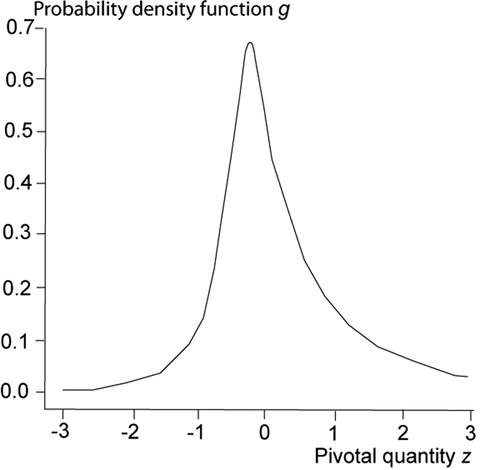
Figure 2. Probability density function of Z, n = 2 and S = 0.5.
4. Exact interval estimation of reliability and quantiles
I compute confidence intervals and confidence limits for the quantile of the two-parameter exponential distribution using the cumulative distribution function given by Theorem 1. The
quantile
of
is solution of
A confidence upper limit for
is
The two-sided confidence interval is
The value of corresponding to
is
Substitute it in EquationEquation (10)(10)
(10) of
yields the cumulative distribution function, which depends on
. I use this dependency to construct the confidence upper bound as solution to
5. Applications
5.1. Sizes of crushed rocks
Dunsmore (Citation1983) and Arnold et al. (Citation1998) describe a rock crushing machine operating in such a way that it has to be reset if the size of the rock being crushed is larger than any other that has been crushed before. Below are the rock sizes obtained up to the third reset of the machine:
The sizes when resetting was necessary are
The unit of measurement is not given in the original source of data but the point and the interval estimators are interpreted in the scale on which the data are obtained. Based on the records, I get and
. Therefore the maximum likelihood estimators of
and
are
and
. Based on the procedure described in section 3, Table 1 presents 90% and 95% upper confidence limits for
,
Table 2 presents 90% and 95% upper confidence limits for reliability for some values of
. These limits are obtained based only on the three upper records. If only the record data are available, I cannot use the methods described in the introduction because they rely on the full data set which I do not have.
Table 1: Upper confidence limits for quantiles
Table 2: Upper confidence limits for reliability
Table 3: Upper confidence limits for quantiles
Table 4: Upper confidence limits for reliability
5.2. Concentration of sulfur dioxide
Roberts (Citation1979) provided the monthly and annual maximum of one-hour mean concentration of sulfur dioxide in parts per hundred million (pphm) from Long Beach, California, for the years 1956–1974. The data given here are the related upper record values for the month of October: 26, 27, 40, and 41. Assuming that these record values come from a two-parameter exponential distribution, Iobtain and
. The maximum likelihood estimators of the parameters are
and
. Icalculate 90% and 95% upper confidence limits for
,
Table 3 shows that the median (p = 0.5) of the maximal one-hour mean concentration of sulphur dioxide for October is less than 38.21 pphm with 95% confidence. Icalculate 90% and 95% upper confidence limits of reliability for some values of
. The results are given in Table 4. For example, the probability that the maximal one-hour mean concentration of sulfur dioxide for October does not exceed 26.5 pphm is 0.79 with 90% confidence.
6. Conclusion
In EquationEquations (15)(15)
(15) and (Equation18
(18)
(18) ), I developed exact intervals for reliability and quantiles of the two-parameter exponential distribution based on upper records. The intervals are based on the exact distribution of the pivotal quantity. I tested hypotheses about reliability and quantiles using the pivot In EquationEquation (8)
(8)
(8) . My results in EquationEquation (15)
(15)
(15) and (Equation18
(18)
(18) ) also apply to the Pareto distribution. These results can be applied to records of any continuous random variable that can be transformed by an increasing function into a two-parameter exponential distribution.
Acknowledgments
The author is grateful to the editor and the two referees for their comments and suggestions that improved the paper.
Additional information
Funding
References
- Arnold, B. C., Balakrishnan, N., and Nagaraja, H. N. (1998). Records. New York: Wiley.
- Casella, G. and Berger, R. (2001). Statistical Inference (2nd Edition). Boston: Cengage Learning.
- Chandler, K. N. (1952). The distribution and frequency of record values. Journal of the Royal Statistical Society, B14(2): 220–228.
- Dunsmore, I. R. (1983). The future occurrence of records. Annals of the Institute of Statistical Mathematics, 35: 267–277. doi: https://doi.org/10.1007/BF02480982.
- Engelhardt, M. and Bain, L. J. (1978). Tolerance limits and confidence limits on reliability for the two-parameter exponential distribution. Technometrics : a Journal of Statistics for the Physical, Chemical, and Engineering Sciences, 20(1): 37–39. doi: https://doi.org/10.1080/00401706.1978.10489615
- Fernandez, A. J. (2007). On calculating generalized confidence intervals for the two parameter exponential reliability function. Statistics, 41(2): 129–135.
- Grubbs, F. E. (1971). Approximate fiducial bounds on reliability for the two-parameter exponential distribution. Technometrics : a Journal of Statistics for the Physical, Chemical, and Engineering Sciences, 13(4): 873–876. doi: https://doi.org/10.1080/00401706.1971.10488858
- Lawless, J. F. (2003). Statistical Models and Methods for Lifetime Data Analysis (2nd Edition). New York: Wiley.
- Paolino, D. S. (2010). Exact inference for the pth-quantile and the reliability of the two-parameter exponential distribution with singly type II censoring: A standard approach. Communications in Statistics - Theory and Methods, 39(14): 2561–2572. doi: https://doi.org/10.1080/03610920903068174
- Roberts, E. (1979). Review of statistics of extreme values with application to air quality data. part II: applications. Journal of the Air Pollution Control Association, 29(7): 733–740. doi: https://doi.org/10.1080/00022470.1979.10470856
- Roy, A. and Mathew, T. (2005). A generalized confidence limit for the reliability function of a two-parameter exponential distribution. Journal of Statistical Planning and Inference, 128(2): 509–517. doi: https://doi.org/10.1016/j.jspi.2003.11.012
- Wang, L. and Shi, Y. (2013). Reliability analysis of a class of exponential distribution under record values. Journal of Computational and Applied Mathematics, 239(1): 367–379. doi: https://doi.org/10.1016/j.cam.2012.09.004