Abstract
Fermentation of D-mannitol and the bacteria responsible for it were analyzed by 13C-NMR spectroscopy and amplified ribosomal restriction analyses (ARDRA) on intestinal bacteria in pig cecal digesta and in a rat in vivo feeding trial. [1-13C]-Mannitol was fermented by pig cecal digesta mainly to [2-13C]-propionate, [3-13C]-propionate, [2-13C]-butyrate, and [4-13C]-butyrate. Dietary D-mannitol at a 5% level induced significantly higher cecal butyrate concentration in the rat model. The evolution of rat fecal bacteria due to feeding with D-mannitol suggested the involvement of a lactate-utilizing butyrate producer, Clostridium indolis, in the stimulation of butyrate production. Rat intestinal microbiota is often difficult to extrapolate to that of humans, but the stimulation of the lactate-utilizing butyrate producers and propionate producers was suggested by the 13C-NMR spectroscopy of the end products of pig cecal fermentation and ARDRA on rat fecal bacteria. These results suggest the potential of D-mannitol as a prebiotic, which modifies large intestinal fermentation to produce more butyrate and propionate.
Introduction
Bacterial fermentation in the large intestine supplies short-chain fatty acids (SCFAs) to the cecal and colonic tissues to support their function and the turnover of epithelial cells. Among SCFAs, the role of butyrate is stressed in relation to the prevention of colonic disorders, such as colorectal cancer Citation[1–3]. Propionate is another major fermentation product of colonic fermentation. Propionate is absorbed and transported to the liver, where it is used as a precursor of gluconeogenesis. Accordingly, propionate, as an enhancer of hepatic gluconeogenesis, may reduce the participation of amino acids in gluconeogenesis. This implies a reduction in ammoniogenesis, which could be of considerable benefit to patients with hepatic and renal disorders. In this context, the GRAS (generally regarded as safe) compounds, such as the particular components of common food items that stimulate the production of large intestinal butyrate and propionate, should be obtained and evaluated.
Mannitol has been demonstrated to be an undigestible carbohydrate, the majority of which reaches the large intestine Citation[4]. Dietary mannitol has been shown to promote butyrate production in the rat model Citation[5]. However, not many bacteria have been listed as mannitol utilizers Citation[6]. Therefore, the available information is not sufficient to define the fermentation characteristics of mannitol and the bacteria responsible for the fermentation.
In this study, we evaluated the effect of dietary mannitol on large intestinal fermentation and tried to define fermentation using nuclear magnetic resonance (NMR) on 13C-labeled mannitol and responsible bacteria using a molecular ecological method. We discuss the potential of this sugar alcohol as the particular substrate of butyrate and propionate production.
Materials and methods
NMR study on D-[1-13C]-mannitol metabolism in the pig with the in vitro cecal fermentation model
Two cecostomized cross-bred (landrace×large white×Duroc) sows (body weight 185 kg and 180 kg) were used as donors of cecal content. The pigs were maintained on a mixed ration mainly composed of cracked corn, alfalfa meal, and meat-bone meal as described previously Citation[7]. Cecal digesta were sampled from these sows by suction through a cannula during morning feeding. Digesta were immediately diluted to 1/5 with an anaerobic phosphate buffer (pH 6.5, 0.1 M) containing 20% (v/v) deuterium oxide. The buffer was boiled and cooled under an O2-free N2 stream before use. Diluted digesta were squeezed through a 100-µm nylon mesh, and portions (50 ml) were dispensed into two 100-ml serum bottles. The manipulations were performed under a N2 atmosphere. D- [1-13C]-Mannitol (99% enriched) was obtained from ISOTEC (Miamisburg, OH, USA) and used as the substrate for in vitro fermentation. Labeled mannitol was introduced into vacant incubation vessels to obtain 20 mmol/kg as the final concentration after the inoculation of diluted digesta. Bottles were filled with O2-free N2 and closed with butyl rubber septa (Bellco, Vineland, NJ, USA). Fermentation was performed in duplicate at 37°C with gentle shaking (50 rpm) in a MW-150 stationary temperature shaker (Miyamoto-riken, Osaka, Japan). A portion (2 ml) of the culture was sampled using syringes from a bottle at 0, 6, 12, 18, and 24 h of incubation. A sampled culture was dispensed into two microfuge tubes placed in a crushed ice bath and centrifuged immediately at 20 000 g at 4°C for 10 min. Supernatants were frozen at −20°C until analyses by NMR.
NMR spectroscopy
Some of the supernatants were transferred to NMR tubes (5 mm o.d.) and introduced into a Unity Inova 500 NMR spectrometer (Varian, Palo Alto, CA, USA). The conditions used were as described previously Citation[8]. The amount of the labeled SCFA was estimated from the sum of the peak areas of both main and satellite peaks. The relative signal intensities for labeled SCFAs were calculated as a percentage of the signal integral for the specific SCFA in the sum of all the peak integrals.
Murine in vivo study
Wistar male rats (6 weeks old) were obtained from Japan SLC (Shizuoka, Japan). They were treated as described elsewhere according to the guidelines of the Committee for Research on Experimental Animals and the NRC Guide for the Care and Use of Laboratory Animals Citation[9]. These 24 animals were divided into 4 experimental groups (groups B, C, 5M and 10M) as indicated below. They were fed a regular commercial diet (CRF-1, Oriental Yeast Co., Osaka, Japan) for 4 days after the introduction and a basal diet for 7 days. The basal diet was composed (g/kg) of alpha-cornstarch (532), sucrose (100), casein (200), L-cystin Citation[3], lard (70), soybean oil (30), a vitamin mixture (AIN-93) Citation[10], a mineral mixture (AIN-93G) (35), and cellulose Citation[20]. The ingredients were purchased from the Oriental Yeast Co. At the end of the adaptation period, ceca from six rats were removed under general anesthesia with diethylether, and the cecal contents were analyzed for organic acid concentration (group B). The remaining rats were divided into three groups of six to obtain the equal mean body weight. D-Mannitol was added to 1 kg basal diet of either 50 g (group 5M) or 100 g (group 10M). These diets were offered to the rats for 22 days. One group of the rats remained on the basal diet throughout the experiment (group C). At the end of the test period, ceca were removed, and the cecal contents were analyzed for organic acid following the method of Hoshi et al. Citation[10]. The SCFA concentration in rat cecum was analyzed by one-way ANOVA or Kruskal-Wallis according to the Bartlett test and post-hoc Fisher's least significant difference test when the dietary effect was significant (p<0.05).
Temperature gradient gel electrophoresis (TGGE) and amplified ribosomal DNA restriction analysis (ARDRA)
Whole daily feces of rats were sampled as fresh as possible at the introduction (B), at the end of the acclimatization for the basal diet (day 0), and on the first (day 1), third (day 3), 10th (day 10), and 22nd (day 22) day of the test period. Sampled feces were immediately introduced into 4 M guanidine thiocyanate-0.1 M Tris (pH 7.5) as indicated by Godon et al. Citation[11] and frozen at −80°C until DNA extraction. After removal of the cecum, portions of the contents were also introduced into the same guanidine thiocyanate solution. Bacterial DNA was isolated from the feces and cecal contents following the method of Godon et al. Citation[11]. Polymerase chain reaction (PCR) for TGGE was performed using forward primer (968GC: 5′-CGCCCGGGGCGCGCCCC GGGCGGGGCGGGGGCACGGGGGGAACGCGAAGAACCTTAC-3′), reverse primer (UNIV-R: 5′ACGGGCGGTGTGTACAAG-3′), and Fast Start Taq polymerase (Roche Diagnostics Japan, Tokyo, Japan). The PCR mixture was composed as suggested by the manufacturer. Following the initial denaturation at 95°C for 4 min, 40 thermal cycles of 95°C for 30 s, 58°C for 30 s, and 72°C for 45 s were performed. The reaction was finished with a final elongation at 72°C for 7 min. Acrylamide gel (8% w/v) containing 7 M urea was used to separate amplicons using a D-code electrophoresis system (BioRad Japan, Tokyo, Japan) with a thermal gradient from 66°C to 70°C at 0.2°C h−1 and 60 V in a 1×TAE buffer. Gels were silver-stained using a silver-staining kit (Wako, Osaka, Japan) to visualize the bands. The gel image was captured by a Nikon COOLPIX 990 digital camera (Nikon, Tokyo, Japan) and saved into a personal computer. Digital images were treated by Kodak 1D version 2.0 (Kodak, Rochester, NY, USA). Obtained band profiles were further treated by hierarchical clustering using SYSTAT10 (SPSS Inc., Chicago, IL, USA) to create cluster trees and estimate the evolution of the intestinal microbiota of each individual rat during the study.
Since cluster analyses on the TGGE profile of an individual animal showed the same tendency within a diet group, one animal from each of the groups C and 10M was randomly selected and subjected to ARDRA on bacterial 16S rDNA to obtain the name of predominant bacteria Citation[12]. Briefly, bacterial 16S rDNA was amplified by rTaq DNA polymerase (TOYOBO, Tokyo, Japan) with a forward primer (27F: 5′-AGAGTTTGATCCTGGCTCAG-3′) and a reverse primer (1492R: 5′-GGCTACCTTGTTACGACTT-3′). Following the initial denaturation at 94°C for 3 min, 12 thermal cycles of 94°C for 30 s, 58°C for 30 s, and 72°C for 30 s were performed. The reaction was finished with a final elongation at 72°C for 4 min. After purification, amplicons were ligated into the pGEM-T Easy Vector (Promega, Tokyo, Japan) according to the manufacturer's instructions. Escherichia coli JM 109 was transformed, and transformants were selected by blue-white selection. Direct-colony PCR was performed by rTaq DNA polymerase with SP6 and T7 primers.
After checking the presence of the right size of amplicon by agarose gel electrophoresis, 5 µl of PCR product was treated with HaeIII, HhaI, or Sau3AI (all from TOYOBO) according to the manufacturer's instructions. Digested DNA was separated by agarose gel electrophoresis to sort the E. coli clones into groups. Partial sequencing (800 bp) on the plasmids prepared from clones of each group was performed at the Shimadzu Genomic Research Facility (Kyoto, Japan) by the Sanger method. Sequences were compared with known 16S rRNA sequences in databases, such as GenBank, as described elsewhere Citation[12].
Results
NMR spectroscopy on [1-13C]-mannitol
shows the 13C-NMR spectra of the D-[1-13C]-mannitol and its metabolites at 6 h and 24 h of incubation. The major signals detected were D-[1-13C]-mannitol (63.5 ppm), [3-13C]-propionate (10.4 ppm), [4-13C]-butyrate (13.5 ppm), [2-13C]-acetate (23.5 ppm), [2-13C]-propionate (30.9 ppm), [2-13C]-butyrate (40.0 ppm), [2-13C]-valerate (37.6 ppm), and [3-13C]-butyrate (19.5 ppm). There were small satellite peaks around the above-mentioned major peaks of [1-13C]-mannitol and labeled acids. Those were caused by the replacement of hydrogen atom(s) with deuterium atom(s) by keto-enol equilibrium.
Figure 1. 13C -NMR spectra of D-[1-13C]-mannitol and its metabolites at 6 h (a) and 24 h (b) of incubation.
![Figure 1. 13C -NMR spectra of D-[1-13C]-mannitol and its metabolites at 6 h (a) and 24 h (b) of incubation.](/cms/asset/93b7fdc4-2541-4c74-a5ca-3a31216f749f/zmeh_a_143056_f0001_b.jpg)
shows the degradation of labeled mannitol and the evolution of labeled SCFA estimated by the evolution of signal intensities. Most of the [1-13C]-mannitol was degraded for 18 h. The evolution of the labeled acid, therefore, had almost terminated by this particular time except for that of [2-13C]-valerate. The relative intensities of [2-13C]-propionate, [3-13C]-propionate, [2-13C]-butyrate, and [4-13C]-butyrate were virtually the same (approximately 20% each). The relative intensity of [2-13C]-acetate was smaller, at 14%, than those of labeled SCFAs. The relative intensities of [2-13C]-valerate, [3-13C]-butyrate, and unknown signals (17 ppm) reached 3–4%.
Figure 2. Degradation of D-[1-13C]-mannitol (•) (a) and the evolution of 13C-labeled short-chain fatty acids (b). ○, [3-13C]-propionate; ♦, [2-13C]-butyrate; ⋄, [4-13C]-butyrate; •, [2-13C]-propionate; ▴, [2-13C]-acetate; ![]()
![Figure 2. Degradation of D-[1-13C]-mannitol (•) (a) and the evolution of 13C-labeled short-chain fatty acids (b). ○, [3-13C]-propionate; ♦, [2-13C]-butyrate; ⋄, [4-13C]-butyrate; •, [2-13C]-propionate; ▴, [2-13C]-acetate; Display full size, [2-13C]-valerate; Display full size, [3-13C]-butyrate.](/cms/asset/75de9bcf-48cd-4153-a603-2b8d8981beb5/zmeh_a_143056_f0002_b.jpg)
Cecal SCFA concentrations in rat
shows the cecal SCFAs of rats on day 0 (n=5) and at the end of the experiment (day 22, n=6). Acetate was the most important SCFA in the cecum of rats on day 0. This was always true for the rats in group C. Butyrate was the major SCFA in the rats from groups 5M and 10M. Acetate in these groups was less than in the other groups.
Table I. Concentration (mmol/kg water in cecal contents) of short-chain fatty acids of cecal digesta of rats on day 0 and at the end of the experiment (day 22).
Evolution of intestinal microbiota
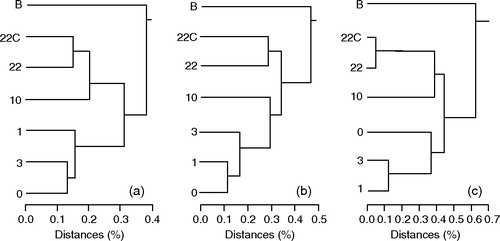
shows the gel images of TGGE on bacterial 16S rRNA genes retrieved from one rat from group C, 5M or 10M. Visible band numbers were the largest at the introduction (B). The visible band numbers decreased as the rats adapted to the basal diet (day 0). The band numbers tended to increase thereafter. This tendency was typically observed for rats in groups 5M and 10M. Dendrograms indicating the evolution of intestinal microbiota during the experiment are shown in . There was no difference in the dendrograms within a single group; therefore, one representative dendrogram is shown for each dietary group. In general, the profile for B was separated, hence different, from other profiles. The profiles of day 0, day 1, day 3, and day 10 tended to construct one particular cluster. The profile of day 22 and the profile of cecal microbiota (22-C) constructed another particular cluster that was separated from that created by other profiles. The scale below the dendrogram suggests how much the profiles varied. The distance between profiles increased from the dendrogram of a rat from group C to that of one from group 5M and increased more to that of a rat in group 10M.
Figure 3. Gel images of temperature gradient gel electrophoresis (TGGE) on bacterial 16S rRNA genes retrieved from feces and cecal digesta of one rat from group C (a), one from group 5M (b) and one from group 10M (c). B, at the introduction of rat; 0, day 0; 1, day 1; 3, day 3; 10, day 10; 22, day 22; 22C, cecal digesta on day 22.
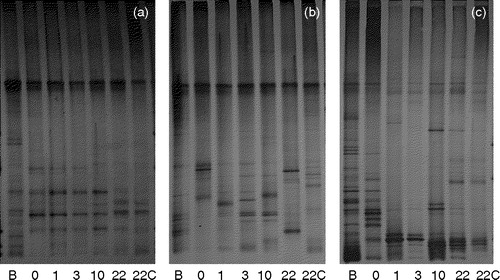
Figure 4. Dendrograms calculated from the TGGE band profiles of one rat from group C, group 5M, or group 10M. For details see legend to .
Partial sequences of bacterial 16S rDNA were compared with those deposited in databases. shows the names of bacteria being suggested from the BLAST search of the database. In a rat from group C, Clostridium orbiscindens, Ruminococcus flavefaciens, and R. bromii were the bacteria predominantly detected throughout the experiment. In a rat from group 10M, R. bromii, L. murinus, and E. coli were the bacteria predominantly detected on day 0. At the end of the experiment (day 22), B. merdae, C. indolis, R. bromii, and L. acidophilus were the predominantly detected bacteria.
Table II. Name of bacteria suggested by BLAST search on cloned 16S rRNA genes from rat feces.
Discussion
D-Mannitol is a sugar alcohol widely distributed among natural foods, such as fruits, and it has been considered to be an undigestible carbohydrate. The major portion of ingested mannitol, around 75%, reaches the large intestine Citation[4]. Dietary mannitol was shown to promote cecal butyrate production in rats Citation[5]. In the present study, 13C-NMR spectroscopy clearly indicated that D-mannitol was metabolized by the intestinal bacteria to butyrate and propionate. This fermentation characteristic was also clear in an in vivo murine study, particularly in butyrate production. The increase in cecal butyrate concentration in rats from groups 5M and 10M was evident.
Butyrate is known to promote health, particularly for the large intestine and for the promotion of growth of epithelial cells Citation[13–15], the stimulation of mucus release Citation[16], mineral and water absorption Citation[17], Citation[18], and the prevention of colorectal cancer Citation[3]. Accordingly, the stimulation of butyrate production is one of the principal objectives of prebiotics. The present study and a previous one Citation[5] suggest the potential of D-mannitol as a prebiotic that stimulates colonic butyrate production.
As shown by TGGE profiles, intestinal microbiota evolved from day 0 to day 22 as feeding of D-mannitol progressed. The larger distance between the profiles in a rat from group 10M suggests a greater influence of diet on the intestinal microbiota. The smaller visible band number retrieved from the rat feces taken on day 0, compared with that of B, indicated that the semi-synthetic diet had a strong impact on the intestinal microbiota, ultimately simplifying its composition. The use of a semi-synthetic diet is typical in nutritional studies; however, the extrapolation of the results obtained with such a diet to humans, who consume complex and crude diets, should be done with a considerable amount of caution, particularly as regards intestinal microbiota.
Bacteria involved in butyrate production in the rats used in this study were likely C. indolis and lactobacilli. Predominant detection of C. indolis with lactate-producing bacteria may explain the stimulation of butyrate production, because C. indolis was recently isolated from human feces as a predominant lactate-utilizing butyrate producer Citation[19]. From 13C-NMR spectroscopy, the involvement of lactate production in butyrate production was not clear, probably because the metabolism of lactate is rapid, as suggested by the results in a previous experiment Citation[8]. However, the potential contribution of a lactate-utilizing butyrate producer, such as Megasphaera elsdenii, in butyrate production was demonstrated in our previous study using rats consuming fructooligosaccharide Citation[20]. Since this potent bacterium was not actually present in the experimental rats supplied by the commercial breeders Citation[20], Citation[21], C. indolis, as a predominant lactate-utilizing butyrate producer in this model, replaced the role of Megasphaera spp. The stimulation of the growth of C. indolis by dietary mannitol suggests the involvement of the conversion of lactate because this bacterium does not use mannitol Citation[6].
In a previous study, orally dosed M. elsdenii converted lactate into butyrate efficiently in the cecum of rat even at a level as low as 107/g cecal digesta Citation[20]. Clostridia were predominant intestinal bacteria artificially introduced into experimental rodents Citation[21]. The level of clostridia was as large as 109–1010/g digesta Citation[21], Citation[22]. The predominant detection of C. indolis among clostridia suggests a much higher level of this bacterium in murine cecum than that of M. elsdenii, which was orally introduced in a previous study. Therefore, the presence of the efficient conversion of lactate into butyrate by C. indolis is plausible. Clostridia are often referred to as bacteria that are bad for the health Citation[23], Citation[24], although they are typically found in intestinal microbiota. As mentioned above, the intestinal microbiota of the experimental rat is artificially constructed and much simpler than that found in humans. In the case of humans, some bacteria other than C. indolis have been isolated Citation[19], Citation[25–27] as lactate-utilizing butyrate producers. Therefore, the present result does not necessarily indicate that mannitol stimulates the growth of clostridia when administered to a human subject.
In the in vitro culture using pig digesta, propionate was also produced from 13C-mannitol (). However, the propionate concentration in the ceca of the present rat model was not as stimulated as was butyrate. The equal detection of [2-13C]-propionate and [3-13C]-propionate in the in vitro pig model suggests that the system involved the so-called acrylic pathway and a random pathway with a similar intensity. The former pathway is mainly observed in some clostridia and prevotella, such as C. propionicum and P. ruminicolaCitation[28]. The latter pathway is detected in Veillonella alcalescensPropionibacterium spp., Selenomonas ruminantium, and Anaerovibrio lypolyticaCitation[28], most of which are not present in experimental rodents Citation[21]. The absence of these bacteria may explain the smaller propionate production in the rat in vivo study. These bacteria are also typically present in human intestinal microbiota; therefore, D-mannitol administration probably stimulates the production of propionate as much as butyrate when administrated to human subjects.
D-Mannitol is a sugar alcohol that is contained in a variety of plant products, particularly fruits Citation[29]. Usual consumption of D-mannitol does not seem to be as high as that given in the present study. Accordingly it is suggested that the diet should be supplemented with D-mannitol. Future research on humans is anticipated to determine the effects of D-mannitol on intestinal fermentation.
Related Research Data
References
- Nakano K, Mizuno T, Sowa Y, Orita T, Yoshino T, Okuyama Y, et al. Butyrate activates the WAF1/Cip1 gene promoter through Sp1 sites in a p53-negative human colon cancer cell line. J Biol Chem 1997; 272: 22199–206
- Ruemmele FM, Schwartz S, Seidman EG, Dionne S, Levy E, Lentze MJ. Butyrate-induced Caco-2 cell apoptosis is mediated via the mitochondrial pathway. Gut 2003; 52: 94–100
- Kameue C, Tsukahara T, Yamada K, Koyama H, Iwasaki Y, Nakayama K, et al. Dietary sodium gluconate protects rats from large-bowel cancer by stimulating butyrate production. J Nutr 2004; 134: 940–4
- Bernier JJ, Pascal G. Valeur enérgetique des polyols (sucres-alcools). Med Nut 1990; 24: 221–38
- Morishita Y. The effect of dietary mannitol on the caecal microflora and short-chain fatty acids in rats. Lett Appl Microbiol 1994; 18: 27–9
- Holdeman LV, Cato EP, Moore WEC. Anaerobe laboratory manual4th edn. Virginia Polytechnic Institute and State University, Blacksburg, VA 1977
- Tsukahara T, Koyama H, Okada M, Ushida K. Stimulation of butyrate production by gluconic acid in batch culture of pig cecal digesta and identification of butyrate-producing bacteria. J Nutr 2002; 132: 2229–34
- Ushida K, Hoshi S, Ajisaka K. 13C-NMR studies on lactate metabolism in a porcine gut microbial ecosystem. Microb Ecol Health Dis 2002; 14: 241–6
- Kinouchi T, Koizumi K, Kuwata T, Yajima T. Milk-borne insulin with trypsin inhibitor in milk induces pancreatic amylase development at the onset of weaning in rats. J Pediatr Gastroenterol Nutr 2000; 30: 515–21
- Hoshi S, Sakata T, Mikuni K, Hashimoto H, Kimura S. Galactosylsucrose and xylosylfructoside alter digestive tract size and concentrations of cecal organic acids in rats fed diets containing cholesterol and cholic acid. J Nutr 1994; 124: 52–60
- Godon JJ, Zumstein E, Dabert P, Habouzit F, Moletta R. Molecular microbial diversity of an anaerobic digestor as determined by small-subunit rDNA sequence analysis. Appl Environ Microbiol 1997; 63: 2802–13
- Inoue R, Ushida K. Vertical and horizontal transmission of intestinal commensal bacteria in the rat model. FEMS Microbiol Ecol 2003; 46: 213–19
- Sakata T. Influence of short-chain fatty acids on intestinal growth and functions. Dietary fiber in health and disease, D Kritchevsky, C Bonfield. Plenum Press, New York, NY 1997; 191–9
- Young GP, Gibson PR. Butyrate and the human cancer cell. Physiological and clinical aspects of short-chain fatty acids, JH Cummings, JL Rombeau, T Sakata. Cambridge University Press, CambridgeUK 1995; 319–35
- Tsukahara T, Iwasaki Y, Nakayama K, Ushida K. Stimulation of butyrate production in the large intestine of weaning piglets by dietary fructooligosaccharides and its influence on the histological variables of the large intestinal mucosa. J Nutr Sci Vitaminol 2003; 49: 414–21
- Shimotoyodome A, Meguro S, Hase T, Tokimitsu I, Sakata T. Short-chain fatty acids, but not lactate or succinate, stimulate mucus release in the rat colon. Comp Biochem Physiol 2000; 125A: 525–31
- Holtug K, Rasmussen HS, Mortensen PB. An in vitro study of short-chain fatty acid concentrations, production, and absorption in pig (Sus scrofa) colon. Comp Biochem Physiol 1992; 103A: 189–97
- Roediger WEW, Moore A. The effect of short-chain fatty acids on sodium absorption in the isolated human colon perfused through the vascular bed. Dig Dis Sci 1981; 26: 100–6
- Duncan SH, Louis P, Flint HJ. Lactate-utilizing bacteria, isolated from human feces, that produce butyrate as a major fermentation product. Appl Environ Microbiol 2004; 70: 5810–17
- Hashizume K, Tsukahara T, Yamada K, Koyama H, Ushida K. Megasphaera elsdenii JCM1772T normalizes hyperlactate production in the large intestine of fructooligosaccharide-fed rats by stimulating butyrate production. J Nutr 2003; 133: 3187–90
- Yanabe M, Shibuya M, Gonda T, Asai H, Tanaka T, Sudou K, et al. Establishment of specific pathogen-free (SPF) rat colonies using gnotobiotic techniques. Exp Anim 2001; 50: 293–8
- Hirayama K, Miyaji K, Kawamura S, Itoh K, Takahashi E, Mitsuoka T. Development of intestinal flora of human-flora-associated (HFA) mice in the intestine of their offspring. Exp Anim 1995; 44: 219–22
- Mitsuoka T. Intestinal flora and the host. Pharmacia 1969; 6: 608–9
- Kalliomaki M, Kirjavainen P, Eerola E, Kero P, Salminen S, Isolauri E. Distinct patterns of neonatal gut microflora in infants in whom atopy was and was not developing. J Allergy Clin Immunol 2001; 107: 129–34
- Benno Y, Sawada K, Mitsuoka T. The intestinal microflora of infants: composition of fecal flora in breast-fed and bottle-fed infants. Microb Immunol 1984; 28: 975–86
- Benno Y, Suzuki K, Suzuki K, Narisawa K, Bruce WR, Mitsuoka T. Comparison of the fecal microflora in rural Japanese and urban Canadians. Microb Immunol 1986; 30: 521–32
- Benno Y, Endo K, Mizutani T, Namba Y, Komori T, Mitsuoka T. Comparison of fecal microflora of elderly persons in rural and urban areas of Japan. Appl Environ Microbiol 1989; 55: 1100–5
- Stewart CS, Flint HJ, Bryant MP. The rumen bacteria. The rumen microbial ecosystem2nd edn, PN Hobson, CS Stewart. Blackie Academic & Professional, LondonUK 1997; 10–72
- Griffin WC, Lynch MJ. Polyhydric alcohols. Handbook of food additions, TE Furier. CRC Press, Ohio, OH 1972; 431–55