
ABSTRACT
For centuries, reindeer herding has been an integral part of the subsistence and culture among the Sámi of northern Fennoscandia. Despite the importance of this husbandry in their history, the timing and details of early reindeer domestication are still highly debated. Indeed, identifying domesticated individuals in the archaeological record remains complicated because reindeer are still considered to be in the early phases of the domestication process. In this work, we propose solutions for identifying domestic individuals using 3D geometric morphometrics on isolated elements from the long bones of the hindlimb in modern reindeer populations. These bones are important for understanding both the mobility of reindeer and the effect of load carrying or draught. A good level of distinction between the size and shape variables of these bones was found among subspecies, sex and lifestyles. This demonstrates that the long bones of the hindlimb can provide information on changes in locomotor behaviour induced by the domestication process, such as control and reduction of reindeer mobility by humans. This also demonstrates that analysis in geometric morphometrics is useful for exploring the use of draught reindeer in early Sámi reindeer herding and the implications for understanding reindeer domestication and early reindeer herding strategies.
Introduction
The domestication of the reindeer (Rangifer tarandus Linnaeus, Citation1758) had a far-reaching impact on the subsistence, lifeways, economy and cosmology of many peoples in northern Eurasia. Nowadays, reindeer herding is widely practiced in most tundra and taiga areas by around 30 indigenous reindeer herder groups, from eastern Siberia and northern Mongolia to northern Fennoscandia (Mirov Citation1945; Baskin Citation2000; Reindeer Herding Citation2021). The vast majority of the reindeer populations in these areas are now considered domesticated (i.e. reindeer used by humans to perform domestic tasks such as transport or pulling) or semi-domesticated (i.e. reindeer bred freely in near-natural conditions under the supervision of humans) (Syroechkovskii Citation1995; Baskin Citation2005). Despite the importance of this husbandry in the history of the Arctic people, the exact period and location of the earliest centres of domestication, as well as the nature of the early reindeer management strategies, are yet to be clearly identified from the archaeological records. Although some scholars estimate the earliest onset of reindeer domestication in the Mesolithic, the earliest material evidence of reindeer management, such as sled runners or harness parts found in Siberia, date from 1,500 BC (Murashkin et al. Citation2016) and ca. 200 BC–160 AD (Losey et al. Citation2021). This kind of direct archaeological evidence is lacking in Fennoscandia during the early stages of reindeer husbandry, even though historical and ethnographic sources have suggested that draught reindeer were important to early reindeer domestication (Ingold Citation1986; Bjørklund Citation2013).
In Fennoscandia, it is generally supposed that reindeer herding by the Sámi people developed gradually from the Late Iron Age (ca. 800–900 AD) onwards (Helskog and Indrelid Citation2011; Hansen and Olsen Citation2014), independently of the indigenous cultures in northwestern Siberia (Røed et al. Citation2008, Citation2011). Historically, the Sámi have preserved their nomadic traditions of hunter-fisher-gatherers, while also practicing small-scale reindeer herding (Bjørklund Citation2013). During these early phases of husbandry, only small domestic herds of three to four individuals were kept close to human settlements and used as decoys for hunting wild reindeer, for milking or performing various tasks, such as pulling sleds and carrying loads in trade or transhumance (Tegengren Citation1952; Aronsson Citation1991; Korhonen Citation2008). Reindeer herding became the basis of social organisation as recently as from 1,400–1,600 AD onwards, driven by various new socio-economic factors (e.g. colonial policies of the emerging nation states of southern Fennoscandia, intensification of the fur trade or expansion of Christianity), which marked a profound change in Sámi societies (Hansen and Olsen Citation2014; Salmi et al. Citation2018). These centuries of socio-economic upheaval resulted in considerable chronological and geographical variations in the adoption and intensification of reindeer herding in Fennoscandia (Tegengren Citation1952; Bergman et al. Citation2013; Hedman et al. Citation2015). Thus, this transition cannot be understood as linear; rather it has been dependent on the effectiveness of the economic and political networks in these territories. Thus, the beginnings of the reindeer domestication in Fennoscandia are still widely discussed and have remained difficult to define, as no abrupt change from hunting to pastoralism has been identified in the archaeological record.
Reindeer bones and teeth collected from archaeological sites can provide direct evidence of this important transition in the socio-economic structure and the history of the Sámi people and provide a unique opportunity to study the reindeer domestication process. In fact, domestication is often initiated by controlling the behaviour of wild animals – when they are removed from their natural habitat to be placed in an anthropogenic environment – in order to be used as production or working animals (Price Citation2002; Vigne Citation2015; Zeder Citation2015). These animals are then subjected to selective pressures and different environmental stimuli, which induce significant phenotypic and genotypic changes (Vigne et al. Citation2005). These resulting morphological changes are traditionally used to document domestication, and they are often defined by the retention of paedomorphic traits (e.g. Morey Citation1992; Evin et al. Citation2017; Geiger et al. Citation2017) or by a general reduction in body size (e.g. Albarella Citation2002; Evin et al. Citation2013; Neaux et al. Citation2020). While these changes do not reflect the early stages of domestication but occur later in the process (Arbuckle Citation2005), a reduction in body size among reindeer has been observed between domestic and wild individuals (Puputti and Niskanen Citation2009; Pelletier et al. Citation2020). However, the morphological changes associated with the early stages of domestication in the response of reindeer populations due to artificial selection induced by the Sámi people are largely unknown and therefore remain to be identified.
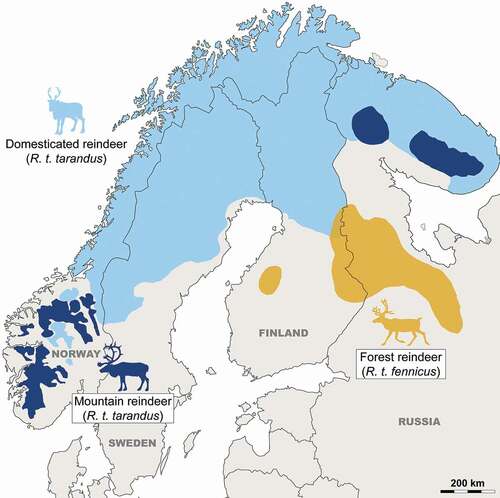
Identifying domesticated individuals in the archaeological record remains more difficult due to the presence of two interbreeding reindeer subspecies in Fennoscandia with similar morphologies and overlapping body sizes: 1) the mountain reindeer (R.t. tarandus), including wild populations now only present in southern Norway and the Kola Peninsula in Russia, and domestic herds throughout Lapland; and 2) the wild Finnish forest reindeer (R.t. fennicus), occupying the taiga in central and southern Finland, in the provinces of North Karelia, Savonia and Kainuu, as well as in Russian Karelia (). However, the geographical distribution of wild populations and the genetic history of domestic herds must have been significantly different in the past compared to today. Previously, wild mountain reindeer were extant throughout the mountainous areas of northern Fennoscandia, and wild forest reindeer were found throughout the taiga zone of northern Finland (Helle Citation1982). While domestic reindeer have been domesticated from wild mountain reindeer (Røed et al. Citation2008), Sámi reindeer herding is more likely to have originated in Scandinavian mountain areas rather than in northeastern Fennoscandia (Wallerström Citation2000; Bergman et al. Citation2013; Heino et al. Citation2021). Also, the extant domesticated reindeer populations in northern Fennoscandia were strongly influenced by the introduction of non-native reindeer from Siberia during the 16th and 17th centuries (Røed et al. Citation2018). These early domestic reindeer can be identified from wild forms of the species utilising destructive methods such as genetic analysis using ancient DNA (e.g. Bjørnstad et al. Citation2012; Røed et al. Citation2018; Salmi and Heino Citation2019; Heino et al. Citation2021), geochemical analysis using stable isotopes (e.g. Salmi et al. Citation2015, Citation2020a; Fjellström et al. Citation2020), or non-destructive methodologies using the morphometric characteristics of the skeleton. Regarding non-destructive methods, previous studies have succeeded in defining the specific characteristics of each subspecies from cranial elements, body proportions, as well as linear measurements on the postcranial skeleton of modern specimens (Nieminen and Helle Citation1980; Hakala et al. Citation1996; Puputti and Niskanen Citation2008; Puputti and Niskanen Citation2009). However, these methods remain difficult to apply to the fossil record, in which bones are regularly found to be broken. In addition, the assessments of subspecies on bony elements are prone to error due to the presence of a strong sexual dimorphism in both subspecies and/or a significant phenotypic plasticity that can create significant overlaps (Puputti and Niskanen Citation2009). Thus, traditional methodologies using measurements and/or bone morphology to identify subspecies and domesticated individuals from archaeological deposits have various limitations and do not allow for a sufficiently robust identification of domestic individuals.
Figure 1. Current geographical distribution of the two reindeer subspecies, including wild and domestic populations in Fennoscandia (from Suominen and Olofsson Citation2000).
In this study, we partially solved these issues using 3D geometric morphometrics on a large set of long bones of the hindlimb (i.e. femur, tibia and metatarsal) from a broad sample of modern Fennoscandian specimens and compared their discriminate potential. Similar work was recently conducted on the long bones of the forelimb and has shown that they could provide information about changes in feeding and locomotor behaviour prompted by captivity and domestication (Pelletier et al. Citation2020). Unlike the long bones of the forelimb, the bones of the hindlimb are more subject to the constraints associated with body propulsion and are more impacted by external pressures (Schmidt and Fischer Citation2009; Hanot et al. Citation2017; Mallet et al. Citation2019). In this respect, it is historically known that among most Eurasian nomadic peoples, domestic reindeer may be used for pulling and carrying loads, as well as for riding (Mirov Citation1945; Nieminen and Pietilä Citation1998; Inamura Citation2005; Dwyer and Istomin Citation2008; Korhonen Citation2008; Anderson et al. Citation2017). Thus, these bones have a great potential for approaching reindeer domestication issues, particularly through the control and/or reduction of mobility by humans or the use of reindeer as working animals. The purpose of our study was to provide a reliable method of identifying domestic and wild individuals in modern reindeer populations from Finland, taking into account subspecies, sex and lifestyle, for an application to the archaeological contexts of the indigenous Sámi reindeer herders in northern Fennoscandia. A better comprehension of the details of the domestication process and its implications on human-reindeer relationship could be the key to understanding the history of present and past Sámi communities.
Material and methods
Modern reindeer sample
Several intrinsic (e.g. [sub]species, sex, age, genetic factors) and extrinsic (e.g. geographical position, topography, variations in climate and environment) factors can influence the body size and/or morphology of reindeer (e.g. Thomas and Everson Citation1981; Weinstock Citation1997, Citation2002; Weladji and Holand Citation2006; Puputti and Niskanen Citation2009; Pelletier et al. Citation2020). In order to minimise these biases, particularly the variation due to genetic diversity and environment, we mainly relied on a reindeer sample from central Finland. Thus, the samples studied included complete or partial skeletons of 123 individuals and represented the two subspecies currently present in Fennoscandia: the mountain reindeer (R.t. tarandus, n = 62) and the wild Finnish forest reindeer (R.t. fennicus, n = 51), as well as first-generation hybrids resulting from the crossing of these two subspecies (n = 10). All specimens were adults with fully fused epiphyses and the sex was known (males, ♂ = 70 and females, ♀ = 53). Knowing that mobility reduction and domestication induce differential stress changes that can affect the shape and robusticity of bones (e.g. Pelletier et al. Citation2020; Harbers et al. Citation2020a, Citation2020b), lifestyle was taken into account depending on whether the individuals were free-ranging (n = 75), captive (n = 28) or were used for racing and pulling (n = 20). Captive and free-ranging specimens are part of the collection of the Biodiversity Unit and working reindeer are donated skeletons archived at the Laboratory of Archaeology, both hosted by the University of Oulu. The details of samples used for each bone are given in . Hindlimb long bones were digitised from computed tomography (CT) images. CT scans were performed on a clinical CT scanner (Somatom Definition Flash, Siemens Healthcare, Forcheim, Germany) using 120 kVp, 700 eff. mAs, 0.5 s rotation time, 0.6 mm slice thickness and increment, B70f reconstruction kernel, 140 mm reconstruction diameter, 0.35 pitch and 128 × 0.6 collimation. Each bone was scanned individually to avoid beam-hardening artefacts. Only left bones were selected for digitisation but when left bones were not available, right bones were selected instead and mirrored before analysis (i.e. 8/87 for femur; 10/90 for tibia; and 24/116 for metatarsal).
Table 1. Detail of specimens studied from the Zoological Museum of Oulu according to the subspecies (R.t. tarandus, R.t. fennicus and hybrid), sex (male = ♂ and female = ♀) and lifestyle (free-ranging, captive and working)
3D geometric morphometrics
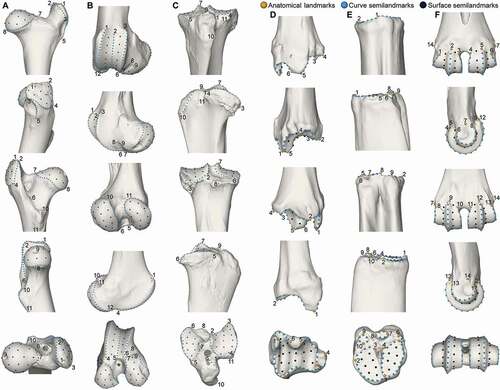
Geometric morphometrics (GMM) is a quantitative approach that allows the comparison of bone shapes and the visualisation of significant morphological changes between groups of specimens by means of spatial coordinates of points called landmarks (Adams et al. Citation2004; Zelditch et al. Citation2012). In recent years, this methodology has been widely used to explore the morpho-functional changes induced by the domestication process (Evin et al. Citation2013, Citation2015, Citation2017; Owen et al. Citation2014; Drake et al. Citation2015; Hanot et al. Citation2017, Citation2018; Haruda Citation2017; Cucchi et al. Citation2019; Haruda et al. Citation2019; Pöllath et al. Citation2019; Harbers et al. Citation2020a, Citation2020b; Neaux et al. Citation2021; Pelletier et al. Citation2020). Bone shape was therefore quantified by placing a set of landmarks on the 3D models. The analyses were performed on complete bones but the methodology has been adapted by focusing on the proximal and distal parts unaffected by entheseal changes and pathological lesions (Niinimäki and Salmi Citation2016; Salmi and Niinimäki Citation2016; Salmi et al. Citation2020b), as well as on the anatomical parts best preserved in the archaeological record in order to be complementary and directly applicable to the fossil material (Owen et al. Citation2014; Cornette et al. Citation2015; Pelletier et al. Citation2020). Due to the difficulty of quantifying the shape of articular surfaces, trochanters or condyles using traditional landmarks and the lack of homologous anatomical structures, semilandmarks have been included on curves and surfaces to help capture the three-dimensional structure of the epiphyses (Bookstein Citation1997). Thereby, 3D templates with 64 anatomical landmarks (ALM), 444 curve semilandmarks (CSLM) and 162 surface semilandmarks (SSLM) have been digitised and warped to capture the form of the six bony epiphyses (, ): proximal femur (11 ALM, 8 curves, 105 CSLM, 28 SSLM), distal femur (12 ALM, 7 curves, 130 CSLM, 45 SSLM), proximal tibia (11 ALM, 8 curves, 71 CSLM, 23 SSLM), distal tibia (6 ALM, 5 curves, 37 CSLM, 19 SSLM), proximal metatarsal (10 ALM, 9 curves, 37 CSLM, 13 SSLM) and distal metatarsal (14 ALM, 6 curves, 64 CSLM, 34 SSLM). Digitisation and warping were carried out using ViewBox v.4.0.1.7 software (dHAL software, Kifissia, Greece).
Table 2. Definition of anatomical landmarks and semilandmarks for each studied bone epiphyses shown in . ALM: anatomical landmarks; CSLM: curve semilandmarks; SSLM: surface semilandmarks
Figure 2. Location of anatomical landmarks (yellow spheres), curve sliding (blue spheres) and surface sliding (black spheres) semilandmarks placed on the bone epiphyses. A: proximal femur (from top to bottom: cranial, lateral, caudal, medial and proximal views); B: distal femur (from top to bottom: cranial, lateral, caudal, medial and distal views); C: proximal tibia (from top to bottom: cranial, lateral, caudal, medial and proximal views); D: distal tibia (from top to bottom: cranial, lateral, caudal, medial and distal views); E: proximal metatarsal (from top to bottom: cranial, lateral, caudal, medial and proximal views); F: distal metatarsal (from top to bottom: cranial, lateral, caudal, medial and distal views). The definitions of landmarks and semilandmarks are given in .
Unlike landmarks, semilandmarks do not have an exact anatomical correspondence on the structure of the epiphyses, and instead were allowed to slide along curves and surfaces in order to minimise the bending energy of the thin plate spline (TPS) interpolation function (Bookstein Citation1997; Gunz et al. Citation2005; Gunz and Mitteroecker Citation2013). After sliding, all specimen coordinates were aligned using Generalised Procrustes Analysis (GPA, Rohlf and Slice Citation1990; Bookstein Citation1991, Citation1996). GPA was conducted using the function ‘gpagen’ of the ‘geomorph’ package (v.3.1.1, Adams and Otárola-Castillo Citation2013) in the Rstudio environment (v.1.1.383, R Development Core Team Citation2011). All configurations were translated and rotated to minimise the overall sum of the squared distances between the corresponding landmarks and semilandmarks. To remove the effects of scale, GPA also computed a unit centroid size as the square root of the summed squared distances from all landmarks and semilandmarks to their centroid (Bookstein Citation1996; Dryden and Mardia Citation1998). Size differences were evaluated from log-transformed centroid sizes for the six epiphyses analysed by pooling the specimens according to 1) subspecies, 2) sexes, 3) lifestyles, 4) ‘subspecies + sexes’ and 5) ‘subspecies + sexes + lifestyles’, using Kruskal-Wallis tests with an error threshold set at α = 5%. Pairwise comparisons of the populations were performed using multiple Wilcoxon rank tests according to these different categories. To control for the false discovery rate, a multi-comparison correction was applied to the P-values using the ‘Benjamini-Hochberg’ method (Benjamini and Hochberg Citation1995). This test was run using the function ‘p.adjust’ in the ‘stats’ package in Rstudio. Shape differences between these different groups were estimated using a multivariate analysis of variance (MANOVA) performed on the Procrustes coordinates, with significant interaction (α = 5%) assumed to reflect group differences. Shape variation was visualised using Principal Component Analysis (PCA) based on Procrustes coordinates and via the function ‘gm.prcomp’ in the ‘geomorph’ package. To better apprehend variations along the principal axes, we created a 3D digital mesh for each of the elements that were warped towards the Procrustes grand mean using a thin plate spline (TPS) interpolation function (Bookstein Citation1991). The visualisations of shapes at the extremes of the principal component axes were performed from the surface of the Procrustes mean configuration (Wiley et al. Citation2005), with magnification by a scale factor of 0.1, using the function ‘tps3d’ in the ‘Morpho’ package (details of the process are provided in the documentation of the package v.2.8; Schlager Citation2020). Finally, allometry was assessed using multivariate regressions of shape variables on the log-transformed centroid sizes using the function ‘procD.lm’ in the ‘geomorph’ package (Adams and Otárola-Castillo Citation2013).
Results
Size variation of skeletal elements
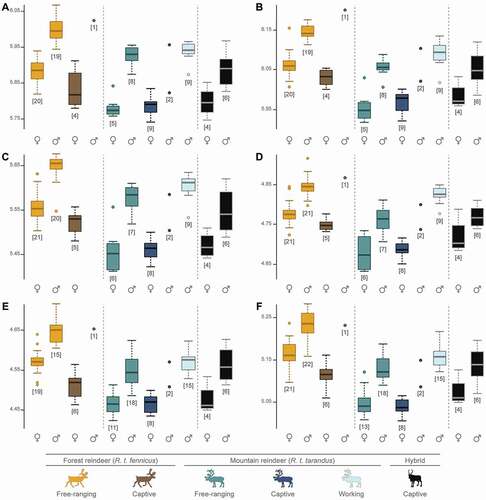
The results of the Kruskal-Wallis tests on log-transformed centroid size data reveal significant differences between all categories, namely, subspecies, sexes, lifestyles, ‘subspecies + sexes’, as well as ‘subspecies + sexes + lifestyles’ (P < 0.01; ). All six analysed epiphyses of the hindlimb long bones displayed the same pattern of size differentiation among subspecies, sexes and lifestyles (Supplementary Figs. S1, S2, S3, S4). The pairwise comparisons revealed that forest reindeer (R.t. fennicus) were systematically larger than mountain reindeer (R.t. tarandus) and hybrids (all P < 0.01), but these latter two did not differ significantly from each other (all P > 0.05; Supplementary Fig. S1). Regarding sexes, males were significantly larger than females (all P < 0.01; Supplementary Fig. S2). Male R.t. fennicus, female R.t. fennicus, male R.t. tarandus and female R.t. tarandus all showed significant differences between them for all bony elements (all P < 0.01), except between female R.t. fennicus and male R.t. tarandus for the distal parts of the femurs and tibias, as well as the proximal and distal parts of the metatarsals (P = 0.144, P = 0.526, P = 0.968 and P = 0.181, respectively; Supplementary Fig. S3). Thereby, male R.t. fennicus had the largest bony elements, female R.t. tarandus had the smallest ones, and finally male R.t. tarandus were slightly larger than female R.t. fennicus. In hybrids, males did not differ significantly from female R.t. fennicus and male R.t. tarandus, and females did not differ from female R.t. tarandus. Regarding lifestyles, free-ranging and working individuals were not statistically different (all P > 0.05). However, captive individuals were significantly smaller than free-ranging and working individuals (all P < 0.01; Supplementary Fig. S4).
Table 3. Results of the Kruskal-Wallis tests on the size for each element analysed according to the different categories. A significant contribution was considered for P-value < 0.05 (in bold)
Other particularities could be observed when the specimens were divided into 11 groups, simultaneously comprising the subspecies, sex and lifestyle (, ). Significant differences were always found between the free-ranging male R.t. fennicus – with the largest bone size – and all other groups (all P < 0.01), except between the only captive male R.t. fennicus and the two captive male R.t. tarandus. Contrariwise, the free-ranging female R.t. tarandus had a smaller bone size and were generally significantly different from all other populations (all P < 0.01), except captive individuals in both subspecies and hybrids (all P > 0.05). In R.t. fennicus, captive female individuals were significantly smaller than their wild counterparts (i.e. free-ranging), while this size difference was not significant between captive and free-ranging females in R.t. tarandus. However, the small number of captive male individuals for both subspecies did not allow us to identify any size differences with other groups, particularly between captives and free-ranging male individuals. Furthermore, there were important overlaps in the size range for many bony elements, and very few significant differences were found, especially between free-ranging female R.t. fennicus, captive male R.t. fennicus, free-ranging male R.t. tarandus, captive male R.t. tarandus, working male R.t. tarandus and captive male hybrids. However, free-ranging female R.t. fennicus appear to have smaller bony elements than male R.t. tarandus, while working reindeer appear to be male R.t. tarandus with the largest bones. Finally, captive female and male hybrids appear to have an intermediate size compared to captive females and males of both subspecies.
Table 4. Multi-test comparisons (P-values) of log-transformed centroid sizes for each element analysed between the different reindeer groups (pairwise Wilcoxon rank tests after the ‘Benjamini–Hochberg’ correction). A significant contribution was considered for P-value < 0.05 (in bold)
Figure 3. Boxplots of the variation in log-transformed centroid size according to the subspecies (R.t. tarandus, R.t. fennicus and hybrids), sex (male = ♂ and female = ♀) and lifestyle (free-ranging, captive and working). A: proximal femur; B: distal femur; C: proximal tibia; D: distal tibia; E: proximal metatarsal; F: distal metatarsal. The numbers in square brackets represent the number of bones analysed by elements in each group.
Shape variation of skeletal elements
With the exception of proximal epiphysis of the femur and distal epiphysis of the tibia, MANOVA analyses revealed at least a significant difference in shape among some groups for all the other elements, although it varied according to the bone or category investigated (). In contrast to what we have previously noted concerning size differences of the bone elements, shape did not differentiate significantly between the ‘subspecies’, ‘sexes’ and ‘lifestyles’ categories (except for the proximal metatarsal). However, significant differences were noted for the ‘subspecies + sex’ category for the distal femur and metatarsal. Furthermore, significant differences were found for the proximal parts of the tibia and metatarsal, as well as the distal parts of the femur and metatarsal among the ‘subspecies + sexes + lifestyles’ category.
Femur: For the proximal femur epiphysis, the first two axes of the PCA expressed 27.85% of the global variance and did not appear to show preferential variations according to the different groups (). Despite these significant overlaps, it would appear that females, all categories included (i.e. free-ranging and captive in both subspecies, as well as hybrids) and free-ranging male R.t. tarandus, were more distributed on the positive values of the PC1. This showed a more slender and thin aspect with a rounded femoral head and a shorter and thinner neck. In addition, the greater trochanter convexity was less developed laterodistally and the top was less pronounced. At the opposite, morphological variation along the negative values of the PC1 showed a more massive morphology, where more male specimens were located. In particular, this was expressed by a large femoral head and neck. The greater trochanter convexity was more expanded laterodistally and the top of the greater trochanter was more developed. However, the variations along axis 2 did not allow us to observe preferential group trends. In contrast, the variations for the distal femur epiphysis were more marked between groups and expressed both sexual and subspecific variations, but also lifestyles in the morphospace on the PC1 (). The PC1 (18.68% of the global variance) isolates free-ranging R.t. fennicus individuals fairly well on the positive part from R.t. tarandus and hybrids. In addition, the separation of individual captive and free-ranging reindeer within their respective subspecies (i.e. R.t. fennicus, R.t. tarandus and hybrids) was also relatively well visible. Thus, this resulted in a more massive morphology at the maximum of PC1, as in the free-ranging male R.t. fennicus. The distal epiphysis was broad with well-developed condyles. The medial condyle surface was comparable in size to the lateral condyle surface, both being separated by a narrow intercondylar space. The trochlea was wide with large medial and lateral lips separated by a deep trochlear groove. The femoral medial patellar margin showed a more circular section. The negative values of the PC1 exhibited a more slender morphology, as in the captive female R.t. tarandus and hybrids. The distal epiphysis was more medially orientated and craniocaudally broader, while the trochlear lips were separated by a shallower trochlear groove and the femoral medial patellar margin presents a more elliptical shape. The lateral and medial condyles were more mediolaterally oblique and separated by a wider intercondylar space. Within the subspecies and hybrids, females and captive individuals were distributed more towards the negative values of the PC1 compared to males and free-ranging individuals, respectively. However, like the proximal epiphysis, the variations along the PC2 did not allow for preferential group trends to be observed.
Tibia: The proximal tibia epiphysis generally followed the same variations along PC1 as the distal femur epiphysis for each group (). The PC1 (15.18% of the global variance) distinguished roughly free-ranging R.t. fennicus (males and females) on the positive part with free-ranging and captive female R.t. tarandus and female hybrids on the negative part. The captive female R.t. fennicus and working male R.t. tarandus also fell towards the negative values of the PC1. The theoretical shape at the PC1 maximum showed a massive morphology with a mediolaterally and craniocaudally broad epiphysis. The central intercondylar area was reduced and the extensor groove was deeper. The lateral and medial articular surface areas were roughly similar with a caudally extended sliding surface for the m. popliteus. The tibial tuberosity was also rounded and elongated. In contrast, negative values of the PC1 displayed a relatively gracile morphology with a relatively large central intercondylar area and a shallow extensor groove. The lateral articular surface was larger than the medial surface, while the tibial tuberosity was slightly mediolaterally broader. The PC2 (11.40% of the global variance) instead showed a sexual distinction, in which males led the variation more towards the positive value of the axis, and females towards the negative values (except for the captive female R.t. fennicus). This resulted in a more slender morphology on the negative values of PC2, and more massive on the positive values. Thus, in females, the proximal epiphysis appeared to be mediolaterally narrower and had a tibial tuberosity that deviated medially. In contrast, variations in the distal tibia epiphysis were expressed differently in the morphospace on both the PC1 and PC2 (). Captive individuals in both subspecies appeared to be distribute more towards the negative value of the PC1 (15.90% of the global variance), in the same way in males and females, compared to their free-ranging counterparts. The negative values of the PC1 expressed more of a mediolaterally broader distal section and a less prominent medial malleolus. The distal articular surface was distally more stretched on the caudal and cranial edges, respectively. On the positive values of the PC1, the morphology was squarer with a prominent medial malleolus and a less distally pronounced distal articular surface on the caudal edge. Despite some overlaps between groups, the PC2 (9.69%) roughly separated R.t. fennicus on the negative part and R.t. tarandus on the positive part. Mountain reindeer R.t. tarandus appeared to have a distal epiphysis with a more rectangular general morphology and with larger but shallower grooves than R.t. fennicus, with a rather square distal articular surface. The lateral malleolar sulcus was also larger and more developed in R.t. fennicus (negative values of the PC2).
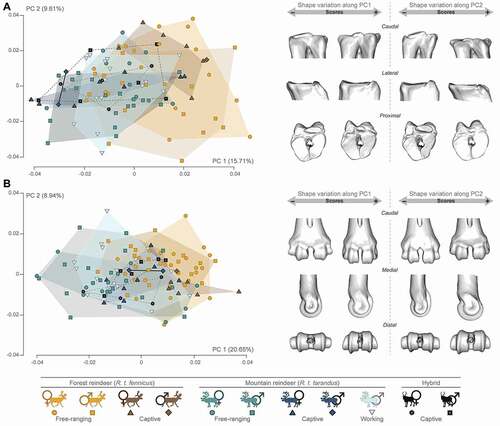
Metatarsal: Despite the overlaps, the proximal part of the metatarsal appeared to show some distinctions on the PC1 (15.71% of the global variance). Indeed, R.t. fennicus tended to spread more towards positive values, while R.t. tarandus were more localised towards negative values (). The theoretical shape at the PC1 maximum showed a massive morphology with a craniocaudally broad epiphysis, but the space between the articular surface for the lateral cuneiform bone and the articular surface for the naviculo-cuboid bone was narrower. Thus, the posterior articular surface for the naviculo-cuboid bone was smaller than the articular surface for the medial cuneiform bone. In addition, the postero-lateral part of the proximal epiphysis was markedly more developed proximally. At the opposite, negative values indicated a more slender morphology, less craniocaudally stretched. The space between the articular surface for the lateral cuneiform bone and the articular surface for the naviculo-cuboid bone was broader and the postero-lateral part of the proximal epiphysis was markedly less developed. Also, the posterior articular surface for the naviculo-cuboid bone was more extensive than the articular surface for the medial cuneiform bone. Female and captive individuals tended to cluster more towards the positive values of the PC2 (9.61% of the global variance). This resulted in a flattening of the proximal articular surfaces, which were also more mediolaterally extended. Regarding the distal epiphysis of the metatarsal, the PCA also showed some minor distinction between groups firstly more distributed R.t. tarandus on the negative values of the PC1, and R.t. fennicus on the positive values of the PC1 (20.65% of the global variance; ). The epiphysis was more compressed proximodistally and more stretched craniocaudally in R.t. tarandus, while it was more stretched proximodistally and less craniocaudally in R.t. fennicus. This peculiarity was particularly marked in the captive female R.t. fennicus. Along negative values of the PC2 (8.94% of the global variance), in which there were more captive individuals, the medial and lateral edges of the articular eminences were thinner along the mediolateral axis.
Table 5. Results of the MANOVA tests on the shape of each element analysed according to the different categories. A significant contribution was considered for P-value < 0.05 (in bold)
Figure 4. Scatter plots of the two first axes (PC 1 and PC 2) of principal component analyses performed on the shape data, and visualisation of shape variation via deformation of the mean shape along negative and positive PC1 and PC2 values (magnified by a scale factor of 0.1). A: proximal femur; B: distal femur. The proportion of the total variance expressed by the axes PC1 and PC2, respectively, is indicated in brackets.
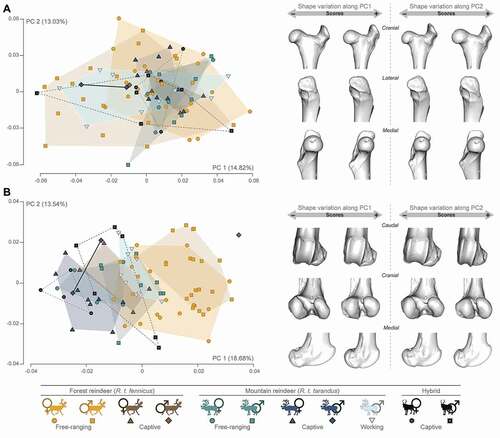
Figure 5. Scatter plots of the two first axes (PC 1 and PC 2) of principal component analyses performed on the shape data, and visualisation of shape variation via deformation of the mean shape along negative and positive PC1 and PC2 values (magnified by a scale factor of 0.1). A: proximal tibia; B: distal tibia. The proportion of the total variance expressed by the axes PC1 and PC2, respectively, is indicated in brackets.
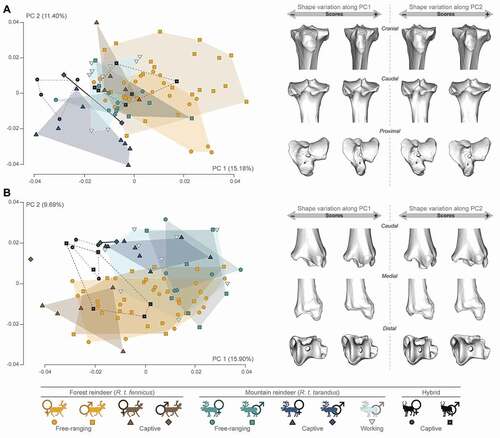
Figure 6. Scatter plots of the two first axes (PC 1 and PC 2) of principal component analyses performed on the shape data, and visualisation of shape variation via deformation of the mean shape along negative and positive PC1 and PC2 values (magnified by a scale factor of 0.1). A: proximal metatarsal; B: distal metatarsal. The proportion of the total variance expressed by the axes PC1 and PC2, respectively, is indicated in brackets.
Allometry
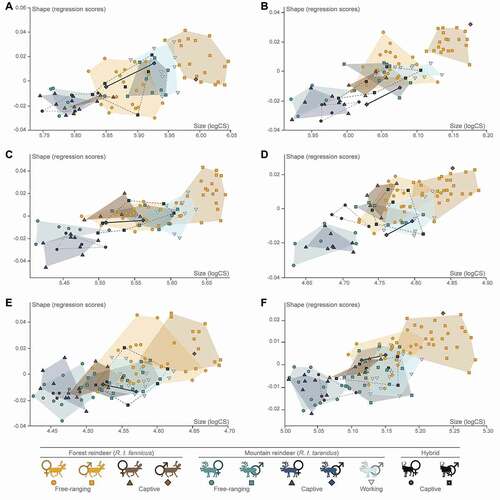
For all epiphyses, allometry was significant (all P < 0.01). Although the percentage of shape variance related to size was always relatively low (proximal femur: 2.94%; distal femur: 11.07%; proximal tibia: 6.38%; distal tibia: 3.54%; proximal metatarsal: 2.50%; distal metatarsal: 3.99%), this also indicates that the allometric pattern varies slightly depending on the bone. Multivariate regressions of shape scores against log-transformed centroid size showed that the free-ranging male R.t. fennicus had the largest centroid size and was quite distinguishable from the other groups (). At the opposite, the captive and free-ranging female R.t. tarandus and captive hybrids had the smallest centroid size. Generally, captive individuals had either lower shape scores or a lower centroid size than free-ranging individuals, as well as in males compared to females, whether in R.t. tarandus, R.t. fennicus or hybrids. The separation between these groups was similar and consistent with previous analyses (i.e. size and shape), although controlling the allometry, morphological variations showed this to be less evident between intermediate groups. The overlaps mainly concerned male R.t. tarandus for all lifestyles combined (i.e. captive, free-ranging and working), female R.t. fennicus (i.e. captive and free-ranging) and male hybrids. However, for similar shape scores, particularly for femur (proximal and distal) and proximal tibia, working male R.t. tarandus showed the highest values in centroid size compared to the free-ranging and captive female R.t. fennicus, as well as the free-ranging and captive male R.t. tarandus and hybrids. In contrast for a given size, particularly for the distal tibia and metatarsal (proximal and distal), working male R.t. tarandus generally had lower shape scores than female R.t. fennicus. Finally, clusters of the different groups overlapped less for the femur and the tibia than for the metatarsal.
Figure 7. Multivariate regression plots performed on shape data (regression scores) and log-transformed centroid size (logCS) according to the subspecies (R.t. tarandus, R.t. fennicus and hybrids), sex (male = ♂ and female = ♀) and lifestyle (free-ranging, captive and working). A: proximal femur; B: distal femur; C: proximal tibia; D: distal tibia; E: proximal metatarsal; F: distal metatarsal.
Discussion
Importance of subspecies and sex for identifying early domesticated reindeer in Fennoscandia
In this study, we showed that R.t. fennicus have significantly larger bones than R.t. tarandus, which is in accordance with previous studies (Puputti and Niskanen Citation2009; Pelletier et al. Citation2020). Our analyses of morphological variation also allowed a relatively good distinction between the two reindeer subspecies, although this distinction appears to be more evident on the femur and tibia than on the metatarsal. For example, the patellar surface of the distal femur presents a more circular section in R.t. fennicus, while it is more elliptical in R.t. tarandus. For the lateral tibial plateau, the morphology is more round in proximal view in R.t. fennicus and more compressed in the medial-lateral direction in R.t. tarandus. This is in accordance with the work of Curran (Citation2012, Citation2015) which reveal adaptations to closed (i.e. taiga-type in the case of R.t. fennicus) or open (i.e. tundra-type in the case of R.t. tarandus) environments. This indicates a relatively strong phylogenetic signal on the shape of the long bones of the hindlimb related to locomotion and adaptation to their environment. However, the few morphological differences between the subspecies for the metatarsal would indicate that this bone probably does not respond similarly to frequency and magnitude of function compared to more proximal limb elements. Indeed, their overall morphology is more likely to reflect a greater involvement in the support of the limbs and therefore of the body mass (Niinimäki et al. Citationin press; Pelletier et al. Citationsubmitted).
It has already been hypothesised that these morphological differences on the long limb bones between both subspecies could be due to behavioural and ecological differences (Pelletier et al. Citation2020). Indeed, R.t. tarandus is a more gregarious reindeer living in more open tundra areas to the north, while R.t. fennicus has a more complex social organisation in a more closed taiga environment to the south. In this respect, R.t. fennicus is significantly better adapted to taiga conditions with a deep and soft snow cover – which explains the greater withers height and leg length – while R.t. tarandus lives on hard-packed tundra snow (Nieminen and Helle Citation1980). Thus, the identification of the subspecies at archaeological sites appears to be an essential prerequisite for understanding the history of the past Sámi communities, since this may reflect different subsistence strategies or cultural interpretations. Indeed, the presence of R.t. fennicus in a deposit could directly induce a subsistence strategy based on hunting, since this subspecies has never visibly been domesticated in these regions, while the presence of R.t. tarandus could involve herding (e.g. Salmi et al. Citation2018; Salmi and Heino Citation2019; Heino et al. Citation2021). In addition, since the two subspecies also have different eco-ethologies, this could affect the hunting strategies of past human societies, including mass hunting in the case of the wild mountain reindeer R.t. tarandus or individual hunting in the case of the wild forest reindeer R.t. fennicus (Rankama and Ukkonen Citation2001). However, the two reindeer subspecies now share ecological similarities in some Fennoscandian regions, which could make it difficult to accurately assess the environmental effect on bone shape. Although they appear to have had more marked biotopes in the past than today (Helle Citation1982), this should be evaluated with the utmost caution since it is historically known that the ranges of wild and domestic reindeer have fluctuated greatly under the pressure of various anthropogenic and/or climatic factors (Ingold Citation1980; Reimers and Colman Citation2006; Pape and Löffler Citation2012; Bergman et al. Citation2013).
In addition to phylogeny, sex also leads a significant part of variations in the shape of the bony elements of the hindlimb. Our results confirmed that male reindeer had significantly larger bone elements than female reindeer, which is explained by a strong sexual dimorphism (Reimers et al. Citation1983; Weinstock Citation2000; Puputti and Niskanen Citation2009; Melnycky et al. Citation2013; Pelletier et al. Citation2020). This difference was also significant within subspecies, in which the largest body size was found in male R.t. fennicus, then in male R.t. tarandus, female R.t. fennicus and finally in female R.t. tarandus, which had the smallest bone dimensions. In terms of morphology, this resulted in more massive bones in male individuals and slender bones in females, which is probably due to the different weight-bearing functions of the skeletal elements. In general, identifying sex is relatively easy and is often applied in archaeology to establish sex ratios and identify the hunting methods and/or reindeer exploitation by past Sámi societies (e.g. Puputti and Niskanen Citation2009; Salmi et al. Citation2015, Citation2021). In fact, this has an even greater implication for finding domestic individuals in the fossil record since domestic males R.t. tarandus are preferentially used for transport and pulling (Korhonen Citation2008; Salmi and Niinimäki Citation2016). This is because males are larger and more robust than females, which makes them more capable of carrying out domestic tasks, although female R.t. tarandus could also be present in domestic Sámi herds, especially for milking purposes (Tegengren Citation1952; Aronsson Citation1991). However, the composition and structure of the herds has changed over time, particularly the transition to meat production-based reindeer herding. Thus, the highest possible proportion of breeding-age female reindeer became optimal, in contrast to a minimum number of males to serve the females successfully during the rut (Holand Citation2007).
Another factor that could lead to the misidentification of subspecies and/or sex in archaeological assemblages is the possibility of finding hybrid individuals that are the result of crossbreeding between R.t. fennicus and R.t. tarandus. Since domestic reindeer are mostly left to free range by Sámi herders, this hybridisation between the two subspecies could then occur in areas in which their distribution ranges overlap (Nieminen and Helle Citation1980; Nieminen and Ojutkangas Citation1986; Røed et al. Citation2008, Citation2011). It is also highly likely that wild individuals have been captured to incorporate them into domestic herds in order to avoid consanguinity (Sommerseth Citation2011). The main problem of their potential presence in archaeological contexts could be the potentially large overlap between hybrids and their parents in terms of morphometric diversity. Indeed, hybrids can present morphological traits that are more similar to a particular parent, as well as an intermediate morphology and size (Evin et al. Citation2015; Hanot et al. Citation2017, Citation2019; Hanot and Bochaton Citation2018; Savriama et al. Citation2018). In our study, hybrid individuals are morphometrically intermediate to their parents. Specifically, female hybrids have an intermediate size compared to female R.t. fennicus and R.t. tarandus, in the same way that male hybrids have an intermediate size compared to male R.t. fennicus and R.t. tarandus, and which are also closer to female R.t. fennicus. Regarding morphology, the hybrids (both sexes included) were closer to R.t. tarandus than to R.t. fennicus. This resulted in more slender epiphyses, although it appeared to be significantly more evident in the distal femur and proximal tibia. The inclusion of hybrid individuals in our study revealed significant overlaps in both size and bone shape variations, particularly in the case of intermediate specimens such as male hybrids and wild female R.t. fennicus. Thus, their presence on an archaeological site could lead to further confusion in the interpretation of fossil material.
Impact of selection and archaeological perspectives for the identification of early domesticated reindeer
Beyond the impact of phylogeny, ecology and sex on morphometric variation among Finnish modern reindeer populations, there is also a significant impact of lifestyle on bone morphology. Despite the small number of captive male individuals in our sample, individuals bred in captivity generally had smaller bones compared to free-ranging reindeer. This reduction in body size of captive individuals relative to their wild counterparts is a typical characteristic of the domestication syndrome and has been long observed in many other domestic species (e.g. Davis Citation1981; Morey Citation1992; Dayan Citation1994; Zohary et al. Citation1998; Zeder et al. Citation2006; Rowley-Conwy et al. Citation2012). In reindeer, it had already been noted that domesticated individuals were smaller than wild ones (Puputti and Niskanen Citation2009; Pelletier et al. Citation2020). However, it is important to note that most captive individuals in our sample were born in the wild and do not have a long ancestry in zoo (Pudas, personal communication). This would therefore imply that the effects of a reduction in mobility are observed forthwith and are evident without even a preferential selection. This observation appears to be consistent with recent experimental work carried out on pigs and wild boars (Harbers et al. Citation2020a; Neaux et al., Citation2020). Body size reduction in captivity appears to be particularly more evident for wild forest reindeer (R.t.fennicus) than for R.t. tarandus. This could be explained by the fact that there are no longer any completely wild modern R.t. tarandus genetic lineages in Finland following the introgression of domestic reindeer into the wild gene pool in the 19th century (Røed et al. Citation2011, Citation2014) and/or resulting from a strong selection of individuals in breeding for several centuries. Thus, the impact of captivity on these R.t. tarandus individuals was not perceptible in our sample, but could have occurred during the early stages of domestication, as we observed in R.t.fennicus.
Captivity also resulted in significant changes in terms of bone morphology, although this was observed more on the femur and tibia than on the metatarsal. Despite some overlaps with their free-ranging counterparts, captive female R.t. tarandus differed relatively well from the other categories. Indeed, the bony elements had a smaller size and a generally more slender shape than male R.t. tarandus or R.t. fennicus. In contrast, wild male R.t. fennicus were also relatively easy to identify since their bones were larger and had a more robust shape. The fact that female R.t. tarandus and wild male R.t. fennicus were potentially the easiest to identify from the archaeological record directly suggests opposing socio-economic strategies among past Sámi groups (e.g. Salmi et al. Citation2018; Salmi and Heino Citation2019; Heino et al. Citation2021). As in the early phases of husbandry, these groups kept small domestic herds close to settlements and the identification of small-size female R.t. tarandus could involve herding since females were used for milking (Tegengren Citation1952). Conversely, the identification of male R.t. fennicus involves wild reindeer hunting and therefore a diametrically opposed human-reindeer relationship.
On the other hand, the identification of male R.t. tarandus proved to be more difficult. However, this identification is of major interest for the application to the fossil record since these reindeer were preferentially used by the Sámi for transport and pulling (Korhonen Citation2008; Salmi and Niinimäki Citation2016). Except for the femur and metatarsal distal epiphyses, no significant differences in size were found between free-ranging, captives and working male individuals. Nevertheless, working individuals tended to be larger than free-ranging individuals. This could be explained by the fact that working reindeer are selected for their physical properties and ability to perform domestic work, although other characteristics such as personality and behaviour can be considered to be the most important criteria (Soppela et al. Citation2020). Thus, size reduction should not be a reliable criterion for identifying male domestic R.t. tarandus. In addition, we did not note any significant differences in shape between free-ranging and working R.t. tarandus. We believe that this could be explained by the fact that, apart from their use for domestic tasks (e.g. pulling sleds, racing), working reindeer are to left free range, just like wild individuals. Activity levels can therefore be similar most of the time, leading to similar size and robustness requirements on hindlimb long bones.
However, there is a noticeable difference between the largest individuals with more robust and generally more enlarged epiphyses, and captive individuals whose reduced activity and smaller body size result in a more slender morphology. For the proximal femur, the epiphysis was more developed mediolaterally in larger male reindeer, particularly the free-ranging R.t. fennicus and most of the working R.t. tarandus. This could indicate a stronger resistance to constraints linked to both body propulsion and weight bearing (Kappelman Citation1988; Mallet et al. Citation2019 and references therein). At the same time, the distolateral development of the greater trochanter partially enhances a large lever arm for the muscles attached to the proximal femur, allowing strong hip flexion and abduction. In these larger individuals, the improvement in weight bearing and the amplitude of flexion are favoured by a more deviated position of the knee. This is expressed by a greater lateral torsion of the rotation axis of the trochlea for the distal epiphysis of the femur, as well as a more medially widened tibial plateau. In addition, the enlargement of the tibial tuberosity involves the presence of a stronger and larger patellar ligament, which strengthens the knee joint (Mallet et al. Citation2019). This general conformation, mainly of the femur and tibia, provides greater stability to the knee joint, in particular among cursorial cervids (Hildebrand Citation1985). This would be due to repetitive flexion of the knee articulation, more involved during propulsion (Kappelman Citation1988; Curran Citation2012). In R.t. fennicus this may be partially explained by body mass and adaptation to the closed environments of the taiga, while in working reindeer it could imply a need for a large range of motion in the hip and knee joint (Salmi et al. Citation2020b). However, this activity is reduced or even absent in captive individuals. In addition, the distal tibia and distal metatarsal epiphyses appeared to widen mediolaterally among captive individuals. This widening of more caudal limb elements and their distal ends could be a result of the need to strengthen articular areas for prolonged periods of static loading, as has been observed on the forelimb (Pelletier et al. Citation2020).
Thus, the reduction in body size of wild individuals in captivity could be the first element to consider in identifying domestic individuals in the archaeological record. However, this does not concern all individuals that comprise the herds kept by the herders, as most of them are left to free range. The focus must be on particular individuals, namely, some domestic female R.t. tarandus that could be used for milking and kept close to settlements, or larger male R.t. tarandus that are instead chosen for domestic tasks such as transport or pulling. In addition, the control of mobility combined with their use to perform domestic tasks induces significant changes in the bone morphology of reindeer. As the activity of captive individuals is greatly reduced, general morphology would trend towards greater gracility than their free-ranging counterparts. In contrast, the bones of the hindlimb appear to be more adapted to propulsion and weight bearing in working reindeer. However, to our knowledge, there is no evidence to suggest that Fennoscandian reindeer were kept in total captivity from the Iron Age. These particular individuals had to be tamer and kept close to settlements under fairly close supervision by Sámi herders, rather than kept corralled. In any event, these small domestic herds were probably engaging in lower levels of physical activity compared to free-ranging animals. Also, the presence of wild individuals identified from fossil bones, such as wild R.t. fennicus, is not necessarily evidence of the absence of domestication by Sámi. Indeed, Sámi groups had long continued to hunt wild reindeer along with the breeding of domestic individuals (Bjørklund Citation2013; Hansen and Olsen Citation2014). For example, in Sámi sacrificial sites, wild and/or domestic reindeer bones were frequently deposited and could reflect cultural changes within these groups (Salmi et al. Citation2015, Citation2018, Citation2020a; Salmi and Heino Citation2019; Heino et al. Citation2021). Finally, the domestication process is even more difficult to understand since it has been gradual and does not appear to have been synchronous in the different regions, nor with the same amplitude (Tegengren Citation1952; Lundmark Citation2007; Korhonen Citation2008; Bjørklund Citation2013). A careful analysis of the size, shape and allometry of reindeer bones, as well as the archaeological context and associated cultural material, are all essential parameters to be taken into consideration in order to better understand early reindeer management by the Sámi in Fennoscandia.
Conclusion
Historically, reindeer have probably been one of the most recently domesticated species by humans. In this respect, many scholars consider them to still be in the early stages of the domestication and could serve as an excellent model species to understand how the initial steps of this process may have occurred. Thus, the identification of relevant biomarkers on the skeleton appears to be an essential prerequisite for documenting the origin of this process. Our study has demonstrated the potential of 3D GMM studies to identify subspecies, sex and lifestyle among modern reindeer populations from Finland. Our results showed significant changes in the size and shape of most of the isolated elements of the hindlimb, allowing a relatively reliable distinction between wild and domesticated individuals. Captivity, which results in less activity, leads to reduced body size and a more thin and slender bone morphology in domesticated individuals than their wild counterparts. In contrast, working reindeer, which are specially selected for their aptitude to perform domestic tasks (e.g. transport and pulling), are larger and more robust; their bones are more adapted to the constraints linked to body propulsion and weight bearing. These plastic changes associated with selection and domestication can be used as a proxy for the early process of reindeer management in the archaeological record and can therefore to shed light on the evolution of socio-economic models of the different Sámi communities of reindeer herders in Fennoscandia. However, caution must be exercised with regard to the correct identification of domestic reindeer due to a domestication process that took place gradually and in a non-synchronous manner in the different regions, and which did not have the same amplitude. In addition, Sámi populations have simultaneously practiced wild reindeer hunting and small-scale reindeer herding for several centuries. Every parameter such as size, shape and allometry must be thoroughly analysed and coupled with archaeological contexts in order to be able to identify individuals and better understand the morphometric variability of reindeer in Fennoscandia. New studies allowing for a better understanding of the morphometric diversity of reindeer should be carried out in the future (e.g. cross-sections, teeth), complemented by analyses of ancient DNA, stable isotopes, morpho-functional investigations and entheseal changes and pathological lesions. Such studies would allow for the refinement of research on archaeological sites in order to better identify early reindeer domestication and herding practices in time and space.
Author’s contributions
MP and AKS conceived and designed the study. AK conducted the CT scans in collaboration with MP and SN. MP collected, analysed and interpreted the morphometric data and wrote the original draft. AKS, AK and SN reviewed and edited the paper. All authors read and approved the final manuscript.
Acknowledgments
We are grateful to Tuula Pudas and Jaakko Tauriainen who prepared the working reindeer skeletons and who granted us access to the Zoological Museum collections of the University of Oulu. Thanks to Jarmo Kynkäänniemi and Mika Lappalainen who provided racing and working reindeers for our study. We would also like to thank the Department of Radiology, Oulu University Hospital (OYS) for allowing us access to the computed tomography scanner for the development of 3D models. Finally, we are very grateful to the reviewers for their constructive comments that greatly improved the quality of the manuscript.
Disclosure statement
No potential conflict of interest was reported by the author(s).
Additional information
Funding
References
- Adams DC, Otárola-Castillo E. 2013. Geomorph: an R package for the collection and analysis of geometric morphometric shape data. Meth Ecol Evol. 4(4):393–399. doi:https://doi.org/10.1111/2041-210X.12035.
- Adams DC, Rohlf FJ, Slice DE. 2004. Geometric morphometrics: ten years of progress following the ‘revolution’. Italian Journal of Zoology. 71(1):5–16. doi:https://doi.org/10.1080/11250000409356545.
- Albarella U. 2002. “Size matters”: how and why biometry is still important in zooarchaeology. In: Dobney K, O’Connor T, editors. Bones and the man: studies in honour of don brothwell. Oxford: Oxbow Books; p. 51–62.
- Anderson DG, Kvie KS, Davydov VN, Røed KH. 2017. Maintaining genetic integrity of coexisting wild and domestic populations: genetic differentiation between wild and domestic Rangifer with long traditions of intentional interbreeding. Ecology and Evolution. 7(17):6790–6802. doi:https://doi.org/10.1002/ece3.3230.
- Arbuckle B. 2005. Experimental animal domestication and its application to the study of animal exploitation in prehistory. In: Vigne J-D, Peters J, Helmer D, editors. The first steps of animal domestication. New archaeozoological approaches. Oxford: Oxbow Books; p. 18–33.
- Aronsson K-Å 1991. Forest reindeer herding A.D. 1–1800. An archaeological and paleoecological study in Northern Sweden [PhD dissertation]. Umeå: Umeå University.
- Baskin LM. 2000. Reindeer husbandry/hunting in Russia in the past, present and future. Polar Res. 19(1):23–29. doi:https://doi.org/10.3402/polar.v19i1.6526.
- Baskin LM. 2005. Number of wild and domestic reindeer in Russia in the late 20th century. Rangifer. 25(1):51–57. doi:https://doi.org/10.7557/2.25.1.337.
- Benjamini Y, Hochberg Y. 1995. Controlling the false discovery rate: a practical and powerful approach to multiple testing. J R Stat Soc Ser B Stat Method. 57(1):289–300. doi:https://doi.org/10.1111/j.2517-6161.1995.tb02031.x.
- Bergman I, Zackrisson O, Liedgren L. 2013. From hunting to herding: land use, ecosystem processes, and social transformation among sami AD 800-1500. Arctic Anthropology. 50(2):25–39. doi:https://doi.org/10.3368/aa.50.2.25.
- Bjørklund I. 2013. Domestication, reindeer husbandry and the development of Sámi pastoralism. Acta Borealia. 30(2):174–189. doi:https://doi.org/10.1080/08003831.2013.847676.
- Bjørnstad G, Flagstad Ø, Hufthammer A, Røed KH. 2012. Ancient DNA reveals a major genetic change during the transition from hunting economy to reindeer husbandry in northern Scandinavia. . Journal of Archaeological Science. 39(1):102–108. doi:https://doi.org/10.1016/j.jas.2011.09.006.
- Bookstein FL. 1991. Morphometric tools for landmark data: geometry and biology. Cambridge: Cambridge University Press.
- Bookstein FL. 1996. Biometrics, biomathematics and the morphometric synthesis. Bulletin of Mathematical Biology. 58(2):313–365. doi:https://doi.org/10.1007/BF02458311.
- Bookstein FL. 1997. Landmark methods for forms without landmarks: morphometrics of group differences in outline shape. Medical Image Analysis. 1(3):225–243. doi:https://doi.org/10.1016/S1361-8415(97)85012-8.
- Cornette R, Herrel A, Stoetzel E, Moulin S, Hutterer R, Denys C, Baylac M. 2015. Specific information levels in relation to fragmentation patterns of shrew mandibles: do fragments tell the same story? Journal of Archaeological Science. 53:323–330. doi:https://doi.org/10.1016/j.jas.2014.10.020
- Cucchi T, Stopp B, Schafberg R, Lesur J, Hassanin A, Schibler J. 2019. Taxonomic and phylogenetic signals in bovini cheek teeth: towards new biosystematic markers to explore the history of wild and domestic cattle. Journal of Archaeological Science. 109:104993. doi:https://doi.org/10.1016/j.jas.2019.104993
- Curran SC. 2012. Expanding ecomorphological methods: geometric morphometric analysis of Cervidae post-crania. Journal of Archaeological Science. 39(4):1172–1182. doi:https://doi.org/10.1016/j.jas.2011.12.028.
- Curran SC. 2015. Exploring eucladoceros ecomorphology using geometric morphometrics. The Anatomical Record. 298(1):291–313. doi:https://doi.org/10.1002/ar.23066.
- Davis SJM. 1981. The effects of temperature change and domestication on the body size of Late Pleistocene to Holocene mammals of Israel. Paleobiology. 7(1):101–114. doi:https://doi.org/10.1017/S0094837300003821.
- Dayan T. 1994. Early domesticated dogs of the Near East. Journal of Archaeological Science. 21(5):633–640. doi:https://doi.org/10.1006/jasc.1994.1062.
- Drake AG, Coquerelle M, Colombeau G. 2015. 3D morphometric analysis of fossil canid skulls contradicts the suggested domestication of dogs during the late Paleolithic. Scientific Reports. 5(1):8299. doi:https://doi.org/10.1038/srep08299.
- Dryden IL, Mardia KV. 1998. Statistical shape analysis. New-York: Wiley.
- Dwyer MJ, Istomin KV. 2008. Theories of nomadic movement: a new theoretical approach for understanding the movement decisions of nenets and komi reindeer herders. Human Ecology. 36(4):521. doi:https://doi.org/10.1007/s10745-008-9169-2.
- Evin A, Cucchi T, Cardini A, Vidarsdottir US, Larson G, Dobney K. 2013. The long and winding road: identifying pig domestication through molar size and shape. Journal of Archaeological Science. 40(1):735–743. doi:https://doi.org/10.1016/j.jas.2012.08.005.
- Evin A, Dobney K, Schafberg R, Owen J, Vidarsdottir US, Larson G, Cucchi T. 2015. Phenotype and animal domestication: a study of dental variation between domestic, wild, captive, hybrid and insular Sus scrofa. BMC Evolutionary Biology. 15(1):6. doi:https://doi.org/10.1186/s12862-014-0269-x.
- Evin A, Owen J, Larson G, Debiais-Thibaud M, Cucchi T, Vidarsdottir US, Dobney K. 2017. A test for paedomorphism in domestic pig cranial morphology. Biology Letters. 13(8):20170321. doi:https://doi.org/10.1098/rsbl.2017.0321.
- Fjellström M, Eriksson G, Angerbjörn A, Lidén K. 2020. Approaching historic reindeer herding in northern Sweden by stable isotope analysis. J Nordic Archaeol Sci. 19:63–75.
- Geiger M, Evin A, Sánchez-Villagra MR, Gascho D, Mainini C, Zollikofer CPE. 2017. Neomorphosis and heterochrony of skull shape in dog domestication. Scientific Reports. 7(1):13443. doi:https://doi.org/10.1038/s41598-017-12582-2.
- Gunz P, Mitteroecker P, Bookstein FL. 2005. Semilandmarks in three dimensions. In: Slice DE, editor. Modern morphometrics in physical anthropology. New-York: Kluwer Academic/Plenum Publishers; p. 73–98.
- Gunz P, Mitteroecker P. 2013. Semilandmarks: a method for quantifying curves and surfaces. Hystrix. 24(1):103–109. doi:https://doi.org/10.4404/hystrix-24.1-6292.
- Hakala AVK, Heikura K, Markovsky VA, Bljudnik L, Pulliainen E, Danilov PI. 1996. On the taxonomy and geographical variation of the European reindeer with special reference to the wild forest reindeer, Rangifer tarandus fennicus Lönnberg 1909. Aquilo Ser Zool. 29:3–23.
- Hanot P, Bochaton C. 2018. New osteological criteria for the identification of domestic horses, donkeys and their hybrids in archaeological contexts. Journal of Archaeological Science. 94:12–20. doi:https://doi.org/10.1016/j.jas.2018.03.012
- Hanot P, Guintard C, Lepetz S, Cornette R. 2017. Identifying domestic horses, donkeys and hybrids from archaeological deposits: a 3D morphological investigation on skeletons. Journal of Archaeological Science. 78:88–98. doi:https://doi.org/10.1016/j.jas.2016.12.002
- Hanot P, Herrel A, Guintard C, Cornette R. 2018. The impact of artificial selection on morphological integration in the appendicular skeleton of domestic horses. Journal of Anatomy. 232(4):657–673. doi:https://doi.org/10.1111/joa.12772.
- Hanot P, Herrel A, Guintard C, Cornette R. 2019. Unravelling the hybrid vigor in domestic equids: the effect of hybridization on bone shape variation and covariation. BMC Evolutionary Biology. 19(1):188. doi:https://doi.org/10.1186/s12862-019-1520-2.
- Hansen LI, Olsen B. 2014. Hunters in transition: an outline of early Sami history. Leiden: Brill.
- Harbers H, Neaux D, Ortiz K, Blanc B, Laurens F, Baly I, Callou C, Schafberg R, Haruda A, Lecompte F, et al. 2020a. The mark of captivity: plastic responses in the ankle bone of a wild ungulate (Sus scrofa). Royal Society Open Science. 7(3):192039. doi:https://doi.org/10.1098/rsos.192039.
- Harbers H, Zanolli C, Cazenave M, Theil J-C, Ortiz K, Blanc B, Locatelli Y, Schafberg R, Lecompte F, Baly I, et al. 2020b. Investigating the impact of captivity and domestication on limb bone cortical morphology: an experimental approach using a wild boar model. Scientific Reports. 10(1):19070. doi:https://doi.org/10.1038/s41598-020-75496-6.
- Haruda AF. 2017. Separating sheep (Ovis aries L.) and goats (Capra hircus L.) using geometric morphometric methods: an investigation of astragalus morphology from late and final bronze age central Asian contexts. International Journal of Osteoarchaeology. 27(4):551–562. doi:https://doi.org/10.1002/oa.2576.
- Haruda AF, Varfolomeev V, Goriachev A, Yermolayeva A, Outram AK. 2019. A new zooarchaeological application for geometric morphometric methods: distinguishing Ovis aries morphotypes to address connectivity and mobility of prehistoric Central Asian pastoralists. Journal of Archaeological Science. 107:50–57. doi:https://doi.org/10.1016/j.jas.2019.05.002
- Hedman S, Olsen B, Vretemark M. 2015. Hunters, herders and hearths: interpreting new results from hearth row sites in Pasvik, Arctic Norway. Rangifer. 35(1):1–24. doi:https://doi.org/10.7557/2.35.1.3334.
- Heino MT, Salmi A-K, Äikäs T, Mannermaa K, Kirkinen T, Sablin M, Ruokonen M, Núñez M, Okkonen J, Dalén L, et al. 2021. Replacement of wild reindeer genetic lineages by domestic ones at Sámi offering sites in Finland from 1400–1600 AD onwards. J Archaeol Sci Rep. 35:102691. doi:https://doi.org/10.1016/j.jasrep.2020.102691
- Helle TP. 1982. Peuran ja poron jäljillä. Helsinki: Kirjayhtymä.
- Helskog K, Indrelid S. 2011. Humans and reindeer. Quaternary International. 238(1–2):1–3. doi:https://doi.org/10.1016/j.quaint.2011.03.018.
- Hildebrand M. 1985. Walking and running. In: Hildebrand M, Bramble DM, Liem KF, Wake DB, editors. Functional vertebrate morphology. Cambridge: Belknap Press; p. 38–57.
- Holand Ø. 2007. Herd composition and slaughtering strategy in reindeer husbandry – revisited. Rangifer Rep. 12:21–33. doi:https://doi.org/10.7557/2.27.3.267
- Inamura T. 2005. The transformation of the community of tsaatan reindeer herders in Mongolia and their relationships with the outside world. Senri Ethnological Studies. 69:123–152. doi:https://doi.org/10.15021/00002643
- Ingold T. 1980. Hunters pastoralists and ranchers: reindeer economies and their transformation. Cambridge: Cambridge University Press. doi:https://doi.org/10.1017/CBO9780511558047.
- Ingold T. 1986. Reindeer economies: and the origins of pastoralism. . Anthropology Today. 2(4):5–10. doi:https://doi.org/10.2307/3032710.
- Kappelman J. 1988. Morphology and locomotor adaptations of the bovid femur in relation to habitat. Journal of Morphology. 198(1):119–130. doi:https://doi.org/10.1002/jmor.1051980111.
- Korhonen T. 2008. Poroerotus. In: Historia, toiminta ja tekniset ratkaisut. Helsinki: Suomalaisen Kirjallisuuden Seura; p. 310.
- Linnaeus CV. 1758. Systema naturae per regna tria naturae, secundum classes, ordines, genera, species, cum characteribus, differentiis, synonymis, locis, Tenth edition. Stockholm: Laurentii Salvii, Holmiae; p. 824.
- Losey RJ, Nomokonova T, Arzyutov DV, Gusev AV, Plekhanov AV, Fedorova NV, Anderson DG. 2021. Domestication as Enskilment: harnessing Reindeer in Arctic Siberia. Journal of Archaeological Method and Theory. 28(1):197–231. doi:https://doi.org/10.1007/s10816-020-09455-w.
- Lundmark L. 2007. Reindeer pastoralism in Sweden 1550-1950. Rangifer. 27(3):9–16. doi:https://doi.org/10.7557/2.27.3.264.
- Mallet C, Cornette R, Billet G, Houssaye A. 2019. Interspecific variation in the limb long bones among modern rhinoceroses—extent and drivers. PeerJ. 7:e7647. doi:https://doi.org/10.7717/peerj.7647
- Melnycky NA, Weladji RB, Holand Ø, Nieminen M. 2013. Scaling of antler size in reindeer (Rangifer tarandus): sexual dimorphism and variability in resource allocation. Journal of Mammalogy. 94(6):1371–1379. doi:https://doi.org/10.1644/12-MAMM-A-282.1.
- Mirov NT. 1945. Notes on the domestication of reindeer. American Anthropologist. 47(3):393–408. doi:https://doi.org/10.1525/aa.1945.47.3.02a00030.
- Morey DF. 1992. Size, shape and development in the evolution of the domestic dog. J. Journal of Archaeological Science. 19(2):181–204. doi:https://doi.org/10.1016/0305-4403(92)90049-9.
- Murashkin AI, Kolpakov EM, Shumkin VY, Khartanovich VI, Moiseyev VG. 2016. Kola Oleneostrovskiy grave field: a unique burial site in the European Arctic. In: Uino P, Nordqvist K, editors. New Sites, New Methods. Helsinki: The Finnish Antiquarian Society, ISKOS 21; p. 186–199.
- Neaux D, Blanc B, Ortiz K, Locatelli Y, Laurens F, Baly I, Callou C, Lecompte F, Cornette R, Sansalone G, et al. 2021. How changes in functional demands associated with captivity affect the skull shape of a wild boar (Sus scrofa). Evolutionary Biology. 48(1):27–40. doi:https://doi.org/10.1007/s11692-020-09521-x.
- Neaux D, Sansalone G, Lecompte F, Haruda A, Schafberg R, Cucchi T. 2020. Examining the effect of feralization on craniomandibular morphology in pigs, Sus scrofa (Artiodactyla: suidae). . Biological Journal of the Linnean Society. 131(4):870–879. doi:https://doi.org/10.1093/biolinnean/blaa156.
- Nieminen M, Helle T. 1980. Variations in body measurements of wild and semi-domestic reindeer (Rangifer tarandus) in Fennoscandia. Ann Zool Fennici. 17(4):275–283.
- Nieminen M, Ojutkangas V. 1986. Genetic variation in Finnish wild and semi-domesticated reindeer (Rangifer tarandus). Rangifer. 6(1):115. doi:https://doi.org/10.7557/2.6.1-App.630.
- Nieminen M, Pietilä UA. 1998. Peurasta poroksi. Rovaniemi: Paliskuntain yhdistys.
- Niinimäki S, Härkönen L, Puolakka H-L, Van Den Berg M, Salmi A-K. in press. Cross-sectional properties of reindeer long bones and metapodials allow identification of activity patterns. Archaeol Anthropol Sci.
- Niinimäki S, Salmi A-K. 2016. Entheseal changes in free-ranging versus zoo reindeer-observing activity status of reindeer. . International Journal of Osteoarchaeology. 26(2):314–323. doi:https://doi.org/10.1002/oa.2423.
- Owen J, Dobney K, Evin A, Cucchi T, Larson G, Vidarsdottir US. 2014. The zooarchaeological application of quantifying cranial shape differences in wild boar and domestic pigs (Sus scrofa) using 3D geometric morphometrics. Journal of Archaeological Science. 43:159–167. doi:https://doi.org/10.1016/j.jas.2013.12.010
- Pape R, Löffler J. 2012. Climate change, land use conflicts, predation and ecological degradation as challenges for reindeer husbandry in Northern Europe: what do we really know after half a century of research? Ambio. 41(5):421–434. doi:https://doi.org/10.1007/s13280-012-0257-6.
- Pelletier M, Kotiaho A, Niinimäki S, Salmi A-K. 2020. Identifying early stages of reindeer domestication in the archaeological record: a 3D morphological investigation on forelimb bones of modern populations from Fennoscandia. Archaeological and Anthropological Sciences. 12(8):169. doi:https://doi.org/10.1007/s12520-020-01123-0.
- Pelletier M, Niinimäki S, Salmi A-K. submitted. Influence of captivity and selection on limb long bone cross-sectional morphology of reindeer. J Morphol.
- Pöllath N, Schafberg R, Peters J. 2019. Astragalar morphology: approaching the cultural trajectories of wild and domestic sheep applying geometric morphometrics. J Archaeol Sci Rep. 23:810–821. doi:https://doi.org/10.1016/j.jasrep.2018.12.004
- Price EO. 2002. Animal domestication and behavior. New York: CABI Publishing.
- PuputtiA-K, Niskanen M. 2009. Identification of semi-domesticated reindeer (Rangifer tarandus tarandus, Linnaeus 1758) and wild forest reindeer (R.t. fennicus, Lönnberg 1909) from postcranial skeletal measurements. . Mammalian Biology. 74(1):49–58. doi:https://doi.org/10.1016/j.mambio.2008.03.002.
- Puputti A-K, Niskanen M. 2008. The estimation of body weight of the reindeer (Rangifer tarandus L.) from skeletal measurements: preliminary analyses and application to archaeological material from 17th- and 18th-century northern Finland. Environmental Archaeology. 13(2):153–164. doi:https://doi.org/10.1179/174963108X343272.
- R Development Core Team. 2011. R: a language and environment for statistical computing. Vienna:R Foundation for Statistical Computing.
- Rankama T, Ukkonen P. 2001. On the early history of the wild reindeer (Rangifer tarandus L.) in Finland. Boreas. 30(2):131–147. doi:https://doi.org/10.1080/713782821.
- Reimers E, Colman JE. 2006. Reindeer and caribou (Rangifer tarandus) response towards human activities. Rangifer. 26(2):55–71. doi:https://doi.org/10.7557/2.26.2.188.
- Reimers E, Klein DR, Sorumgard R. 1983. Calving time, growth rate, and body size of norwegian reindeer on different ranges. . Arctic and Alpine Research. 15(1):107–118. doi:https://doi.org/10.2307/1550986.
- Reindeer Herding (2021) A virtual guide to reindeer and the people who herd them. cited 2021 Feb 25. https://reindeerherding.org.
- Røed KH, Bjørklund I, Olsen BJ. 2018. From wild to domestic reindeer – genetic evidence of a non-native origin of reindeer pastoralism in northern Fennoscandia. J Archaeol Sci Rep. 19:279–286. doi:https://doi.org/10.1016/j.jasrep.2018.02.048
- Røed KH, Bjørnstad G, Flagstad Ø, Haanes H, Hufthammer AK, Jordhøy P, Rosvold J. 2014. Ancient DNA reveals prehistoric habitat fragmentation and recent domestic introgression into native wild reindeer. Conserv Genet. 15:1137–1149. https://doi.org/https://doi.org/10.1007/s10592-014-0606–z
- Røed KH, Flagstad Ø, Bjørnstad G, Hufthammer AK. 2011. Elucidating the ancestry of domestic reindeer from ancient DNA approaches. Quaternary International. 238(1–2):83–88. doi:https://doi.org/10.1016/j.quaint.2010.07.031.
- Røed KH, Flagstad Ø, Nieminen M, Holand Ø, Dwyer MJ, Røv N, Vilà C. 2008. Genetic analyses reveal independent domestication origins of Eurasian reindeer. Proceedings of the Royal Society B: Biological Sciences. 275(1645):1849–1855. doi:https://doi.org/10.1098/rspb.2008.0332.
- Rohlf FJ, Slice DE. 1990. Extensions of the Procrustes method for the optimal superimposition of landmarks. Syst Biol. 39(1):40–59. doi:https://doi.org/10.2307/2992207.
- Rowley-Conwy P, Albarella U, Dobney K. 2012. Distinguishing wild boar from domestic pigs in prehistory: a review of approaches and recent results. Journal of World Prehistory. 25(1):1–44. doi:https://doi.org/10.1007/s10963-012-9055-0.
- Salmi A-K, Äikäs T, Fjellström M, Spangen M. 2015. Animal offerings at the Sámi offering site of Unna Saiva – changing religious practices and human–animal relationships. . Journal of Anthropological Archaeology. 40:10–22. doi:https://doi.org/10.1016/j.jaa.2015.05.003
- Salmi A-K, Äikäs T, Spangen M, Fjellström M, Mulk I-M. 2018. Tradition and transformation in Sámi animal-offering practices. Antiquity. 92(362):472–489. doi:https://doi.org/10.15184/aqy.2018.20.
- Salmi A-K, Fjellström M, Äikäs T, Spangen M, Núñez M, Lidén K. 2020a. Zooarchaeological and stable isotope evidence of Sámi reindeer offerings. J Archaeol Sci Rep. 29:102129. doi:https://doi.org/10.1016/j.jasrep.2019.102129
- Salmi A-K, Heino MT. 2019. Tangled worlds: the Swedish, the Sámi, and the Reindeer. International Journal of Historical Archaeology. 23(1):260–282. doi:https://doi.org/10.1007/s10761-018-0465-2.
- Salmi A-K, Niinimäki S. 2016. Entheseal changes and pathological lesions in draught reindeer skeletons – four case studies from present-day Siberia. International Journal of Paleopathology. 14:91–99. doi:https://doi.org/10.1016/j.ijpp.2016.05.012
- Salmi A-K, Niinimäki S, Pudas T. 2020b. Identification of working reindeer using palaeopathology and entheseal changes. International Journal of Paleopathology. 30:57–67. doi:https://doi.org/10.1016/j.ijpp.2020.02.001
- Salmi A-K, Van Den Berg M, Niinimäki S, Pelletier M. 2021. Earliest archaeological evidence for domesticated reindeer economy among the Sámi of Northeastern Fennoscandia AD 1300 onwards. Journal of Anthropological Archaeology. 62:101303. doi:https://doi.org/10.1016/j.jaa.2021.101303
- Savriama Y, Valtonen M, Kammonen JI, Rastas P, Smolander O-P, Lyyski A, Häkkinen TJ, Corfe IJ, Gerber S, Salazar-Ciudad I, et al. 2018. Bracketing phenogenotypic limits of mammalian hybridization. Royal Soc Open Sci. 5(11):180903. doi:https://doi.org/10.1098/rsos.180903.
- Schlager S. 2020. Morpho: calculations and vizualisations related to Geometric Morphometrics. Accessed 2020 June 11. https://cran.r-project.org/web/packages/Morpho/Morpho.pdf
- Schmidt M, Fischer MS. 2009. Morphological integration in mammalian limb proportions: dissociation between function and development. Evolution. 63(3):749–766. doi:https://doi.org/10.1111/j.1558-5646.2008.00583.x.
- Sommerseth I. 2011. Archaeology and the debate on the transition from reindeer hunting to pastoralism. Rangifer. 31(1):111–127. doi:https://doi.org/10.7557/2.31.1.2033.
- Soppela P, Kynkäänniemi S, Wallen H. 2020. Poron käyttö ajokkaana – perinne jatkuu matkailussa. Poromies. 87(4):44–47.
- Suominen O, Olofsson J. 2000. Impacts of semi-domesticated reindeer on structure of tundra and forest communities in Fennoscandia: a review. Ann Zool Fenn. 37(4):233–249.
- Syroechkovskii EE. 1995. Wild Reindeer. Washington: Smithsonian Institution Libraries.
- Tegengren H. 1952. En utdöd lappkultur i Kemi Lappmark: studier i Nordfinlands kolonisationshistoria. Åbo: Åbo Akademi.
- Thomas DC, Everson P. 1981. Geographic variation in caribou on the Canadian arctic islands. Can. J Zool. 60(10):2442–2454. doi:https://doi.org/10.1139/z82-312.
- Vigne J-D. 2015. Early domestication and farming: what should we know or do for a better understanding? Anthropozoologica. 50(2):123–150. doi:https://doi.org/10.5252/az2015n2a5.
- Vigne J-D, Peters J, Helmer D. 2005. The First Steps of Animal Domestication. New archaeozoological approaches. Oxford: Oxbow Books; p. 176.
- Wallerström T. 2000. The Saami between east and west in the Middle Ages: an archaeological contribution to the history of reindeer breeding. Acta Borealia. 17(1):3–39. doi:https://doi.org/10.1080/08003830008580501.
- Weinstock J. 1997. The relationship between body size and environment: the case of Late Pleistocene reindeer (Rangifer tarandus). Archaeofauna. 6:123–135.
- Weinstock J. 2000. Osteometry as a source of refined demographic information: sex-ratios of reindeer, hunting strategies, and herd control in the late glacial site of stellmoor, Northern Germany. Journal of Archaeological Science. 27(12):1187–1195. doi:https://doi.org/10.1006/jasc.1999.0542.
- Weinstock J. 2002. Environment, body size and sexual dimorphism in late glacial reindeer. In: Ruscillo D, editor. Recent advances in ageing and sexing animal bones. Oxford: Oxbow Books; p. 246–252.
- Weladji RB, Holand Ø. 2006. Influences of large-scale climatic variability on reindeer population dynamics: implications for reindeer husbandry in Norway. Climate Research. 32(2):119–127. doi:https://doi.org/10.3354/cr032119.
- Wiley DF, Amenta N, Alcantara DA, Ghosh D, Kil YJ, Delson E, Harcourt-Smith W, Rohlf FJ, St. John K, Hamann B. 2005. Evolutionary morphing. IEEE Visual. 2005(VIS 05):431–438. doi:https://doi.org/10.1109/VISUAL.2005.1532826.
- Zeder MA. 2015. Core questions in domestication research. Proceedings of the National Academy of Sciences. 112(11):3191–3198. doi:https://doi.org/10.1073/pnas.1501711112.
- Zeder MA, Bradley DG, Emshwiller E, Smith BD. 2006. Documenting domestication, new genetic and archaeological paradigms. Berkeley: University of California Press.
- Zelditch ML, Swiderski DL, Sheets HD. 2012. Geometric morphometrics for biologists: a Primer. London: Academic Press.
- Zohary D, Tchernov E, Horwitz LK. 1998. The role of unconscious selection in the domestication of sheep and goats. Journal of Zoology. 245(2):129–135. doi:https://doi.org/10.1111/j.1469-7998.1998.tb00082.x.