
ABSTRACT
Comprising more than 350 dinosaur footprints and at least 38 trackways, the TY tracksite described herein is located close to the border of NW Lesotho, near Teyateyaneng (TY), and is probably identical to the site originally mentioned by Dornan in 1908. The tridactyl footprints are exposed as natural casts on a cliff overhang and a fallen block at the base of the cliff in the uppermost Elliot Formation (Sinemurian, Lower Jurassic). High-resolution photogrammetry and zoom lenses facilitated the detailed ichnological documentation of the otherwise inaccessible overhang. The tracks vary greatly in morphology, likely due to moisture fluctuations in the tracking surface during their formation. Repeated wetting and drying of the track-bearing sediment is indicated by the cross-cutting relationship of the several generations of desiccation cracks and tracks. Two footprint size classes can be distinguished, with the smaller class being Grallator-like and the larger class being assignable to Eubrontes. All tracks are likely attributable to bipedal, small to moderately large theropod dinosaurs that roamed the drylands of the region c. 190 million years ago. Our ichnological account turns this aesthetic TY footprint site into an apt geoheritage destination with scientific and educational value for all.
Introduction
Dinosaur footprints from southern Africa, especially from Lesotho (), have been mentioned in publications since the mid-1880s (Ambrose Citation1991), including in one of the earliest geological accounts of the upper Karoo Supergroup (Dornan Citation1908). The footprint sites cited, but neither illustrated nor described by Dornan, are in W and NW Lesotho at Morija, Qalo, Teyateyaneng, Tsikoane and Tsoaing. Due to the lack of exact location information, the lesser-known track sites at Teyateyaneng and Tsoaing had never been re-located nor studied again by ichnologists (Ambrose Citation1991) until very recently. Herein, we report on a tracksite () found by EB during a geological reconnaissance field trip in 2015, c. 13 km WSW of Teyateyaneng (Berea District, NW Lesotho). This tracksite is likely the long-lost Teyateyaneng tracksite of Dornan, and herein is referred to as the TY tracksite, due to its proximity to the bustling town of Teyateyaneng, commonly referred to as ‘TY’ in Lesotho. While many Lesotho tracksites in the Elliot and Clarens Formations (upper Stormberg Group; ) were originally described in detail by Ellenberger (Citation1970, Citation1972, Citation1974), the TY tracksite is not one of his classic sites, and thus its documentation herein is novel.
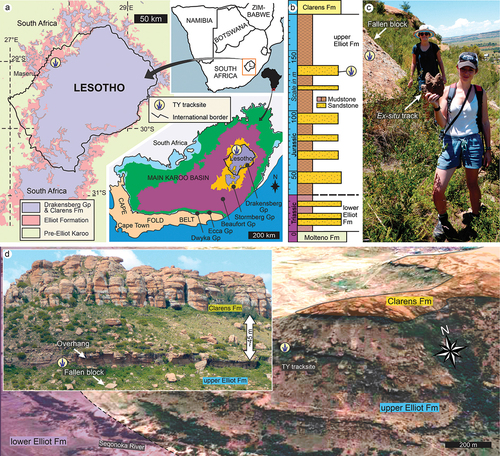
Figure 1. Geological context of the TY tracksite. a. Location of the TY tracksite within the main Karoo Basin and NW Lesotho (GPS: 29°12ʹ28.23”S, 27°37ʹ38.48”E). b. Stratigraphical context of the Sinemurian TY tracksite in the upper Stormberg Gp (Lower Jurassic). c–d. Field views of the TY tracksite showing the position of the track-bearing surfaces (overhang and fallen block) in the upper Elliot Fm, c. 45 m below its contact with the conformably overlying Clarens Fm. Abbreviations: Gp, Group; Fm, Formation; TY, Teyateyaneng.
Located in the uppermost Elliot Formation, the TY tracksite boasts at least 352 natural casts of tridactyl footprints made by Early Jurassic dinosaurs. The site is a suitable Jurassic Park-themed geoheritage destination in southern Africa, not only because of its scientific and educational value but also because this aesthetic site is easily accessible, being situated <1 km east of the main A1 road that runs along the border of NW Lesotho (). Most of these Sinemurian (c. 190 Ma old) tracks occur in 38 trackways on the lower bedding planes of sandstones, on surfaces exposed in situ in an overhang and on a fallen ex situ sandstone block, representing the same track-bearing surface (). Similar southern African tridactyl tracks have been described from the Sinemurian stratigraphic interval both in the uppermost Elliot Formation (e.g. Ellenberger Citation1970; Sciscio et al. Citation2016; Rampersadh et al. Citation2018; Abrahams et al. Citation2020a) and in the lowermost Clarens Formation (e.g. Ellenberger Citation1970; Mukaddam et al. Citation2020; Abrahams et al. Citation2020b; Bordy Citation2021).
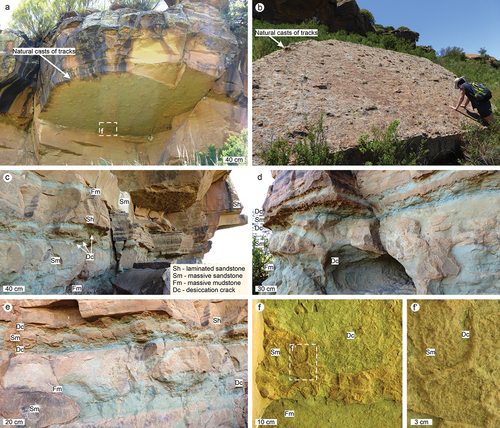
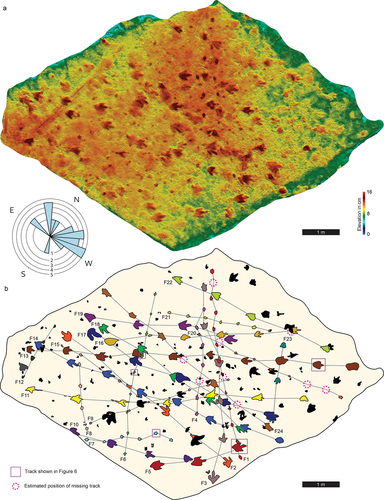
Figure 2. Sedimentological context of the TY tracksite. a. Overhang with an exposed lower bedding plane of a sandstone beds containing at least 125 natural casts of dinosaur tracks (see for track outlines and photogrammetry images). b. Fallen sandstone block exposing to weathering a former lower bedding plane with at least 227 natural casts of dinosaur tracks (see for track outlines and photogrammetry images). c–f. Sedimentary facies characteristics of the tabular sandstones and green mudstones in the upper Elliot Formation. Note the several generations of cross-cutting desiccation cracks that dominate in the green mudstones at the TY site.
Geological background
The TY tracksite () is on the southern slope of the hill that is immediately north of Ha Buasono (Ha Mabekenyane) and St Cecilia Catholic Mission, across the Seqonoka river in NW Lesotho. The site is in the Lower Jurassic upper Stormberg Group, which is the youngest sedimentary succession of the main Karoo Basin (), a long-lived, Late Carboniferous-Early Jurassic foreland system in southern Gondwana. Moreover, the ichnosite is contained in the uppermost Elliot Formation (latest Sinemurian), c. 45 m below its contact with the conformably overlying Clarens Formation (Sinemurian–Pliensbachian; Bordy et al. Citation2020; Figure 1b–d). In this region of the main Karoo Basin, the continental red bed succession of the Elliot Formation, which encompasses the Triassic–Jurassic boundary in southern Africa, is only c. 180 m thick. Here, natural outcrops in the Upper Triassic lower part of the Formation are rare and expose mainly purple, red and green (variegated) mudstones. For this reason, the contact of the lower and upper Elliot Formations is difficult to map in the area (see dashed lines in ). In contrast, the better exposed upper Elliot Formation forms a well-defined contact with the conformably overlying Clarens Formation (see solid lines in ). The sharp contact is due to the relatively abrupt sedimentary facies change that occurs from the mudstone-dominated red beds in the uppermost Elliot Formation to massive and very large-scale cross-bedded sandstones in the Clarens Formation. This marked lithological change has been attributed to climatic shifts, characterised by a long-term aridification, in the southern Gondwanan continental realms during the Sinemurian–Pliensbachian (for reviews, see Bordy et al. Citation2020, Citation2021). The interpretation of the Sinemurian uppermost Elliot Formation as a red bed succession that formed in a dryland with fast flowing, shallow, but broad ephemeral channels and associated extensive, low-gradient alluvial plains is based on the regionally persistent sedimentary facies characteristics of this Sinemurian unit. These sedimentological attributes, which are fully represented at the TY tracksite as well (), include tabular, laterally extensive very fine to fine-grained sandstones with horizonal lamination, ripple marks and massive beds, as well as mostly maroon-red, occasionally green mudstones with desiccation cracks, carbonate nodules and a plethora of continental fossils (Bordy et al. Citation2020; Viglietti et al. Citation2020). The most prominent characteristics of the upper Elliot Formation at the TY tracksite are the tabular fine-grained sandstones () that are interbedded with green, massive mudstones with several sets of cross-cutting, sandstone-filled desiccation cracks (). These sedimentological characters fit well with the regional dryland interpretation of the semi-arid palaeoenvironment in the late Sinemurian of SW Gondwana (e.g. Bordy et al. Citation2020).
Material and methods
The footprints at the TY tracksite are found as natural casts on two surfaces. One surface is an in situ lower bedding plane of a sandstone layer on the underside of an overhang () that measures 10.6 m in its greatest dimension (henceforth called ‘overhang’). Another surface is an ex situ fallen sandstone block () that is trapezoidal and 10.2 by 6.8 m in size (henceforth called ‘fallen block’). Both track-bearing surfaces represent the same stratigraphical level in the uppermost Elliot Formation and may have been part of a single continuous track-bearing surface (). Based on its position, the fallen block appears to have originated from south-west of the in situ overhang. The natural cast of one track (F13-9, ) was collected near the fallen block by EB in 2015. While the fallen block is directly accessible, the overhang is located several metres above the ground and is therefore inaccessible for direct study. Nevertheless, the use of zoom lenses allowed us to create a high-resolution 3D model even of the overhang during a photogrammetric survey carried out by OW in 2016. Because photogrammetry is a scale independent model, scale bars were included in at least some photographs as part of the model scene in order to allow subsequent scaling of the model and measurements of the tracks. Because our photogrammetric model includes not only the track-bearing surface but also c. 4 m of the cliff beneath the overhang (where the highest scale bar could be placed), the precise measurement of the inaccessible tracks and trackways in the overhang became possible.
The 3D models of the tracks were created based on 1617 and 1685 photographs of the overhang and fallen block, respectively. Each model consists of c. 55 million faces (single polygons that together make up the surface of the model). Models were generated using the commercial software Agisoft Metashape (www.agisoft.com; version 1.8.3) at John Moores University (Liverpool, UK) in 2022. Models generated in 2017 were of much lower resolution and, due to problems with image alignment, were only based on a subset of the photographs. The latest high-quality models therefore reflect the rapid technological advance of photogrammetry in the past 5 years. A separate 3D model was created of the single track (F13-9, ) based on 114 photographs taken by EB.
Post-processing was performed and orthophotos were generated in the free software MeshLab (www.meshlab.net, version 2022.02), and false-colour height maps were produced with the free software ParaView (www.paraview.org, version 5.10); see Lallensack et al. (Citation2020b) for a detailed methodology and instructions. Sitemaps were drawn based on height maps with the free software Inkscape (inkscape.org, version 1.2.1). Measurements were extracted from height maps using Inkscape’s ‘Measure objects’ tool, and statistical analysis performed in the free statistical programming environment R (www.r-project.org, version 4.2.1). Tracks from the overhang and fallen block are identified with the prefix ‘O’ and ‘F’, respectively. Trackways and tracks that are part of a trackway are numbered (e.g. O1-1 is the first track of trackway 1 from the overhang).
Both surfaces, but especially the fallen block, show a moderate to high degree of dinoturbation (Richter and Böhme Citation2016), complicating the identification of trackways. We interpret trackways primarily based on regular, predictable positions of subsequent tracks, but also based on track sizes and orientations, modes of preservation, and identification as ‘left’ or ‘right’ footprints based on the configuration of the ‘heel’ and the orientation of claw marks. Only those tracks and trackways were included in the sitemaps that could be identified as such confidently; many additional tracks are preserved but are difficult to confirm.
Measurements were taken according to whenever the measurable track features are unambiguous (). To lessen the influence of outliers, the median was taken from track measurements of tracks from individual trackways. The mean was taken from the trackway medians and the measurements from isolated tracks. Overview photographs and track measurements of all TY tracks are provided in the supplemental material in accordance with Falkingham et al. (Citation2018; see Data archiving section).
Figure 3. Measurements taken from the tridactyl footprints (a) and trackways (b) at the TY tracksite. Abbreviations: TL – track length, TW – track width, TS – track span, DP – digit III projection, L III – digit III length, II^III/III^IV – respective inter-digit angles, λ – stride length, PL – pace length, PA – pace angulation.
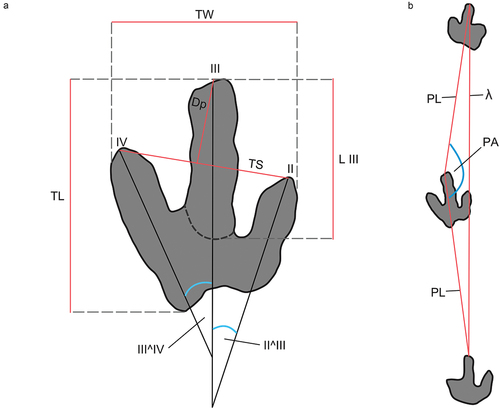
Table 1. Trackway parameters and median track measurements for the 38 identified trackways at the TY tracksite. All measures are in cm, except for II^III and III^IV, which are in degrees. See Data archiving section for measurements of individual tracks.
Terminology
Terminology follows, until otherwise noted, that of Leonardi et al. (Citation1987) and Abrahams et al. (Citation2022). Of particular importance to the present work is the projection of digit III (DP), whose complex terminology is briefly reviewed below.
Olsen (Citation1980) introduced the concept of the projection of digit impression III past II and IV, which would become pivotal in the study of tridactyl dinosaur tracks. This ‘digit III projection’ (DP) is typically measured from a line connecting the tips of digit impressions II and IV to the tip of digit impression III and expressed as a ratio against track length (TL or against TL–DP) to remove absolute size (e.g. the ‘projection ratio’ of Olsen et al. Citation1998). This ratio is essentially a one-dimensional measurement, as both TL and DP are measured parallel to each other. Weems (Citation1992) instead used the ratio between ‘toe extension’ (te, equivalent to DP) and ‘foot width’ (fw, in most cases equivalent to track span), as well as the ratio between te and fl-te (where fl is footprint length), stating that ‘these ratios basically define a footprint as two triangles, one facing anteriorly and one facing posteriorly’ (p. 118). Thus, the te/fw ratio is conceptually a two-dimensional measurement that relates to the fl/fw proportions (or shape) of the footprint rather than only the linear projection of digit impression III. Lockley (Citation2009) cited Weems (Citation1992) in referring to the ‘L/W ratio of the anterior triangle’, while Farlow et al. (Citation2018) used the term ‘toetip extension’. The way how the measurements are taken differs between studies as well: Projection and span have been measured between the tips of the claw marks or between the claw bases, and projection has been measured parallel to digit impression III (e.g. Weems Citation1992; Olsen et al. Citation1998) or perpendicular to track span (e.g. Lockley Citation2009; Abrahams et al. Citation2022). Olsen et al. (Citation1998) also introduced the ‘corrected projection ratio’, which accounts for variations in the interdigital angles. We note that the terms ‘toe extension’ (te), ‘toetip extension’, ‘projection’ (P) and the ‘L/W ratio of the anterior triangle’ are all virtually synonymous, and, along with the more general concept of strong versus weak mesaxony, do all speak to the similar if not identical measures of allometry in theropod footprints.
Results
The overhang () preserves at least 14 trackways composed of 61 tracks as well as at least 64 additional isolated tracks that could not be attributed to a trackway, while the fallen block () preserves at least 24 trackways composed of 142 tracks as well as at least 85 isolated tracks. The TY tracksite therefore preserves a minimum sample of 352 tracks, of which 203 have been resolved into 38 trackway segments. It is not possible to determine with confidence if any trackways recorded on the two surfaces are different segments of the same trackway.
Figure 4. Footprint-bearing overhang with at least 125 tracks as natural casts on a lower bedding plane of a sandstone layer at the TY tracksite. a. False-colour height map generated from the height-mapping of the photogrammetric model of the surface. b Interpretative outline map of (a). The map is shown in its in situ convex hyporelief, cast or underside aspect, and not reversed to restore top view aspect of impressions on the original track-bearing surface. The rose diagram indicates the prevalent directions of travel, with inner circles indicating the number of trackways in each bin. Maps also show that 60 tracks form 14 trackways (O1–O14) of mostly large and a few small tridactyl dinosaurs. Note the multiple generations of desiccation cracks (see .) and that trackway O5 preserves deeper footprints with impressions of up to four digits. Non-trackway forming tracks are black. For the location of the overhang within the tracksite, see .
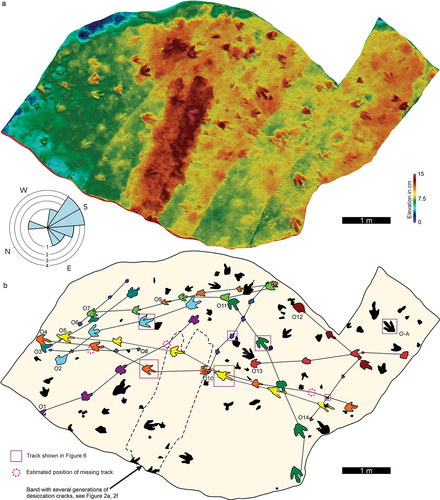
Figure 5. Footprint-bearing fallen block with 227 tracks as natural casts at the TY tracksite. a. False-colour height map generated from the height-mapping of the photogrammetric model of the surface. b. Interpretative outline map of (a). The map is shown in its in situ convex hyporelief, cast or underside aspect, and not reversed to restore the top view aspect of impressions on the original track-bearing surface. The rose diagram indicates the prevalent directions of travel, with inner circles indicating the number of trackways in each bin. Maps also show that 142 tracks form 24 trackways (F1–24) of both small and large tridactyl dinosaurs. Non-trackway forming tracks are black. For the location of the fallen block within the tracksite, see .
The two surfaces are affected by weathering and erosion in different ways. The overhang, being more sheltered from weathering, yields the best-preserved tracks (). However even here, natural casts of digit impressions, most frequently digit III, and possibly entire tracks detached from the overhang because of weathering and gravity. Being constantly exposed to the elements, the surface of the fallen block is visibly more weathered (). Several tracks have been detached from the block, and one of these ex-situ tracks (F13-9) was found near the fallen block ().
Figure 6. Close-up of selected tridactyl tracks at the TY tracksite. Each track is shown as height map and photograph at the same scale. a. Small grallatorid track (F5-5) showing a highly asymmetric ‘heel’ but lacking in detail. b. The best-preserved track of trackway F6. Note the clear grallatorid morphology with a high digit III projection. Photograph shows the track in oblique view. c. Aberrant track with wide splay, which is possibly caused by deep sinking of the foot into soft sediment (see text for details). d. Track F7-5 of the most deeply impressed trackway of the smaller size class (track depth = 4.6 cm). Note the partial collapse of the digit impressions at mid-height (photograph in oblique rear view). e. Mid-sized track O10-3 showing a robust morphology. f. Example of morphological variability, with apparently low interdigital angles and a strongly asymmetric ‘heel’. g. Track O-A, which is without identified trackway (i.e. ‘solo’ track), showing clear anatomical detail such as phalangeal pads. h. Track O2-3 showing a ‘fleshy’ appearance with indistinct phalangeal pads but well-defined claw marks. The tip of digit impression III is broken off. i. Track O11-2, showing anatomical detail. j. Track O4-3, in which the ‘heel’ region is deeper than the digit impressions, and a hallux mark is preserved k. Penetrative track with indistinct digit impressions, hallux mark and metatarsal mark. l. Natural cast of track (F13-9) was found ex situ near the fallen block (). The track’s morphology is similar to tracks in trackway F13, the longest trackway on the fallen block.
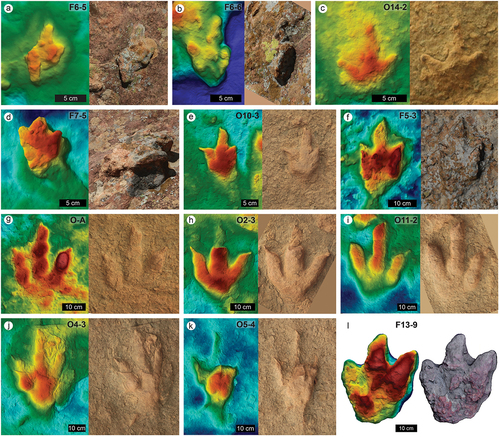
Track depth is highly variable, ranging from very shallow (<1 cm) up to a depth of 6.8 cm. In the shallower tracks, digit III is usually impressed the deepest (e.g. O11-2, ), while in more deeply impressed tracks, the greatest depth is reached proximal to the hypex positions (e.g. trackways F7, O10). In strongly penetrative tracks (see below), the greatest depth is shifted even further proximally (e.g. O5-4, ). In the fallen block, a greater proportion of tracks appear to be deeply impressed than in the overhang, although maximum depth is similar in both surfaces. In the fallen block, one trackway of the smaller size class (F4) reaches almost as deep (up to 5.6 cm) as the deepest larger tracks. This may be explained variously, including temporal separation of these tracks (i.e. trackways were generated at different times with different substrate consistencies) and changes in substrate consistency with depth (e.g. a firmer subsurface layer might have restricted sinking depth of the larger trackmakers).
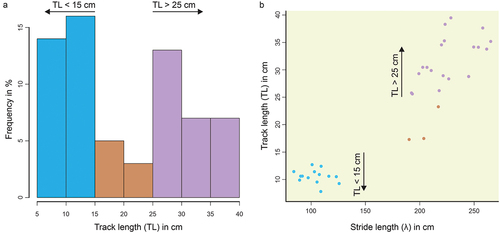
The preserved tracks span a wide length range from 7.3 to 39.5 cm. Two distinct size classes are apparent, as indicated by the bimodal distribution of track length (). These two size classes are defined by small (TL: 5–15 cm, n = 30) and large tracks (TL: 25–40 cm, n = 27). Only eight of the measured tracks have a length range of 15–25 cm, demarcating a natural gap of c. 10 cm between the two track length classes. These two size classes become even more evident when plotting track length against stride length (; note that this plot excludes tracks that could not be attributed to a trackway).
Figure 7. Results of the statistical analysis of the tridactyl tracks and trackways. a. Histogram showing a bimodal distribution of track length, indicating two distinct size classes. b. The two track length classes are well separated by stride lengths.
The trackways show a preferred general direction of travel, but most trackways are not parallel to each other, indicating that the trackmakers traversed the surface independently (and not in simultaneous groups). On the overhang (), most trackways roughly head towards the south (trackways O1, O2, O3, O6, O9, O10, O14), including three of the four trackways of the smaller class (O6, O10, O14) that are oriented approximately parallel to each other. Some other trackways head towards the south-west (trackways O4, O5 and O13), while trackways O11 and O12 head towards the west, and trackway O8 heads towards the north-east. The fallen block () shows differences in direction of travel between the size classes. The original orientation of the fallen block is unknown, so the given directions do not compare with those of the in-situ overhang. The trackways of the larger size class tend to be directed towards the present-day east (trackways F10, F14, F17 F18, F22) or north-east (trackways F5, F11, F13, F16, F19). However, F23 heads towards the south-east; F3 is directed towards the north-west, and the parallel F2 and F24 heads towards the west. Most trackways of the smaller size class (F1, F4, F6, F8 and F12) instead head towards the north-west and cross almost at right angle most of the larger trackways. Trackways F7 and F21, however, head towards the north-east and F20 heads towards the east, as do many trackways of the larger size class.
The trackways vary greatly in their relative stride lengths (‘relative speed’, λ/TL), with a minimum of 5.8, a maximum of 14 and a median of 8 (). Tracks of the smaller size class (TL < 15 cm) show higher relative stride lengths (median: 9.2) than do tracks of the larger class (median 7.4). This may indicate that the smaller trackmakers were moving faster for their size than the larger trackmakers. Absolute speeds range between 1.46 and 3.91 m/s (5.28 and 14.1 km/h, respectively). However, speed estimates are only gross approximations (Alexander Rmc Citation1976; Marmol-Guijarro et al. Citation2020), especially in smaller tracks where the measurement of track lengths is compounded by the greater sinking depth of the trackmakers’ feet that may reduce track length and consequently increase the speed estimates.
The trackways generally are narrow with high pace angulations approaching 180°. Trackway F7 of the small size class, however, is distinct in showing a consistently low pace angulation (mean: 151°). It is possible that this trackmaker placed its feet further apart in order to maintain movement stability over the challenging, possibly slippery substrate.
The tracks vary greatly in morphological clarity, including examples with exquisite anatomical detail (e.g. O-A, O2-3, O10-3, O11-2, ) as well as examples preserved only as shallow and indistinct elevations (sometimes marking the positions of formerly attached, but now broken tracks). Three trackways (O5, F11, F24, ) show metatarsal marks, hallux marks, and, in the case of F11, drag marks between the consecutive tracks. Track outlines in these cases are often irregular, with abbreviated or shortened digits that appear to be much shallower than the deeply impressed ‘heel’ region (e.g. O5-4, ). Such tracks generally indicate deep sinking of the foot into soft sediment, with full or partial collapse of digit impressions or the track as a whole (Lallensack et al. Citation2022), and can therefore be regarded as penetrative tracks (Falkingham et al. Citation2020; Gatesy and Falkingham Citation2020). Many smaller tracks are very deeply impressed relative to their size (e.g. F7-5, ). F7-5 shows partial collapse of digit impressions, as the track walls appear to be drawn inside, and the digit tips are overhanging. Most smaller tracks appear to have sunk in relatively deeply, leading to a foreshortening of their digit impressions, especially that of digit III, sometimes resulting in three digit impressions that are sub-equal in length. Such tracks contain little information on the anatomy of the trackmaker.
Some of the smaller tracks that are shallow show widely splayed digit traces with divarication angles up to 81°. The clearest example, O14-2 (), is part of a trackway, with other tracks showing low interdigital angles typical for Grallator. The widely splayed tracks may represent steps in which the animal splayed its foot widely. However, these examples might alternatively be interpreted as penetrative tracks, where the interaction between foot and sediment may foreshorten the track and greatly exaggerating the splay even when the foot itself was not widely splayed (Gatesy and Falkingham Citation2020).
Most small tracks lack anatomical fidelity given their abbreviated digit impressions caused by deep sinking and/or erosion, and thus relatively few tracks could be measured completely. An exception is F6-6 (), which shows the typical grallatorid morphology and clearly defined phalangeal pads. The small tridactyl tracks (TL < 15 cm) show long projections of digit III (DP, as shown in ; mean DP is 41% of TL in F6-6). These small tracks are narrow (mean TL/TW ratio of 1.5) and often show a distinctively asymmetric ‘heel’ configuration (F6-5, F6-6, ).
The larger tridactyl tracks (TL > 25 cm), in contrast, show distinctively lower digit projections (mean: 34% of TL) and are slightly broader (mean TL/TW ratio of 1.4). ‘Heel’ asymmetry in the larger tracks varies, and the metatarsophalangeal pad of digit 4 is slightly (e.g. O-A, ) to strongly (e.g. F5-3, ) laterally offset in relation to digit impression III. The robustness of the tracks varies greatly, including fleshy-looking tracks that only show indistinct pad impressions (e.g. O10-3, O2-3, ) to skinnier-looking tracks that tend to show more clearly defined pads (e.g. O-A, O11-2, ); these differences are possibly caused by differences in substrate softness and sinking depths. Lockley (Citation1998) also noted the tendency of larger theropod tracks to be more ‘fleshy’ in appearance and to lack clearly defined digital pad traces. Digit impression III is relatively long in proportion to track length (DIII/TL) in both the small and large size classes (both 0.69%).
Discussion
Mode of preservation and succession of events
The presence of both penetrative tracks and tracks with a high degree of anatomical fidelity indicates changing water content that varied the softness of the substrate during the track formation interval. Because the mode of footprint preservation seems to be relatively constant within individual trackways traversing the surface, this variation was likely temporal and not spatial. A portion of the track-bearing surface containing multiple generations of desiccation cracks and tracks is attached to the underside of the overhang () and indicates several cycles of drying and wetting that probably occurred during the trackmaking interval. The diverse array of track shapes preserved at the site can partly be ascribed to such changes in sediment consistency.
Obvious morphological variations include the position of the metatarsophalangeal pad with respect to digit impression III; the robustness and ‘fleshiness’ of the digit impressions as well as the presence or absence of clearly defined phalangeal pad impressions; the width-to-length ratio; the relative lengths of digit impressions and, as a consequence, digit III projection values; the interdigital angle (up to 81°); and the presence of hallux and metatarsal marks (see ‘Results’ section for a more detailed description of these variations). Although these features often seem to be relatively consistent within trackways, they form a continuum at the TY tracksite. Consequently, these differences do not necessarily reflect anatomical differences, but instead might reflect the consistency of the substrate at the time of track formation. These observations highlight the need for caution when interpreting anatomy from such tracks and drawing ichnotaxonomic conclusions, especially when based on small sample sizes.
Relatively few studies that attempt to unravel the ‘sequence of events’ that took place at a given tracksite. Lockley et al. (Citation2021), while discussing the Eubrontes dominated Mail Station Dinosaur Tracksite (MSDT) from the Lower Jurassic of Utah, concluded that such analyses are generally difficult. While some authors have referred to generations of activity based on recognisable or inferred overlapping relationships between trackways, determining the sequence of events for a tracksite has never been accomplished without ambiguity (see Lockley et al. Citation2021 and references therein). However, Lockley et al. (Citation2021) inferred that sediment consistency and hence intra-trackway track depth were generally consistent across the MSDT tracksite, as we also infer for the TY site. Likewise, for the MSDT site, it was inferred that poorly preserved tracks in the ‘background’ between well-preserved tracks probably represented dinoturbation by smaller trackmakers prior to the registration of the larger tracks (Lockley et al. Citation2021). Such background dinoturbation of large and small trackmakers is also evident in the TY tracksite and may serve as evidence for sequential events through time.
Multiple instances of overprinting of tracks at the TY tracksite may allow to derive hypotheses about the succession of events. For example, track F2-5 appears to be overprinted by track F13-3, while the next step (F13-4) of trackway F13 is overprinted by F18-2, which in turn is overprinted by F6-6 (). Two general observations may be derived: first, penetrative tracks that indicate deep sinking into soft sediment tend to be overprinted by other tracks (O5-5 is overprinted by O11-3; O5-6 is overprinted by an isolated track; F11-4 is overprinted by F18-4), indicating that these trackmakers traversed the surface relatively early when the sediment was soft. This conclusion is also supported by the well-preserved anatomical detail seen in the overprinting trackways (e.g. trackway O11), which indicates relatively shorter exposure times before infilling. Second, trackways of the smaller size class tend to overprint trackways of the larger class. This could indicate that smaller trackmakers tended to traverse the surface after the larger trackmakers. Alternatively, it may indicate that earlier tracks of smaller trackmakers are simply not preserved because of unfavourable substrate consistencies at that time or because their smaller size makes their preservation less likely.
Size distribution and minimum number of species
Tridactyl tracks from the Elliot and Clarens Formations () had been attributed to a number of separate ichnotaxa by Ellenberger (Citation1970, Citation1972, Citation1974). Later workers, however, synonymised these ichnotaxa with Eubrontes and Grallator, which were originally defined based on material from the eastern US (Olsen and Galton Citation1984; Lucas et al. Citation2006).
At the TY tracksite, two distinct size classes can be distinguished (). These size groups do correspond well with that of Grallator and Eubrontes from the eastern US: Grallator being <15 cm in track length and Eubrontes being >25 cm in track length (Olsen et al. Citation1998). A type intermediate in morphology and size (15–25 cm), Anchisauripus, is sometimes distinguished but not universally accepted (Olsen et al. Citation1998). The two size classes also correspond to Grallator and Eubrontes in their morphology, with Grallator being narrower and showing a higher digit III projection than Eubrontes (Olsen et al. Citation1998). However, Grallator has been diagnosed by its narrowness, with length-to-width ratios ‘near or greater than 2’ (Olsen et al. Citation1998, p. 595), a conclusion also supported by the ratios reported by Lockley (Citation2009). The measured small-sized (TL < 15 cm) tracks from the TY tracksite, however, appear to be broader (mean TL/TW ratio of 1.47). We therefore refer to these smaller tracks as ‘grallatorid’ without assignment to a specific ichnotaxon.
The larger TY tracks match the diagnosis of Eubrontes (Olsen et al. Citation1998) and might be assigned to this ichnogenus and compared with Eubrontes tracks from the Lower Jurassic of Utah (Lockley et al. Citation2021) and elsewhere, including southern Africa (see below). However, some of the tracks may be closer in morphology to other established theropodan ichnotaxa, such as Kayentapus, given the substantial variability present at the site (also see Sciscio et al. Citation2017; Abrahams et al. Citation2020a, Citation2020b).
Lockley et al. (Citation2021a, Citation2021b) noted that the mean LIII/TL ratio of a sample of 17 Eubrontes trackways from the Lower Jurassic of North America was 0.64, and that this ratio distinguishes the ichnogenus from other theropod ichnogenera such as Megalosauripus, which has a mean ratio of c. 0.60 (see Lockley and Xing Citation2021, p. 25). At the TY tracksite, digit III is 69% of the track length on average in both the large and small size class and compatible with the results obtained by Lockley et al. (Citation2021) for the North American Eubrontes specimens.
The projection of digit III beyond digits II and IV is negatively correlated with size both intra- and interspecifically (Olsen Citation1980; Farlow et al. Citation2018; Lallensack et al. Citation2020b; Abrahams et al. Citation2022) but may also carry a functional signal, with high projection values seen in more cursorial forms (Lallensack et al. Citation2020b). As shown by Abrahams et al. (Citation2022), digit III projection may also change with stratigraphy in southern Gondwana: the larger Sinemurian–Pliensbachian tridactyl tracks have a reduced digit III projection relative to their smaller Late Triassic counterparts.
The two identified ichnotaxa at the TY tracksite most probably indicate the presence of at least two trackmaker taxa (Farlow et al. Citation2018), a conclusion also reached by Lockley and Hunt (Citation1995) for tracksites in the Lower Jurassic of the USA where bimodal size distributions are also common. However, it cannot be fully excluded that the differences in size and morphology are due to ontogeny of a single species, as originally proposed for the Grallator-Anchisauripus-Eubrontes plexus by Olsen (Citation1980). Likewise, the scarcity of mid-sized individuals as indicated by the bimodal size distribution () of the tridactyl dinosaur tracks at the TY tracksite could alternatively be explained by a rapid phase of growth and high juvenile mortality.
Comparison with other tracksites from the upper Elliot Formation of southern Africa
The TY tracks compare well with other tridactyl tracks from the Stormberg Group of southern Africa and are compatible with the conclusions of Abrahams et al. (Citation2022). In the grallatorid tracks, track elongation is 1.4 in the sample of Abrahams et al. (Citation2022) vs. 1.47 in the TY tracks, while digit III projection (DP/TS) is 0.65 vs. 0.7. Eubrontes has a mean elongation of 1.53 in the broader southern African sample vs. 1.4 in the TY tracks and a DP/TS of 0.53 in both samples. Abrahams et al. (Citation2022) concluded that tridactyl tracks in southern Africa increase in maximum size across the Triassic-Jurassic boundary, with maximum TL of 31 cm in the Late Triassic and 57 cm in the Early Jurassic, a trend reported elsewhere (e.g. Lallensack et al. Citation2020b; Lockley and Xing Citation2021). With a maximum TL of 39 cm, the tridactyl track lengths at the Sinemurian TY site are compatible with this conclusion ().
Four other theropod tracksites from the uppermost Elliot Formation have been described in detail from southern Africa and warrant comparison: Mafube in South Africa (Sciscio et al. Citation2016), as well as Matobo (Sciscio et al. Citation2017), Ha Nohana (Rampersadh et al. Citation2018) and Upper Moyeni (Abrahams et al. Citation2020b) in Lesotho. The tridactyl track-rich level in the uppermost Elliot Formation extends over a distance of c. 200 km in N-S direction from Mafube (N of the TY tracksite) to the Upper Moyeni (S of the TY tracksite).
Similar to the TY tracks, the tracks at Mafube show a wide range of morphologies, including penetrative tracks (cf. Sciscio et al. Citation2016, their Figure 7b), and two morphotypes described as ‘Grallator-like’ and ‘Eubrontes-like’, respectively. Although these tracks range from 13 to 41 cm in length, their size distribution is unimodal rather than bimodal, with most tracks falling in the range between 20 and 25 cm – the size class that is most underrepresented at the TY tracksite. This difference might indicate that Mafube was dominated by another trackmaker species or the same trackmaker at a different ontogenetic stage.
Large theropod tracks (TL > 40 cm), some of which exceed 50 cm, were described by Sciscio et al. (Citation2017) from the Matobo site. These large tracks show much lower DP/TS ratios (0.37 for trackway D vs. 0.52 for the larger size class at TY), though they lack anatomical detail and may possibly represent undertracks or penetrative tracks as indicated by the narrowness of the digit impressions (see Falkingham et al. Citation2020; Gatesy and Falkingham Citation2020). Three additional trackways of medium size (TL: 31–40 cm) are present at Matobo and fall within the range of the larger size class at TY, although the small size class at TY has not been reported from Matobo.
The Ha Nohana site (Rampersadh et al. Citation2018) yet again preserves a small and a large size class or morphotype. While morphotype I is represented by shallow tracks that show very little variation in track length (mean TL: 10.1, n = 44), morphotype II is represented by a single trackway with deep, penetrative tracks, some of which showing distinct exit traces, metatarsal marks and hallux marks (Rampersadh et al. Citation2018, their Figure 6). Although this mode of track formation makes track length difficult to compare, this morphotype II is clearly larger (TL: c. 28 cm), as also indicated by the much longer stride length (60 cm in morphotype I and 160 cm in morphotype II, respectively), showing that two size classes are present. These tracks match the small and large size class at the TY tracksite ().
Tridactyl tracks of the Upper Moyeni tracksite (Abrahams et al. Citation2020b) are larger than those of the TY tracksite, with a mean TL of 33.4 (calculated from both tracks assigned to trackways and isolated tracks). The maximum TL at the Upper Moyeni is 51 cm, while the longest TY track is 39 cm in length. Only two tracks from the Upper Moyeni are shorter than 20 cm, and no tracks shorter than 15 cm have been reported. The frequency distribution of the Upper Moyeni track lengths shows a broad peak between 20 and 45 cm, potentially indicating trackmakers of separate species and/or size classes.
Conclusions
The TY dinosaur tracksite, likely identical to the long-lost Teyateyaneng site of Dornan (Citation1908), exposes tridactyl dinosaur footprints in a cliff overhang and a fallen block adjacent to the cliff. Detailed analysis and measuring of the tracks in the inaccessible overhang, located more than 4 metres above the cliff base, is facilitated by high-resolution photogrammetric documentation aided by zoom lenses. The TY tracksite preserves at least 38 trackways and 352 confirmed tridactyl tracks. Track morphology and anatomical fidelity vary considerably and are likely related to changes in the water content of the substrate. These variations emphasise the caution that is required when interpreting anatomical features from fossil footprints. Overprinting of tracks indicates that penetrative tracks that sunk deeply into soft sediment tended to form before other tracks. Two size classes can be unambiguously distinguished that probably relate to theropod trackmaker taxa of different body sizes. Based on size and morphology, footprints are assignable to Eubrontes and Grallator-like tridactyl tracks that are common in the Lower Jurassic globally. The footprints are also similar to tracks of other upper Stormberg Group tracksites in the Lower Jurassic of southern Africa and fit the evolutionary trend towards larger sizes and reduced mesaxony across the Triassic-Jurassic boundary in SW Gondwana (Abrahams et al. Citation2022). Given its scientific, educational and aesthetic values, the TY tracksite should be considered as an easily accessible southern African geoheritage destination, being located <1 km east of the main A1 road that runs along the border of NW Lesotho.
Data archiving statement
The data that support the findings of this study are openly available in Figshare at
https://doi.org/10.6084/m9.figshare.20398815
The archived data includes:
(1) Table of ichnological morphometric parameters, including standard track and trackway measurements.
(2) Ichnological photogrammetric data: cleaned and aligned 3D models as recommended by Falkingham et al. (Citation2018).
(3) Photographs for photogrammetry are stored separately under https://doi.org/10.6084/m9.figshare.20477097 (overhang) and https://doi.org/10.6084/m9.figshare.20468652 (fallen block).
Acknowledgments
EB thanks the ongoing research support from Mme` Matsosane Molibeli (Lesotho Ministry of Tourism, Environment and Culture) and Prof David Ambrose (National University of Lesotho). OW would like to thank Ryan Tucker for introducing him to this site and help during fieldwork. We also thank the reviewer Christian A. Meyer and an anonymous reviewer for meaningfully contributing with their insightful comments to the overall quality of this study. Opinions expressed and conclusions reached are those of the authors and are not necessarily to be attributed to the funders or anybody else.
Disclosure statement
The authors receive no financial benefit from this research.
Additional information
Funding
References
- Abrahams M, Bordy EM, Knoll F. 2020b. Hidden for one hundred years: a diverse theropod ichnoassemblage and tracks preserved in cross-section from the historic Early Jurassic Tsikoane ichnosite (Clarens formation, northern Lesotho, Southern Africa). Hist Biol. 33:2504–2519. doi:10.1080/08912963.2020.1810681.
- Abrahams M, Bordy EM, Knoll F, Farlow JO. 2022. Theropod tridactyl tracks across the Triassic-Jurassic boundary in Southern Africa: implications for pedal morphology evolution. Front Ecol Evol. 10 :925313. doi:10.3389/fevo.2022.925313. https://www.frontiersin.org/article/10.3389/fevo.2022.925313
- Abrahams M, Sciscio L, Reid M, Haupt T, Bordy EM. 2020a. Large tridactyl dinosaur tracks from the Early Jurassic of southern Gondwana - uppermost Elliot Formation, Upper Moyeni, Lesotho. Annales Societatis Geologorum Poloniae. 90:1–26. doi:10.14241/asgp.2020.0.
- Alexander Rmc N. 1976. Estimates of speeds of dinosaurs. Nature. 261(5556):129–130. doi:10.1038/261129a0.
- Ambrose D. 1991. A tentative history of Lesotho palaeontology. J Res Natl Univ Lesotho. 1:1–38.
- Bordy EM. 2021. Darting towards Storm Shelter: a minute dinosaur trackway from Southern Africa. S Afr J Sci. 117:1–11. doi:10.17159/sajs.2021/9145.
- Bordy EM, Abrahams M, Sharman GR, Viglietti PA, Benson RBJ, McPhee BW, Barrett PM, Sciscio L, Condon D, Mundil R, et al. 2020. A chronostratigraphic framework for the upper Stromberg Group: implications for the Triassic-Jurassic boundary in Southern Africa. Earth-Sci Rev. 203:103120. doi:10.1016/j.earscirev.2020.103120.
- Bordy EM, Haupt T, Head HV. 2021. Karoo lava-fed deltas and a petrified forest from the Lower Jurassic of southern Gondwana. Palaeogeogr Palaeoclimatol Palaeoecol. 575:110484. doi:10.1016/j.palaeo.2021.110484.
- Dornan SS. 1908. Note on the geology of Basutoland. Geol Mag. 5:57–63. doi:10.1017/S0016756800112877.
- Ellenberger P 1970. The fossil-bearing strata associated with the earliest appearance of mammals in South Africa and their ichnology: establishment of detailed stratigraphic zones in the Stormberg of Lesotho (South Africa) (Upper Triassic to Jurassic). In: Haughton SH (ed.), Proceedings and Papers of the Second Gondwanaland Symposium on Gondwana Stratigraphy and Palaeontology. Council for Scientific and Industrial Research, Pretoria, pp. 343–370.
- Ellenberger P. 1972. Contribution à la classification des pistes de vertébrés du Trias: les types du Stormberg d´Afrique du Sud (I). Palaeovertebrata, Memoire Extraordinaire. 1–152.
- Ellenberger P. 1974. Contribution à la classification des pistes de vertébrés du Trias: les types du Stormberg d´Afrique du Sud (II éme partie: Le Stormberg Superieur - I. Le biome de la zona B/1 ou niveau de Moyeni: ses biocénoses). Palaeovertebrata, Memoire Extraordinaire. 1–143.
- Falkingham PL, Bates KT, Avanzini M, Bennett M, Bordy EM, Breithaupt BH, Castanera D, Citton P, Díaz-Martínez I, Farlow JO, et al. 2018. A standard protocol for documenting modern and fossil ichnological data. Palaeontology. 61:469–480. doi:10.1111/pala.12373.
- Falkingham PL, Turner ML, Gatesy SM . 2020. Constructing and testing hypotheses of dinosaur foot motions from fossil tracks using digitization and simulation. Palaeontology. 63(6):865–880. doi:10.1111/pala.12502.
- Farlow JO, Coroian D, Currie PJ. 2018. Noah’s ravens: interpreting the makers of tridactyl dinosaur footprints of the Newark supergroup, Early Jurassic, Eastern North America. In: Noah’s Ravens: interpreting the Makers of Tridactyl Dinosaur Footprints. Bloomington: Indiana University Press; p. 643.
- Gatesy SM, Falkingham PL. 2020. Hitchcock’s Leptodactyli, penetrative tracks, and dinosaur footprint diversity. J Vertebr Paleontol. 40:e1781142. doi:10.1080/02724634.2020.1781142.
- Lallensack JN, Buchwitz M, Romilio A. 2020a. Photogrammetry in ichnology: 3D model generation, visualisation, and data extraction. Earth ArXiv. doi:10.31223/X5J30D.
- Lallensack JN, Engler T, Barthel HJ. 2020b. Shape variability in tridactyl dinosaur footprints: the significance of size and function. Palaeontology. 63:203–228. doi:10.1111/pala.12449.
- Lallensack JN, Farlow JO, Falkingham PL. 2022. A new solution to an old riddle: elongate dinosaur tracks explained as deep penetration of the foot, not plantigrade locomotion. Palaeontology. 65:1–17. doi:10.1111/pala.12584.
- Leonardi G, Casamiquela RM, Demathieu GR, Haubold H, Sarjeant WAS. 1987. Glossary and manual of tetrapod footprint palaeoichnology. Leonardi G editor. Brasília: Publicação do Departemento Nacional da Produção Mineral Brasil.
- Lockley MG. 1998. In: Gaia: revista de geociencias. Vol. 15. p. 279–300.
- Lockley MG. 2009. New perspectives on morphological variation in tridactyl footprints: clues to widespread convergence in developmental dynamics. Geol Q. 53:415–432.
- Lockley MG. 2021b. The distribution of theropod-dominated ichnofaunas in the Moab Megatracksite area, Utah: implications for Late Jurassic paleobiology along an arid coast. Hist Biol. doi:10.1080/08912963.2021.1975279.
- Lockley MG, Breithaupt BH, Matthews NA, Shibata K, Hunt-Foster R. 2021. A preliminary report on an Early Jurassic Eubrontes-dominated tracksite in the Navajo Sandstone formation at the mail station dinosaur tracksite, San Juan County, Utah. Bull - New Mexico Mus Nat Hist Sci. 82:195–208.
- Lockley MG, Hunt AP. 1995. Dinosaur tracks and other fossil footprints of the Western United States. New York: Columbia University Press; p. 338.
- Lockley MG, Xing L. 2021. A review of the non-avian theropod track record and the implications for the ontogenetic niche shift model. Earth Sci Rev. 220:103715.
- Lucas SG, Klein H, Lockley MG, Spielmann JA, Gierlinski GD, Hunt AP, Tanner LH. 2006. Triassic-Jurassic stratigraphic distribution of the theropod footprint ichnogenus Eubrontes. Vol. 37, Albuquerque: New Mexico Museum of Natural History and Science Bulletin. p. 86–93.
- Marmol-Guijarro A, Nudds R, Folkow L, Codd J. 2020. Examining the accuracy of trackways for predicting gait selection and speed of locomotion. Front Zool. 17(1):17. doi:10.1186/s12983-020-00363-z.
- Mukaddam R, Bordy EM, Lockley MG, Chapelle KEJ. 2020. Reviving Kalosauropus, an Early Jurassic sauropodomorph track from Southern Africa (Lesotho). Hist Biol. 33:2908–2930. doi:10.1080/08912963.2020.1834542.
- Olsen PE. 1980. Fossil great lakes of the Newark supergroup in New Jersey. In: Manspeizer W, editor. Field studies of New Jersey geology and guide to field trips: New York State geological association, 52nd annual meeting. Newark (New Jersey): Rutgers University, Newark College of Arts and Sciences, Geology Department; p. 352–398.
- Olsen PE, Galton PM. 1984. A review of the reptile and amphibian assemblages from the Stormberg of Southern Africa, with special emphasis on the footprints and the age of the Stormberg. Palaeontologica Africana. 25:87–110.
- Olsen PE, Smith JB, McDonald NG. 1998. Type material of the type species of the classic theropod footprint genera Eubrontes, Anchisauripus, and Grallator (Early Jurassic, Hartford and Deerfield basins, Connecticut and Massachusetts, USA). J Vertebr Paleontol. 18:586–601. doi:10.1080/02724634.1998.10011086.
- Rampersadh A, Bordy EM, Sciscio L, Abrahams M. 2018. Dinosaur behaviour in an Early Jurassic palaeoecosystem - uppermost Elliot Formation, Ha Nohana, Lesotho. Annales Societatis Geologorum Poloniae. 88:163–179. doi:10.14241/asgp.2018.010.
- Richter A, Böhme A. 2016. Too many tracks: preliminary description and interpretation of the diverse and heavily dinoturbated Early Cretaceous ‘Chicken Yard’ ichnoassemblage (Obernkirchen Tracksite, northern Germany). In: Falkingham PL, Marty D, Richter A, editors. Dinosaur Tracks: the Next Steps. [place unknown]: Indiana University Press; p. 334–357.
- Sciscio L, Bordy EM, Abrahams M, Knoll F, McPhee BW . 2017. The first megatheropod tracks from the Lower Jurassic upper Elliot Formation, Karoo Basin, Lesotho. PloS one. 12(10):e0185941. doi:10.1371/journal.pone.0185941.
- Sciscio L, Bordy EM, Reid M, Abrahams M. 2016. Sedimentology and ichnology of the Mafube dinosaur track site (Lower Jurassic, eastern Free State, South Africa): a report on footprint preservation and palaeoenvironment. PeerJ. 4:e2285. doi:10.7717/peerj.2285.
- Viglietti PA, McPhee BW, Bordy EM, Sciscio L, Barrett PM, Benson RBJ, Wills S, Chapelle KEJ, Dollman KN, Mdekazi C, et al. 2020. Biostratigraphy of the Massospondylus Assemblage Zone (Stormberg Group, Karoo Supergroup), South Africa. S Afr J Geol. 123:249–262. doi:10.25131/sajg.123.0018.
- Weems RE 1992. A re-evaluation of the taxonomy of Newark Supergroup saurischian dinosaur tracks, using extensive statistical data from a recently exposed tracksite near Culpeper, Virginia. In: Proc. 26th Forum on the Geology of Industrial Minerals (ed. P. C. Sweet). Virginia Division of Miner. Res. Publ, v. 119, p. 113–127. Charlottesville.