
ABSTRACT
This investigation uses archival data (circa 1954) to elucidate new details on Australia’s first scientifically described dinosaur trackway, located at the Fireclay Caverns-Site A, Mount Morgan, Queensland. A high-resolution archival photograph reveals two additional prints, extending the known sequence from four to six tracks. Leveraging this extended dataset, we have quantified temporospatial variations to assess the trackmaker’s locomotion. Our findings reveal a decrease in stride and step lengths towards the end of the trackway, accompanied by a slight directional shift from east-southeast to east and a reduction in walking speed from a maximum of 3.8–1.8 km/hr. The life reconstruction animation of the Fireclay Caverns-Site A trackmaker supports the walking gait calculated from the relative stride data and demonstrates biomechanically plausible limb movements. By incorporating non-traditional methods, such as temporal trackway analysis and its translation as a trackmaker animation, we establish a broader framework for conventional ichnological studies. This approach enhances our interpretation of the dynamic record encapsulated in fossil trackways, enabling us to visualise and scientifically scrutinise the behaviour of extinct trackmakers.
Introduction
Dinosaur tracks and trackways from the Lower Jurassic (Sinemurian) Razorback Beds of Mount Morgan, Queensland, have been scientifically documented since the 1950s. Here, within the Fireclay Caverns – an area historically mined for clay to produce bricks for furnace linings for the adjacent gold-copper mine – close to 200 dinosaur tracks have been reported (Cook et al. Citation2010), and of these, seven trackways have been documented: a pair of three-track trackways (Cook et al. Citation2010: fig. C and E), four trackways with four tracks (Staines Citation1954; Cook et al. Citation2010: fig. A, D and F; Romilio et al. Citation2021:fig. 2), and one trackway with six tracks (Cook et al. Citation2010: fig. B). Interestingly, Staines (Citation1954, Citation2021) remains the only Mount Morgan trackway that has been photographically documented. Significantly, since 2011, the Fireclay Caverns have remained closed to researchers due to the heightened risk of rock falls (Romilio Citation2021; Romilio et al. Citation2021), rendering archival materials crucial for the continuation of research to deepen our understanding of the Mount Morgan tracks and their dinosaurian trackmakers.
Staines (Citation1954) provided the first comprehensive scientific examination of an Australian dinosaur trackway, with his description of a series of natural casts (convex hyporeliefs) located on the Fireclay Caverns-Site A ceiling, Mount Morgan. He described the presence of two different sized tracks and speculated that their occurrence on the same bedding horizon, and shared track orientation, was either due to both sized tracks being attributable to a single trackway created by a quadrupedal trackmaker, or instead represent footprints formed by two bipeds of different sizes. While subsequent researchers interpretated the Fireclay Caverns-Site A tracks as a single quadrupedal theropod (Bartholomai Citation1966; Molnar Citation1980; Molnar et al. Citation1991) or pair of bipedal ornithischians (Romilio et al. Citation2021). Such contrasting views may, in part, be due to the quality of published photographic data. Bartholomai (Citation1966) and Molnar (Citation1980, Citation1991) accessed the low resolution published accounts (Staines Citation1954: unnumbered figure on page 483) that, unfortunately, over-exposed the original photographs and obscured key areas of the track-infill surface, while Romilio et al. (Citation2021) accessed the original high-resolution images from 1954. Importantly, Staines (Citation1954) commissioned two other high-resolution photographs at the time of his original investigation. These include a more extensive view of the Fireclay Caverns-Site A track-infill surface, which includes previously unrecognised structures protruding from the ceiling.
In this study, we examine one of these archival photographs and interpret the protruding ceiling structures as convex hyporeliefs of two additional footprints, which are continuous with the four preceding tracks described by Staines (Citation1954). While in this study we employ traditional ichnological analyses to extract trackway parameters, we supplement them with non-traditional approaches, including calculating of biomechanical data such as cadence (Romilio and Shao Citation2023), creating and animating a life reconstruction of a hypothetical trackmaker to reflect temporospatial data, calculating trackmaker body mass (Larramendi et al. Citation2021), and its theoretical maximum speed (Hirt et al. Citation2017). By drawing on these more recent relevant methodologies (Romilio Citation2023; Romilio et al. Citation2023) we aim to present a scientifically accurate locomotor representation of the Mount Morgan Fireclay Caverns-Site A1 trackmaker. It is our hope that the integration of both traditional and innovative analytical techniques will broaden the digital toolkit for assessing tracks, trackways and their trackmakers, thereby not only advancing our scientific capabilities but also enriching public engagement within palaeo-ichnological inquiries.
Geological setting and locality
The Fireclay Caverns are located approximately 800 m north of the former gold-copper Open Cut pit at Mount Morgan, approximately 38 km southwest of Rockhampton, Queensland (). From 1886 to 1927, the associated hillside was extensively quarried for siltstone to manufacture bricks to line the smelting furnaces of the Mount Morgan Gold Mining Company Limited (Staines Citation1954; Cook et al. Citation2010). This extraction, along with the deliberate retention of sections as natural supports, gave rise to caverns of substantial ceiling heights ranging from 4 to 12 m (). The combination of these factors leads to the opened hillside to be named the ‘Fireclay Caverns’.
Figure 1. Geographical location of the dinosaur tracks within the Fireclay Caverns, Mount Morgan, Lower Jurassic (Sinemurian) Razorback Beds: A, Aerial view of the Fireclay Caverns in relation to the township of Mount Morgan (image courtesy of ©Nearmap); B and C, Aerial imagery of the Fireclay Caverns as a photographic image (B; image courtesy of ©Nearmap) and schematic (C); D, Archival photograph by M. Madlung commissioned by Staines in 1954, depicting a lower ceiling area within the Fireclay Caverns, with asterisks indicating the position of two men to provide scale (names unknown to the authors). A-C, adapted from Romilio et al. (Citation2021).
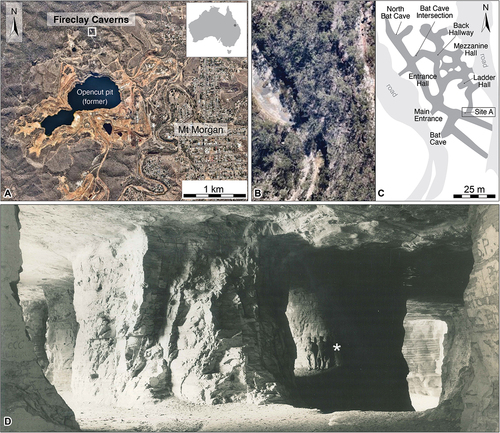
The Fireclay Caverns are composed of a 47-m-thick outcrop of Razorback Beds, the geological formation that palynologically correlates with the Lower Jurassic (Sinemurian) Precipice Sandstone-Lower Evergreen Formation of the Surat Basin (Playford and Cornelius Citation1967; Totterdell et al. Citation2009; Wang et al. Citation2019). The Razorback Beds record three stratigraphic units reflecting diverse terrestrial sedimentary environments. Younging upwards one can see riverine and alluvial fan settings as evidenced by pebbly sandstone; lacustrine environments captured in siltstone deposits; and alluvial processes documented in cross-bedded sandstones (Staines Citation1954; Playford and Cornelius Citation1967; Cook et al. Citation2010). The upper layers of siltstone of the middle lacustrine stratigraphic unit are the only facies from which dinosaur tracks have been reported, and only decades after the industrial extraction of siltstone ceased (Staines Citation1954; Cook et al. Citation2010).
The dinosaur tracks are typically known from convex hyporeliefs (natural casts) in argillaceous sandstone following the erosion of the true track horizon (Staines Citation1954), although natural impressions of tracks (concave epireliefs) have also been documented (Romilio Citation2021). The nine track-bearing ceilings documented within the Fireclay Caverns are as follows: Site A; Site B (Ladder Hall); Site C (Entrance Hall); Site D (North Bat Cave); Back Hallway; Bat Cave; Main Entrance; Mezzanine Hall; and North Cave Intersection (Staines Citation1954; Saini Citation2005; Cook et al. Citation2010; Romilio et al. Citation2021).
Cook et al. (Citation2010) observed the tracks at Site A and reported their position as approximately 4–5 metres above the mine floor (), but did not provide additional details on ichnotaxonomy, their state of preservation, or inferences of trackmaker palaeobiology. The Fireclay Caverns at Mount Morgan have been closed to public and researcher access by the Queensland Government since 2011, due to safety concerns arising from significant erosion.
Material & methods
The current investigation uses archival photographs commissioned by Ross Staines in 1954. Romilio et al. (Citation2021) labelled the Site A dinosaur trackway as A1 and its associated tracks as A1.1 - A1.4. The current study’s use of an archival photograph captures more of the Site A track surface which reveals what we here interpret as a continuation of the A1 trackway sequence with two additional prints that we label here as A1.5 and A1.6.
A digitised version of the archival photograph was added to Blender software (version 3.5) and then aligned and scaled prior to obtaining trackway parameters and trackmaker biomechanical data. The image was aligned by rotating it to have its north direction oriented with the +Y-axis of the virtual 3D environment. The replica of track A1.2 (as described by Romilio et al. Citation2021) provide a reference for correctly scaling the archival photograph to the world scale of Blender. Length measurements (i.e. footprint, pace, and stride) were made in Blender using the distance between two vertex positions:
Length = ((x2-x1)2 + (y2-y1)2)0.5
Footprint length was calculated using vertices placed at the most proximal and distal position of the tracks. For the calculation of pace and stride lengths, vertices were positioned at the proximal end of the metatarsophalangeal pad; however, for track A1.1, which consists only of a single-digit impression, the vertex was placed at the most proximal part of the digit. Step length and step angle were calculated following the method described by Romilio and Shao (Citation2023). Here, step length represented the distance between consecutive footprints made by the opposite autopodia when measured along the stride/trackway axis (). The step angle was measured from the connections between the pace and stride lines ().
Figure 2. Dinosaur trackway parameters. Dotted lines denote axes and positions the metrics were taken. Pace denotes the distance between consecutive footprints made by the opposite autopodia (e.g. left to right pedes); Pa denotes the pace angulation; Stpa denotes the step angle; Stride denotes the distance between consecutive footprints made by the same autopodia (e.g. consecutive left pedes); Stp denotes the distance between consecutive footprints made by the opposite autopodia when measured along the stride/trackway axis; the asterisk denotes the formula to determine the terminal trackway step length.
In practice, trackway length is measured from the first to the last footprint. However, this parameter is not standardised in seminal ichnological literature, such as Leonardi (Citation1987) or Thulborn (Citation1990). This method also becomes problematic in trackways that are not linear, such as those that curve or loop back on themselves, where it fails to provide relevant behavioural insights. Our study defines trackway length as the sum of each step length.
Trackway width was calculated by treating the measurement within a right-angled triangle, where the pace length was the hypotenuse and step length as one side, and was calculated using the equation:
Trackway width = ((pace)2 - (step)2)0.5
Velocity was determined using an adapted version of Alexander’s (Citation1976) speed equation (Ruiz and Torices Citation2013) to which we applied to both traditional stride lengths and non-traditional step lengths (in the latter equation, the stride length value was replaced with twice the step length). The hip height was estimated based on four times the length of track A1.2 (Romilio et al. Citation2021: ). To determine the time the trackmaker spent registering tracks, we used the equation:
Table 1. Trackway and trackmaker parameters for the Fireclay Caverns-Site A1 trackway, Mount Morgan, Lower Jurassic (Sinemurian) Razorback Beds.
Time on site = trackway length/average velocity
Cadence is defined as the frequency of steps taken within a given time frame, such as steps per minute or steps per second. Conversely, step duration, being the reciprocal of cadence, is the time interval from the initial contact of one foot to the initial contact of the contralateral foot.
To determine the gait, we used relative stride as described by Alexander (Citation1976). Here, a relative stride value of less than 2 signifies walking, greater than 2.9 indicates running, while values in-between represent trotting (quadrupeds) or jogging (bipeds). In this study, we introduce ‘relative step’ (step length/hip height), where relative step less than 1 signifies walking, greater than 1.45 indicates running, with values in-between representing trotting/jogging (quadrupeds/bipeds). ‘relative step’ was introduced to determine if relative changes occur between contralateral footfalls in comparison to those from the same side of the body (as in relative stride).
In the absence of direct body fossil evidence of a Jurassic-aged Australian ornithischian (Romilio et al. Citation2021), we constructed a digital life reconstruction of a hypothetical trackmaker, modelled loosely after a basal ornithischian dinosaur Pisanosaurus (Bonaparte Citation1976; Hartman Citation2013; Novas et al. Citation2021) using Blender software (Romilio Citation2023)). The selection of Pisanosaurus was based on its basal morphological traits, which we considered more representative of a generalised ornithischian form. This approach was preferred over adopting more temporally consistent but morphologically derived Gondwanan taxa like Lesothosaurus or Heterodontosaurus, which exhibit specialised forelimb reduction and dentition, respectively. The trackmaker dimensions were extrapolated from the track A1.2 (as it is the only print that could be physically measured; Romilio et al. Citation2021) length measurements and associated hip height calculation.
The animation process was intentionally simplified to focus on the accuracy of footfalls and their temporospatial positioning as derived from the trackway data. Each foot was animated to lift during the step phase and return to the calculated position for ground contact. The inverse kinematic capabilities of the rigging system provided the biomechanical range of motion of the legs. A central aim was to ensure the trackmaker’s centre of mass remained consistently over the hip region throughout the locomotion sequence.
We determined the body mass of the trackmaker by calculating the volume of the 3D hypothetical trackmaker model and applying the specific gravity of 1000 kg/m3 value for ornithischians provided by Larramendi et al. (Citation2021). The body mass estimate was then used to estimate the trackmaker’s terrestrial theoretical maximum speed, employing formula developed by Hirt et al. (Citation2017) using the following allometric equation:
Vmax = 25.5 * M^0.26 * (1 - e^[−22 * M−0.6])
where M represents the body mass (kg), e is the base of the natural logarithm, and the constants 25.5 and 22 are derived from empirical scaling relationships.
Results
The Site A track-infill surface is irregularly shaped and measures ~3.3 m2 (). This surface preserves six medium-sized pedal natural casts (A1 tracks; L:W A1.2 = 22.3:27.0 cm, L:W A1.3 = 23.7:27.0 cm; Romilio et al. Citation2021: ) and one isolated smaller pedal natural cast (A2; L:W = 12.0:13.3 cm; Romilio et al. Citation2021: ) oriented mainly to the southeast. With the identification of the two additional footprints (A1.5 and A1.6), we recognise the A1 trackway extends to a length of 2.53 m. Tracks A1.1-A1.4 and A2 have been described before (see Romilio et al. Citation2021) and so our focus will be to describe the new tracks, A1.5 and A1.6, and their context of the A1 trackway.
Figure 3. Dinosaur tracks at the Fireclay Caverns-Site A, Mount Morgan, Lower Jurassic (Sinemurian) Razorback Beds. A, the original image adapted from Staines (Citation1954: unnumbered figure on page 483). In this photograph, H. ‘Ross’ E. Staines is depicted holding a 12-inch draughtsman’s scale against the track-bearing ceiling, approximately 4–5 metres above the Fireclay Caverns’ floor. The cavern wall is shaded grey to differentiate it from the ceiling. B, Near-orthographic perspective photograph of the dinosaur track-infill surface at the Fireclay Caverns-Site A. C, Schematic interpretation of the dinosaur track-infill surface at the Fireclay Caverns-Site A. Photo credit: M. Madlung, circa 1954.
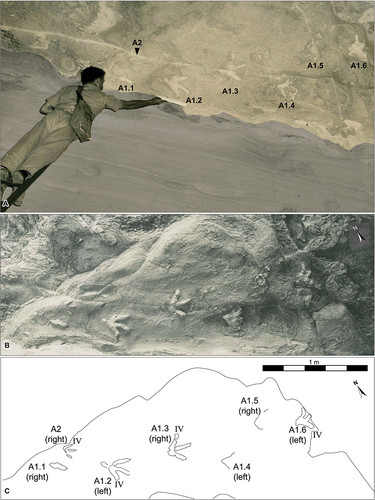
Track A1.6 is a natural cast of a left pedal impression and cranially is at the edge of the track-infill surface. It is an eroded, tridactyl print, approximately 16.0 cm long, and 20.7 cm wide. The digits are moderately splayed near the hypex, with digit divarication II^II 33º and III^IV 42º. Situated between tracks A1.4 and A1.6 is an extensively eroded impression, which we interpret as track A1.5. Although the morphology of A1.5 is largely obscured, discernible features include a segment of the lateral margin of digit IV contiguous with the proximal boundary of the metatarsophalangeal pad, as well as the proximolateral edge of digit II. Based on these preserved elements, we were able to estimate the locations of corresponding track features, thus enabling us to measure trackway parameters (e.g. stride length).
Analysis of the stride-based trackway orientations () indicates a slight directional change by the trackmaker during the footprint registration sequence. The trackway begins in an orientation to the east-southeast (ESE) at ~114º–117º, followed by a slight shift (103º), and then finally moved to the east (91º). This progression indicates a gradual leftward directional change by the A1 trackmaker.
Table 2. Expanded trackway and trackmaker parameters for the Fireclay Caverns-Site A1 trackway, Mount Morgan, Lower Jurassic (Sinemurian) Razorback Beds. A ‘relative stride’ value of less than 2 signifies walking, greater than 2.9 indicates running, while values in-between represent trotting/jogging (quadrupeds/bipeds). A ‘relative step’ value of less than 1 signifies walking, greater than 1.45 indicates running, with values in-between represent trotting/jogging (quadrupeds/bipeds).
The initial measurements of the A1 trackway show the longest paces (0.60 and 0.63 m), steps (0.59 and 0.62 m), and strides (1.22 and 1.16 m). Subsequently, there is a noticeable decrease in pace (0.56, 0.47, and 0.43 m), step (0.5, 0.44, and 0.39 m), and stride lengths (0.88 and 0.83 m) towards the end of the trackway. Although this pattern corresponds to a transition from better- to poorer-preserved footprints, we do not attribute the change to preservation bias, as tracks A1.2-A1.6 consistently exhibit the metatarsophalangeal pad critical for these measurements. We propose that the observed reduction in trackway dimensions reflects behavioural modifications of the trackmaker, rather than distortions arising from the measurement process.
Since there exists a relationship between the distance between footprints and speed (i.e. greater the distance, the greater the speed; Alexander Citation1976), our stride-based velocity calculations show a decrease from 3.7 to 2.0 km/hr (average 2.8 km/hr). Our analysis of step-based velocities similarly shows the decrease from 3.8 to 1.8 km/hr (average 2.8 km/hr). This trend of decreasing lengths (pace, step, stride) and velocities indicates a deceleration of the trackmaker along the trackway. Even though there was a notable decrease in speed, the relative stride lengths (maximum of 1.26, minimum of 0.86) indicate a walking gait was maintained over the entire trackway length.
Changes in the trackway are also observed in the pace angulation, which started at a high of 162º and exhibited a decreasing trend, culminating in a low of 116º. This is equivalent to the change in the step angle, which increased from a modest 9º to over 20º. Additionally, the trackway width changed from a narrow 0.10 m at the outset, expanded to a maximum of 0.27 m, and subsequently became reduced to 0.18 m. This observation suggests that the broadest straddle was adopted not at the slowest speed but as the dinosaur was decelerating.
We quantified the trackway’s temporal movements by calculating the cadence, which averaged 89.0 steps per minute. This cadence, however, exhibited variability from the start to the end with values of 99.4, 102.2, 88.2, 81.1 and 75.6 steps per minute. Additionally, the duration of individual steps fluctuated across the trackway with values of 0.60, 0.59, 0.68, 0.74, and 0.79 s, with an overall average step duration of 0.67 s.
The animation (Supplementary Animation 1: Figshare: 10.6084/m9.figshare.25204148, or view https://youtu.be/sg4yFdoIFv0) based on this data, supported the walking gait of the trackmaker. This was evidenced by the consistent ground contact of the feet-one foot was always in contact with the ground and at no point did the animation depict an aerial phase, which would be characteristic of jogging or running. This aligns with the relative stride calculations indicating a walking locomotion throughout the trackway. Also, there were no improbable leg poses created after footfall placements, which also supports the biomechanical plausibility of the animation.
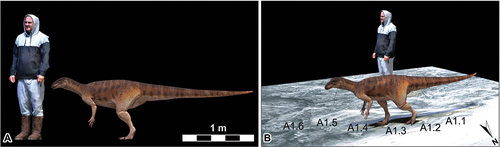
Our reconstructed hypothetical ornithischian trackmaker 3D model had a volume of 0.12 cubic metres. Using a specific gravity (density) of 1000 kg/m3, we calculate the trackmaker had a body mass of approximately 94 kg, and for an animal of this mass, we estimate had a maximum terrestrial speed of 63 km/hr. Based on this model, this indicates the trackmaker was moving at between 6% (at the start of the trackway) and 3% (by the end of the trackway) of its maximum speed at the time of trackway registration (; )
Figure 4. Life reconstruction of a hypothetical trackmaker based on the Fireclay Caverns-Site A1 trackway, Mount Morgan, Lower Jurassic (Sinemurian) Razorback Beds. A, a hypothetical Mount Morgan ornithischian trackmaker (based on Pisanosaurus) to scale with a 1.75 m human; B, a screenshot of the hypothetical Mount Morgan ornithischian trackmaker animated in accordance with the spatiotemporal data obtained from the A1 trackway. Note that the trackway infill surface has been flipped to mirror the infill tracks and thus represent the track impressions. Download the animation from Figshare: 10.6084/m9.Figshare.25204148, or view from YouTube https://youtu.Be/sg4yFdoIFv0
Discussion
Comparatively few dinosaur trackways from the Jurassic have been documented in Australia. These include seven trackways from Mount Morgan’s Lower Jurassic (Sinemurian) Razorback Beds (Staines Citation1954; Saini Citation2005; Cook et al. Citation2010), two potential trackways from the Carnarvon Gorge of the Lower Jurassic (Hettangian-Sinemurian) Precipice Sandstone (Thulborn Citation1994), and seven trackways from the Rosewood-Oakey regions of the Middle-Upper Jurassic (lower Callovian-lower Tithonian) Walloon Coal Measures (Romilio et al. Citation2021). Furthermore, an additional 13 trackways from the Lower Jurassic (Hettangian-Sinemurian) Precipice Sandstone from Biloela are pending formal description (Romilio et al. Citation2023). Comprehensive photographic documentation of these trackways is rare, with the notable exception being the A1 trackway from Mount Morgan (Staines Citation1954: unnumbered figures pages 483, 485).
Staines (Citation1954) evaluations and measurements of the Fireclay Caverns-Site A tracks and A1 trackway was conducted under the challenging conditions, that of standing on a ladder 4–5 metres above the ground (). He recorded the A1 trackway pace measurement of approximately 2 feet (roughly 60 cm), but it is uncertain whether this is an average of the pace lengths between A1.1 and A1.4 or a single measurement. Despite this, our digital analysis of Staines’ archival photograph, yields pace measurements that agree with his findings: 60 cm for A1.1-A1.2, 63 cm for A1.2-A1.3, and 56 cm for A1.3-A1.4 ().
The tracks we designate here as A1.5 and A1.6 can be seen in Staines’ original 1954 publication (unnumbered figure page 483) but were not identified at that time as ichnites. The amorphous nature of A1.5 may have led to its initial dismissal as a track, while the published photograph was cropped from a larger image (), leading to parts of A1.6 being omitted. This likely drew attention away from its potential significance as part of the trackway. Our identification of A1.6 as a tridactyl track that forms part of the A1 trackway is important. This is particularly so since A1.5, when considered in isolation, presents a less definitive case as a track, but its intermediate position between A1.4 and A1.6 supports the interpretation of it being part of the track sequence. Our extension of the A1 trackway to be a six-track trackway provided us with an opportunity to showcase this historically significant trackway (i.e. the first dinosaur trackway to be scientifically described in Australia) with novel approaches that provide a temporospatially accurate life reconstruction and animation of the Mount Morgan trackmaker.
Ideally, our digital analysis would have utilised a three-dimensional model of the track-infill surface or an orthoimage derived from such a model. Regrettably, no access to such resources from Mount Morgan was possible due to the permanent closure of the site. However, we benefit from the fact that Staines’ photograph () was captured approximately 4 m from the trackway and directed towards the zenith. While this suggests minimal lens distortion, we recognise that a field validation through the acquisition of 3D data at the Mount Morgan site would be necessary to substantiate this assumption.
Importantly, our research illustrates how modern analytical techniques can enhance the interpretation of track sites by facilitating the extraction of more detailed trackway parameters and biomechanical data of dinosaur trackmakers. Staines (Citation1954) originally proposed two hypotheses to explain the differently sized tridactyl prints at Site A: either a single quadrupedal trackmaker exhibiting high heteropody, or two bipedal trackmakers of varying sizes, but we follow research by Romilio et al. (Citation2021) who added support to Staines (Citation1954) latter theory-two bipedal ornithischians as the Site A trackmakers. Based on the assumption that the A1 trackway comprises only four tracks, Romilio et al. (Citation2021) interpreted uniform stride lengths (1.18 and 1.16 m) as indicative of a constant walking speed of 4.1 km/hr. Our study’s use of stride-based velocity measurements shows a moderate decrease in speed over the first two stride lengths, and when calculated using bipedal speed evaluations (see Ruiz and Torices Citation2013), these speeds indicate a change from 3.7 km/hr to 3.4 km/hr. Our incorporation of the two additional tracks (A1.5 and A1.6), which show shortened stride lengths (0.88 and 0.83 m) towards the end of the trackway, indicates a further deceleration from 2.2 km/hr to 2.0 km/hr. This new evidence suggests that the trackmaker’s speed was not constant but slowed over the time of track registration. The identification of these additional tracks fundamentally shifts our understanding of the trackmaker’s behaviour, from a uniform speed to a decelerating motion.
This change is accompanied by a subtle curve in the trackway, which suggests that the trackmaker was altering its direction of movement. It is conceivable that the less distinct morphologies of tracks A1.4 to A1.6 may be attributable to substrate variations at the time of track registration, potentially influencing the observed decrease in pace and stride lengths due to differences in rheology. Alternatively, the diminished definition of these tracks may be a consequence of more extensive erosion at the trackway’s eastern extremity, situated further away from the protective proximity of the cavern walls.
The incorporation of step length measurements in our analysis has enabled the determination of refined step-by-step velocities, which represents a novel approach in dinosaur ichnology for a more nuanced assessment of locomotor patterns. Here, we estimate the trackmaker speed changed from 3.5, 3.8, 2.6, 2.1 and 1.8 km/hr, indicating the trackmaker slightly increased speed (by 0.3 km/hr), then moderately decelerated (by 1.2 km/hr), followed by a steady, slight reduction in speed (0.3 and 0.3 km/hr).
Cadence and its reciprocal step duration are also novel parameters used in fossil trackways (Romilio and Shao Citation2023). In this study, we calculate the A1 trackmaker averaged a step frequency of 89.0 steps/min () but varied from the start to the end of the trackway with values ranging from 99.4 to 75.6 steps per minute (). The use of step duration in dinosaur ichnology is arguably more intuitive to translate into trackmaker locomotor behaviour. We estimated the A1 trackmaker took 0.67 s for each step on average, but varied along its progression with step duration sequences of 0.60, 0.59, 0.68, 0.74 and 0.79 s. The lengthening of the step durations meaning the animal slowed. We are of the opinion that this step-centric analysis enhances our understanding of trackmakers by detailing the temporal variability within the trackway sequence.
Animating extinct trackmakers represents a significant step forwards in the application of digital technologies to palaeo-ichnological research. One of the inherent challenges in animating a trackmaker is to ensure biomechanical feasibility, given that the 3D digital environment allows for a wide range of motion that may not be biologically plausible. Maintaining the calculated gait from the trackway may be a source of confidence in the animated trackmaker model. The A1 trackway consistently indicated a walking gait across all measurements (minimum-maximum relative stride of 0.86–1.26; minimum-maximum relative step of 0.41–0.64). Walking was also mirrored in our trackmaker animation as both left and right feet were in ground contact simultaneously during step registration – a condition necessary for this gait. This contrasts with jogging or running, which require no simultaneous ground contact of both feet, as well as an aerial phase.
Another avenue for confidence is if ensuring limb movements of the animated trackmaker are biomechanically plausible. We found that throughout our animation, there were not anatomically improbable hindlimb poses (i.e. no hyperextended limbs) needed to maintain the integrity of the trackmaker’s locomotion. As such, our animation of the Mount Morgan A1 trackmaker is also biomechanically plausible. The fact that the animation resulted in no improbable poses or unnatural limb movements suggests that our methodology is robust.
Although beyond the scope of the current investigation, digital reconstructions present a novel avenue for resolving inconsistencies in hip height estimates of trackmakers and their associated trackways, ensuring that reconstructions remain within biologically possible limits. The range of hip height estimations for a trackmaker – derived from methods as varied as simple multipliers of footprint length (Alexander Citation1976) to complex morphometric and allometric equations (Thulborn Citation1990) – can introduce substantial discrepancies in size assessments. These variations, when applied to a single trackmaker, may lead to significantly divergent gait and speed calculations, which in turn affect interpretations of extinct trackmakers’ locomotion. To address this, incorporating the limb proportions of well-documented body fossil taxa into digital reconstructions may provide a more anatomically substantiated framework for modelling trackmaker dimensions.
Conclusion
This research underscores the significance of archival material in palaeontological studies, particularly when direct access to fossil sites is precluded. Our re-examination of Australia’s first described dinosaur trackway – the Mount Morgan Fireclay Caverns-Site A1 trackway – initially documented in 1954 has expanded the known track sequence from four to six imprints. Our study has extracted temporospatial data that indicated the trackmaker continuously used a walking gait but progressively decelerated. Our use of trackmaker digital animation corroborated the walking locomotor behaviour through gait analysis and biomechanically plausible limb movements.
The success of this innovative approach underscores its potential to broaden the scope of palaeontological research, allowing for deeper exploration into the biological aspects of ancient life through digital technology. Embracing such advancements permits a re-evaluation of previously documented trackways (in addition to assessing new tracksites) offering opportunities to refine our interpretations of dinosaurian locomotion. Consequently, this work not only enriches our understanding of the Jurassic fauna of Australia but also serves as a catalyst for the broader application of digital tools in palaeobiology.
Supplemental Material
Download MS Word (12.3 KB)Acknowledgments
We are grateful to Diego Castanera, Jens Lallensack and an anonymous reviewer for their comments and constructive critiques, which significantly contributed to the refinement of this manuscript. We extend our thanks to Peter Romilio for his consent to be photogrammetrically scanned and for allowing his 3D virtual model to serve as a human-scale reference in the study of the dinosaur trackmaker.
Disclosure statement
No potential conflict of interest was reported by the author(s).
Supplementary material
Supplemental data for this article can be accessed online at https://doi.org/10.1080/08912963.2024.2320184
Additional information
Funding
References
- Alexander RM. 1976. Estimates of speeds of dinosaurs. Nat. 261(5556):129–130. doi: 10.1038/261129a0.
- Bartholomai A. 1966. Fossil footprints in Queensland. Aust Nat Hist. 15(5):147–150.
- Bonaparte JF. 1976. Pisanosaurus mertii Casamiquela and the origin of the Ornithischia. J Paleontol. 50(5):808–820.
- Cook AG, Saini N, Hocknull SA. 2010. Dinosaur footprints from the Lower Jurassic of Mount Morgan, Queensland. Mem Qld Mus. 55(1):135–146.
- Hartman S. 2013. Dr. Scott Hartman’s Skeletal Drawing.com. [accessed 2023 12 01]. https://www.skeletaldrawing.com/ornithiscians/pisanosaurus.
- Hirt MR, Jetz W, Rall BC, Brose U. 2017. A general scaling law reveals why the largest animals are not the fastest. Nat Ecol Evol. 1(8):1116–1122. doi: 10.1038/s41559-017-0241-4.
- Larramendi A, Paul GS, Hsu S. 2021. A review and reappraisal of the specific gravities of present and past multicellular organisms, with an emphasis on tetrapods. Anat Rec Hoboken. 304(9):1833–1888. doi: 10.1002/ar.24574.
- Leonardi G, editor. 1987. Glossary and manual of tetrapod footprint palaeoichnology. Brasilia, Brazil: Departmento Nacional da Producao Mineral.
- Molnar RE. 1980. Australian late Mesozoic terrestrial tetrapods: some implications. Mém Soc géol Fr Nouvell Ser. 139:131–143.
- Molnar RE. 1991. Chapter 18, Fossil reptiles in Australia. In: Vickers-Rich P, Monaghan J, Baird R, editors. Vertebrate Palaeontology of Australasia. Melbourne: Pioneer Design Studio, and Monash University Publications Committee; p. 605–702.
- Novas FE, Agnolin FL, Ezcurra MD, Temp Müller R, Martinelli AG, Langer MC. 2021. Review of the fossil record of early dinosaurs from South America, and its phylogenetic implications. J South Amer Earth Sci. 110:103341. doi: 10.1016/j.jsames.2021.103341.
- Playford G, Cornelius KD. 1967. Palynological and lithostratigraphic features of the Razorback Beds, Mount Morgan district, Queensland. Pap Depart Geol Univer Qld. 4(3):81–96.
- Romilio A. 2021. Additional notes on the Mount Morgan dinosaur tracks fromthe Lower Jurassic (Sinemurian) Razorback Beds, Queensland, Australia. Hist Biol. 33(10):2005–2007. doi: 10.1080/08912963.2020.1755853.
- Romilio A. 2023. Bringing Dinosaur Trackmaker Behaviour to Life: 3d Modelling and Animation Techniques Using Lark Quarry as a Case Study. In: Vlachos E, Crespo VD, Ríos Ibañez M, et al., editors. Book of Abstracts of the 4th Palaeontological Virtual Congress. p. 8–22.
- Romilio A, Dick R, Skinner H, Millar J. 2021. Archival data provides insights into the ambiguous track-maker gait from the Lower Jurassic (Sinemurian) Razorback Beds, Queensland, Australia: evidence of theropod quadrupedalism? Hist Biol. 33(9):1573–1569. doi: 10.1080/08912963.2020.1720014.
- Romilio A, Park R, Nichols W, Jackson O, Lockley MG. 2023. New insights into ornithischian dinosaur trackmakers in the Lower Jurassic Precipice Sandstone, Callide Basin, Queensland, Australia. Melbourne, Victoria: CAVEPS Melbourne 2023; November 27th - 30th; Melbourne Museum.
- Romilio A, Salisbury SW, Jannel A. 2021. Footprints of large theropod dinosaurs in the Middle–UpperJurassic (lower Callovian–lower Tithonian) Walloon Coal Measures of southern Queensland, Australia. Hist Biol. 33(10):2135–2146. doi: 10.1080/08912963.2020.1772252.
- Romilio A, Shao C. 2023. Analysing trackway-based speed calculations to infer dinosaur locomotive capabilities and behaviours. Hist Biol. 1–10. doi: 10.1080/08912963.2023.2251127.
- Ruiz J, Torices A. 2013. Humans Running at Stadiums and Beaches and the Accuracy of Speed Estimations from Fossil Trackways. Ichnos. 20(1):31–35. doi: 10.1080/10420940.2012.759115.
- Saini N. 2005. Geology and palaeo-ichnology of the Razorback Beds, Mount Morgan, Queensland [ Thesis]. University of Wollongong.
- Staines HRE. 1954. Dinosaur footprints at Mount Morgan. Qld Govern Mining J. 55(623):483–485.
- Thulborn RA. 1994. Ornithopod dinosaur tracks from the Lower Jurassic of Queensland. Alcheringa Australas J Palaeontol. 18(3):247–258. doi: 10.1080/03115519408619498.
- Thulborn T. 1990. Dinosaur Tracks. London: Chapman and Hill.
- Totterdell JM, Moloney J, Korsch RJ, Krassay AA. 2009. Sequence stratigraphy of the Bowen–Gunnedah and Surat Basins in New South Wales. Aust J Earth Sci. 56(3):433–459. doi: 10.1080/08120090802698729.
- Wang J, La Croix AD, Gonzalez S, He J, Underschultz J. 2019. Sequence stratigraphic analysis of the Lower Jurassic Precipice Sandstone and Evergreen Formation in the Surat Basin, Australia: Implications for the architecture of reservoirs and seals for CO2 storage. Mar Petrol Geol. 102:829–843. doi: 10.1016/j.marpetgeo.2019.01.038.