
Abstract
In the era towards precision medicine, we here present the individual specific autoantibody signatures of 193 healthy individuals. The self-reactive IgG signatures are stable over time in a way that each individual profile is recognized in longitudinal sampling. The IgG autoantibody reactivity towards an antigen array comprising 335 protein fragments, representing 204 human proteins with potential relevance to autoimmune disorders, was measured in longitudinal plasma samples from 193 healthy individuals. This analysis resulted in unique autoantibody barcodes for each individual that were maintained over one year’s time. The reactivity profiles, or signatures, are person specific in regards to the number of reactivities and antigen specificity. Two independent data sets were consistent in that each healthy individual displayed reactivity towards 0–16 antigens, with a median of six. Subsequently, four selected individuals were profiled on in-house produced high-density protein arrays containing 23,000 protein fragments representing 14,000 unique protein coding genes. Based on a unique, broad and deep longitudinal profiling of autoantibody reactivities, our results demonstrate a unique autoreactive profile in each analyzed healthy individual. The need and interest for broad-ranged and high-resolution molecular profiling of healthy individuals is rising. We have here generated and assessed an initial perspective on the global distribution of the self-reactive IgG repertoire in healthy individuals, by investigating 193 well-characterized healthy individuals.
A unique longitudinal profiling of autoantibody repertoires in healthy individuals
Autoantibody profiles are highly individual and stable over time
All individuals display IgG binding to human protein fragments
The specificity of disease associated autoantigens needs to be thoroughly characterized
The identification of a small set of highly reactive autoantigens
Importance of stringent antigen and sample specific cut-offs for defining reactivity
Highlights
Introduction
Although it is commonly believed that the population of immature B cells is purged of cells bearing self-reactive B cell receptors, it is also well established that all individuals display a wide variety of antibodies in their periphery that could react to self and non-self-antigens regardless of external stimuli [Citation1]. Indeed, the term “natural autoantibodies” was first described by Boyden in the early 1960´s referring to an autoreactive response in sera of a healthy individual [Citation2]. In 1988, Francoeur published the term “individual specific antibodies” to describe the self-reacting repertoire of antibodies in healthy individuals [Citation3].
Since then, there have been limited possibilities to perform broad and deep profiling of the global autoantibody repertoires, with a shortage in efforts to characterize the distribution of autoantibody targets within diseases with known or speculated autoimmune components. This has also affected the possibilities for screening for novel autoantigens. Indeed, several disease-associated autoantigen candidates could possibly, or even likely, be part of the global autoantibody repertoires identified among healthy individuals. We therefore consider that it is of great importance to establish and explore the general specificities of IgG repertoires, not at least within healthy individuals. There are three main requirements to perform this: i) access to a proteome-wide range representation of human proteins; ii) multiplexed assay formats enabling the analysis of large numbers of potential autoantigens as well as large numbers of samples in parallel; iii) well-characterized and carefully selected longitudinal sample materials of a decent size.
The Human Protein Atlas (HPA, www.proteinatlas.org) has for a period of 15 years been devoted to the production of E. coli-expressed protein fragments for immunization into rabbits in order to generate polyclonal antibodies that can be used for the characterization of protein expression and localization of basically all human proteins in tissues and cells [Citation4,Citation5]. Currently, more than 42,000 unique and mass spectrometry verified protein fragments of in average 80 amino acids have been produced. We have within HPA developed and utilized various planar and bead-based protein microarray formats for the initial validation of antibody specificity and for the profiling of autoantibody repertoires [Citation6–12].
The access to the massive library of protein fragments within HPA, combined with the development of novel standardized array formats, has now enabled proteome-wide screenings for novel autoantigen associations. We have here utilized a custom designed antigen bead array for the parallel analysis of a total of 859 unique plasma samples from 193 healthy individuals focusing on a panel of 335 protein fragments representing 204 unique proteins. We have also subsequently analyzed four samples on a planar array with 23,000 protein fragments representing 14,000 unique protein coding genes.
All individuals profiled within this study were enrolled in two separate initiatives for longitudinal sampling of healthy individuals, one in Sweden (Swedish SCAPIS SciLifeLab Wellness Profiling (S3WP) project) and one in Finland (Digital Health Revolution (DHR) program at Institute for Molecular Medicine Finland, FIMM, HiLIFE, University of Helsinki). Both studies enrolled around 100 participants that completed clinical phenotyping, lifestyle questionnaires and repeated sampling of blood, urine and stool. These samples have hitherto been deeply analysed in regards to clinical chemistry, genomics, proteomics, metabolomics, and gut microbiomics.
With this unique and large screening of well characterized healthy individuals, we have generated a first perspective on the self-reactive IgG repertoire with molecular resolution. We show that each individual displays a personal set of IgGs reactive to human proteins, and this profile is stable across 4–5 samplings over one year time. With this we want to further broaden the knowledge about natural occurring IgG autoantibodies and their implication for health and disease.
Materials and methods
Ethical permit and participant consent
Both the Swedish SCAPIS SciLifeLab Wellness Profiling (S3WP) project and the Digital Health Revolution (DHR) study were conducted according to the guidelines of the Declaration of Helsinki. The S3WP and DHR research protocols were approved by the coordinating ethics committee of the Ethical Review Board of Gothenburg, Sweden (DNR 407-15) and by the HUS Hospital District (Helsinki, Finland) (51/13/03/00/15), respectively. All participants provided a written informed consent.
S3 study population
The S3WP study is an observational study with the aim to collect longitudinal data in a community-based cohort. A total of 101 subjects were recruited from the ongoing Swedish Cardio Pulmonary bioImage Study (SCAPIS), which includes randomly selected subjects aged 50–65 years from the general Swedish population. Examinations in SCAPIS included imaging to assess coronary and carotid atherosclerosis, clinical chemistry, anthropometry, and lifestyle questionnaires, as previously described [Citation13]. Thus, the subjects were extensively phenotyped before entering the S3WP study. In SCAPIS, no exclusion criteria were applied except the inability to understand written and spoken Swedish for informed consent. In the S3WP study, subjects were excluded if they had clinically significant cardiovascular disease, diabetes, or medication for hypertension or hyperlipidemia. At four occasions during one year, subjects were examined and sampled. Subjects underwent identical examinations at each visit, including measurements of body weight, waist and hip circumference, body fat using bioimpedance (Tanita MC-780MA), and blood pressure. A selection of questions from the initial SCAPIS questionnaire was repeated at each visit to note any potential changes in health and life-style factors between each visit such as infections, disease, medication, perceived health, and exercise level. Each visit also included collection of blood, urine and stool for subsequent clinical chemistry and omics analyses. From visit 2 and onward, subjects were wearing accelerometers (Polar A360) to measure physical activity. For more information on the participants, see Supplementary Table 1.
DHR study population
The DHR study is a pilot for the next-generation personalized health research by integrating longitudinal multi-omics profiling, digital monitoring and personal data. The study was conducted at the Institute for Molecular Medicine Finland (FIMM, HiLIFE, University of Helsinki, Finland). A total of 107 subjects (aged 25–59) from the clientele of a private occupational health care service provider were recruited and 87 out of them completed the study with samples given at five visits. Although none of the participants had any previously diagnosed serious diseases, individuals with elevated risk factors for chronic diseases were still included. Over a 16-month period, the participants donated blood, urine, saliva, and stool samples at five different occasions. Anthropometric and physiological measurements, questionnaire, fitness test, quantified self-tracking, and food purchasing data were systematically collected. Clinical chemistry, genomics, proteomics, metabolomics, and gut microbiomics analyses were performed. Key actionable data were interpreted and returned to participants in real-time via a personal health account and web-based tools starting from the second study visit. These data were the basis for tailored health and wellness advices and coaching provided by a personal trainer from the third study visit forward. For more information on the participants, see Supplementary Table 1.
Sampling and storage of plasma
In both S3WP and DHR, all subjects were fasting overnight, for at least 8 hours, before sampling. Blood samples were drawn in EDTA tubes using standard operating procedures. All samples were stored at −80 °C until use.
Selection of antigens and creation of bead array
A collection of 335 antigens, representing sequence unique regions from 204 protein coding genes, were selected based on potential relevance to autoimmune disorders. Antigens were identified from literature or from previous internal studies (see Supplementary Table 2 for complete collection of the covered protein coding genes and corresponding references). The antigens consisted of protein fragments (20–163 amino acids, with a median of 79) produced within the Human Protein Atlas project, www.proteinatlas.org [Citation4]. All fragments were expressed in Escherichia coli with a six histidine and albumin binding protein tag (His6ABP). All antigens and four assay controls were immobilized on colour coded magnetic beads (MagPlex, Luminex Corp.) using COOH–NH2 chemistry. The controls consisted of His6ABP (control of binding to protein tag), buffer (control of binding to bead particles), rabbit anti human IgG (Jackson, 309-005-082) (sample loading control), and Epstein Barr nuclear antigen 1 (EBNA1, abcam, ab138345) (high reactivity frequency expected).
Autoantibody profiling on bead array
IgG reactivities towards human protein fragments were analysed by an antigen bead array, as previously described [Citation6–12]. In short, plasma IgG was captured on antigen coated beads and detected by fluorescent anti-hIgG in a high throughput format. Individual samples from S3WP visits 1–4 were randomized over six 96-wells plates. Individual samples from the DHR visits 1–5 were also randomized into six 96-well plates. Each cohort was analysed at separate time points. At each analysis day, the samples were thawed in the fridge, diluted 1:250 in buffer 1 (3% BSA and 5% milk in PBS supplemented with 0.1% Tween-20 and 160 µg/ml His6ABP tag) and a sample pool was distributed in triplicates together with one blank well per randomized plate. Before incubation with the antigen bead array, all samples were incubated for one hour at room temperature in order for the His6ABP in the buffer to pre-block any potential antibodies toward the albumin binding protein domain in the tag. Subsequently, the plasma samples were incubated with the antigen bead array for two hours at room temperature. Goat fab fragments anti human IgG Fγ, labeled with R-phycoerythrin (R-PE, Invitrogen, H10104), were thereafter added to enable a read out using FlexMap 3D (Luminex Corp.). For each cohort, the analyses were performed in two sets of 384-well plates and the read-out was performed simultaneously on two FlexMap3D instruments. The read out consisted of the median fluorescent intensity (MFI) and count of number of beads for each antigen (bead ID) in each sample.
Data analysis for bead array data
All data analysis was performed using R [Citation14]. Quality control was performed to exclude antigens and samples not reaching technical criteria, such as sufficient bead count and high signal from the anti-hIgG bead. A total of 859 unique samples were included in the analysis. Continuous median fluorescent intensity units (MFI) of 20–60,000 were transformed into scored data (17 discrete bins) by the following algorithm: f × MAD + median (MAD = median absolute deviation), where f represented different factors between 0 and 70. The data was also transformed into binary data using a stringent cut-off of 50 × MAD above the sample specific median. Fisher’s exact test was applied on the binary data to test for reactivity associations regarding the dichotomized sample groups sex (female or male), age (under 40 years or over 60 years), BMI (lower or upper quantile per cohort), smoking status (never or more than 10 years), alcohol intake (less than twice per month or more than once per week), and self-experienced general health (OK/good or excellent). Multiple testing correction using the FDR-approach was applied.
Autoantibody profiling on high density planar antigen array
High density protein fragment arrays were generated as previously described [Citation6]. The array consists of 28,000 spots representing 14,000 unique protein coding genes by 23,000 different protein fragments produced within the Human Protein Atlas project as described above. Four individual samples were selected based on results from the bead array, and analysed twice on the high-density arrays. Samples were diluted 1:100 in buffer 1. The samples were incubated in buffer 1 for 30 minutes, and then transferred to the arrays. The samples were incubated on the arrays for one hour at room temperature without shaking. After washing in 0.01% PBS-Tween20, the slides were incubated with chicken anti-His6ABP (produced within The Human Protein Atlas Project) for one hour at room temperature on shaker. After washing, goat anti-human IgG (H + L) conjugated with Alexa 647 (Life Technology, A-21445) with dilution 1:15,000 and goat anti-chicken IgY Alexa 555 (Invitrogen, A-21437) with dilution 1:15,000 were used following one hour incubation at room temperature and shaking. After washing, the slides were scanned using a microarray scanner (Agilent G2505C, Agilent Technologies Inc.) at a resolution of 10 µm. The images from the scanner were analysed using GenePix Pro 5.1 image analysis program.
Data analysis for the planar array
The planar array data werefiltered to remove spots that were less than 30 pixels in size or flagged during image analysis. For replicate spots, the mean was calculated if the coefficient of variation was below 20%, otherwise the spot with highest spotting control signal was used. Following filtration, the data was transformed per sample to the number of median absolute deviations (MADs) from the sample median. Signals were classified as reactive based on a stringent cut-off of 100 × MAD of the sample specific baseline binding.
Results
We have applied an antigen array-based approach to characterize autoantibody repertoires in 859 plasma samples. The samples were from 193 healthy individuals from two independent longitudinal cohorts and have been profiled towards 204 different proteins with potential associations with autoimmune disorders. Four samples were subsequently analysed also on a high-density array comprising 23,000 protein fragments representing 14,000 protein coding genes.
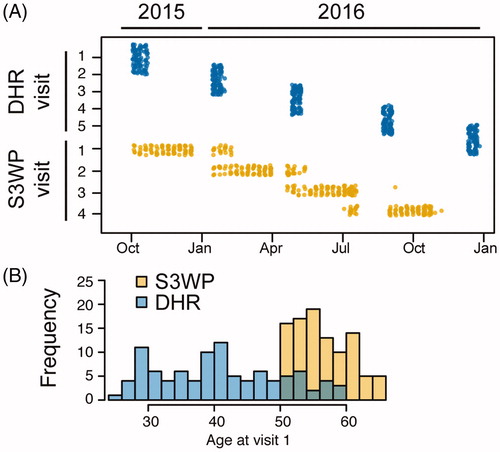
Two independent initiatives to profile healthy individuals were started in October 2015 including longitudinal samplings and monitoring (). Both studies set out to explore the molecular signatures of healthy individuals. The Swedish SCAPIS SciLifeLab Wellness Profiling (S3WP) project enrolled 101 healthy participants of 50–65 years of age. During one year, the subjects were sampled and answered questionnaires at four time points. Meanwhile, the Finnish Digital Health Revolution (DHR) study, conducted at FIMM research center, enrolled 107 healthy participants of 25–59 years of age, for five samplings and questionnaires during a period of 16 months. Examples of clear noted differences between the cohorts are the age span () and the reported exercise level (Supplementary Table 1). In total, samples from 193 subjects fulfilled the initial quality criteria for the arrays. With 4–5 longitudinal samples per subject, a total of 859 samples were analysed.
Figure 1. Two independent approaches for longitudinal sampling of healthy individuals, DHR in Finland and S3WP in Sweden, display differences in sampling strategy (A) as well as age span (B). Top dots correspond to the dates of the five visits of DHR-subjects and bottom dots correspond to the dates of the four visits of S3WP-subjects.
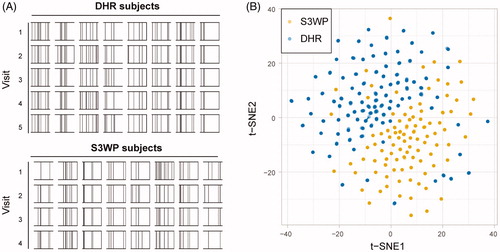
In order to characterize the distribution of normally occurring autoantibody repertoires in relation to disease associated autoantibody reactivity, we selected 204 proteins for this study, all with established or speculated associations with autoimmune disorders (Supplementary Table 2). Three-hundred and thirty-five protein fragments from the Human Protein Atlas were selected to represent the 204 proteins and were coupled to colour coded beads and used to detect the presence of autoreactive IgGs in the subjects’ plasma. The resulting autoantibody profiles demonstrated that the binding of human IgGs to these human antigens were person-specific regarding both the number of antigens and towards which antigens an individual displayed reactivity. When applying a sample specific scoring algorithm, the intensity peaks were transformed into reactivity scores (0.0–1.6). Using a stringent cut-off to classify reactivity, every binding event with a score of at least 1.2, which corresponds to a signal greater than 50 times the median absolute deviation (MAD) above the sample specific background, was classified as reactive. This analytical approach enabled a graphical display of each autoantibody signature as a barcode (). The individual autoantibody binding profile was for most subjects maintained identical across the four or five samples taken over one year. The personal antibody profiles were specific enough to correctly group every sample from the subjects’ four or five visits together in unsupervised clustering algorithms, such as the two-dimensional maps based on t-distributed stochastic neighbour embedding, t-SNE [Citation15] ().
Figure 2. (A) Autoantibody profiles displayed as person specific barcodes show the individuality and stability over time of autoantibody repertoires. (B) The personal autoantibody signature causes the subject’s samples from four or five visits to cluster together when applying a dimensionality reduction of the two datasets combined, using data transformed into 17 discrete reactivity scores.
Some changes in the autoantibody barcode were observed over time. The binary definition of reactivity resulted in 170 subjects whose binding towards antigens were classified as reactive in one sample and unreactive in another (75 in S3WP and 95 in DHR). However, when a stricter definition of autoantibody change was applied (Change > 50 × MAD, and reactive in at least 2 samples), six S3WP and nine DHR subjects displayed antigen binding that occurred during the study. With this strict definition of reactivity change, no autoantibody reactivity was lost in any subject during the timespan of the study. No associated deviations in neither the clinical data nor the lifestyle questionnaires were found for these subjects at the time points of the reactivity occurrences. Two subjects with occurring autoantibody reactivities within the timespan of the study are highlighted in .
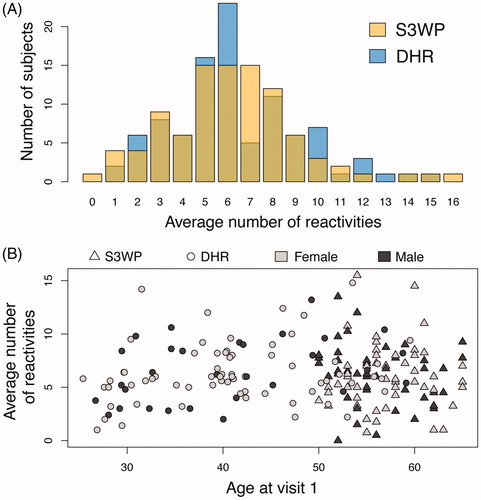
Across all studied subjects, the two investigated cohorts display almost an identical distribution of the total number of reactivities per subject (). On average across all visits, S3WP subjects’ plasma IgG bound 0–16 antigens, with a mean and median of six antigens, while DHR subjects bound to 1–15 antigens, with a mean and median of six as well. The average number of reactivities per subject did not correlate with the age of the participants (), and no significant difference was observed when comparing the number of reactivities between the youngest subjects (<40 years, N = 42) and the oldest subjects (>60 years, N = 22), see Supplementary Figure 1. No significant difference was related to sex (; Supplementary Figure 1). Furthermore, none of the explored individual data (e.g. smoking, alcohol intake, self-experienced general health or BMI), were here found to be associated to differences in total number of reactivities at visit 1 (Supplementary Figure 1). Single antigen reactivities were in some instances associated to individual data, when comparing reactivity frequencies in groups by Fisher’s exact test (Supplementary Figure 2), but with a number of reactive subjects so low that the results were regarded as anecdotal and none were significant after multiple testing correction.
Figure 3. (A) The two independent cohorts reveal almost identical distribution of average number of reactivities per subject across the 335 antigens. (B) No correlation was found between age and sex with the average number of reactivities.
The two subjects from each cohort with the highest number of reactivities displayed IgG binding towards 16 and 15 antigens, respectively, and will be referred to as S3WP-high and DHR-high (). The subjects with the lowest number of reactivities, S3WP-low and DHR-low (), displayed reactivity towards none and one antigen, respectively. To investigate how representative the selected 204 target proteins were for the global autoantibody repertoire, these four subjects were selected for IgG-analysis on a high-density antigen array. An array consisting of 23,000 unique protein fragments, representing 14,000 human protein coding genes, was applied to represent an unbiased representation of antigens. As shown in , all four subjects displayed binding towards 25–62 proteins on this array, when applying a stringent cut-off of 100 × MAD above the sample specific background. Interestingly, out of the classified reactivities, IgG binding towards six antigens were in common between two individuals each (), again highlighting the strong individual variation of autoantibody binding.
Figure 4. Autoantibody binding towards the selected set of 335 human antigens is person specific and stable over repeated sampling over one year. Shown here are the subjects with the highest number of reactivities (A, B), the subjects with the lowest number of reactivities (C, D), and exemplified subjects with reactivities occuring during the timespan of each study (E, F). Antigens that are classified as reactive at any visit are interconnected by dashed lines.
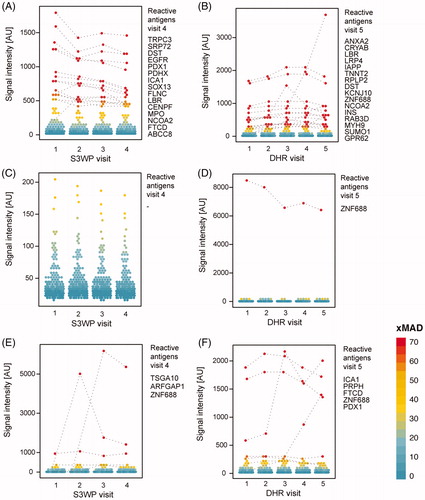
Figure 5. IgG reactivity towards a high density human protein array for visit 1 samples for the four subjects with the highest (A and C) and lowest (B and D) number of reactivities in the targeted array. (E) These four individuals were identified to display approximately similar numbers of reactivities on the high density array when applying a stringent cut-off for reactivity.
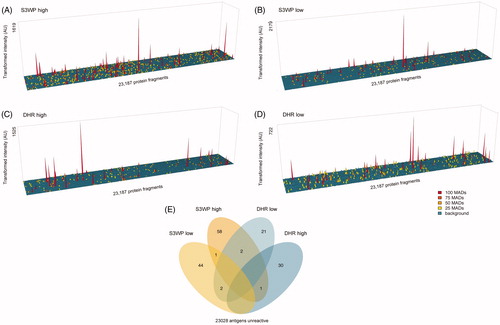
On average in these four individuals, there was binding towards 40 proteins out of 14,000 proteins represented on the array, which equals to a binding frequency of roughly 3‰ of the investigated proteins. On the pre-selected array, consisting of antigens mentioned in the context of autoimmune disorders, binding was observed to in average six antigens per subject, which equals a binding frequency of roughly 3% of the proteins, thus a 10-fold higher frequency in comparison to the high-density approach. It can be noted that the number of classified reactivities depend on the stringency and the algorithm used to set a threshold for reactivity, which in turn is dependent on the sample and array format specific background of IgG binding.
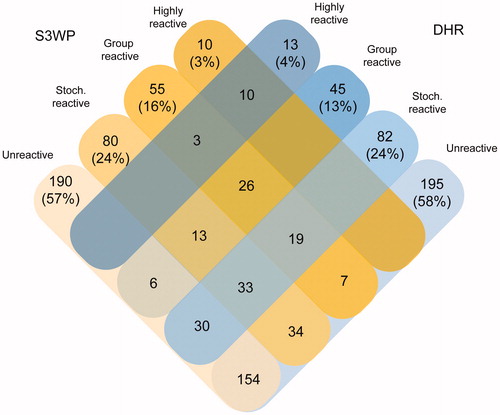
The applied antigens were recombinant protein fragments, representing unique parts of human proteins, spanning in average 80 amino acids and expressed in E. coli. Depending on the average number of subjects over all visits, that displayed IgG-reactivity towards each antigen, the antigens were classified as: unreactive (N = 0 subjects), stochastically reactive (N = 1–2 subjects), group reactive (N = 3–10 subjects) or highly reactive (N > 10 subjects). The distribution of the number of antigens classified into these four groups was almost identical between the two cohorts, here shown for samples from visit 1 (). Ten highly reactive antigens in S3WP were also highly reactive in DHR. The additional three highly reactive antigens in DHR were classified as group reactive in S3WP. The identities of the 80 and 82 antigens that were stochastically reactive in S3WP and DHR, respectively, were divergent in the cohorts. Out of the 80 antigens that were stochastically reactive in S3WP subjects, 33 were also stochastically reactive in DHR, whereas 34 were unreactive and 13 were group reactive. No correlation was found between the degree of IgG reactivity measured here and antigen size nor the respective suggested disease association (data not shown).
Figure 6. Classification of target protein fragments based on data from the S3WP individuals and the DHR individuals. In each cohort, about half of the analysed protein fragments were unreactive. Ten antigens were identified to be highly reactive in both cohorts, whereas three antigens were highly reactive in DHR and group reactive in S3WP.
The antigens with a high reactivity frequency in each cohort (reactive in more than 10 subjects per cohort) were denoted highly reactive antigens and are collected in . As shown in , the highly reactive antigens bind IgG from a range of different subjects. The two most frequently reactive antigens were ZNF688 and ARFGAP1. ZNF688 captured IgG from 58 S3WP and 71 DHR subjects, respectively (), while ARFGAP bound IgG from 36 S3WP and 46 DHR subjects, respectively. TRIM21 (also known as SSA or Ro52), an autoantigen related to Sjögren syndrome but also an Fc-receptor binding protein, shows binding in 10 S3WP and 15 DHR subjects respectively (). KCNJ10 (also known as KIR4.1) which has been suggested to be associated with multiple sclerosis, was here bound by IgG in 10 S3WP and 14 DHR subjects ().
Figure 7. (A) Autoantibody reactivities of 193 individuals (visit 1) towards 13 antigens identified as highly reactive. (B) ZNF688 was discovered as the antigen with IgG binding in the most samples. (C) Reactivity plots for IgG binding to TRIM21, also known as SSA or Ro52. (D) Reactivity plots for IgG-binding to KCNJ10, also known as KIR4.1. The binding fluorescence intensity is plotted for each individual at each time point for the S3WP subjects and the DHR subjects. Data points which were classified as reactive by the stringent cut-off are interconnected by a dashed line connecting data points from the same individual.
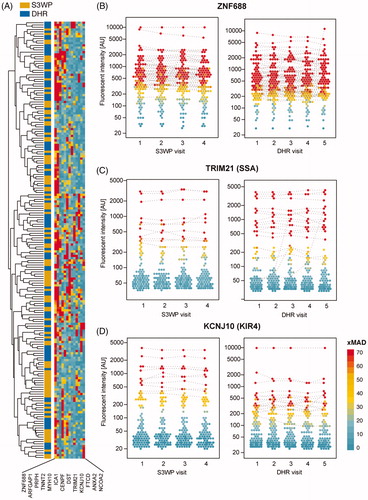
Table 1. Highly reactive antigens.
Notably, the highly reactive antigens were re-cultivated from glycerol stocks, purified and analysed, all in triplicates, to ensure that the binding patterns were related to the human amino acid sequence represented by the fragment and not impurities from the production. All highly reactive antigens were equally reactive in three separate batches of new produced antigen fragments (data not shown).
Discussion
The profiling of the autoreactive IgG antibody repertoire in 193 healthy individuals enabled us to demonstrate the existence of individual specific autoantibody profiles that are maintained over one year’s time. The overall amount of detectable self-reactive IgGs to this selected set of proteins was here, in two independent data sets (S3WP and DHR), not influenced by neither sex nor age. Furthermore, our results demonstrate that the plasma autoantibody profiles represent a unique barcode that could be referred to as an auto-immuno-fingerprint [Citation3].
The biological causes and consequences of the detected autoantibody reactivity in healthy individuals are yet to be fully understood. It has been suggested that the variety of plasma antibodies that could react to self and non-self-antigens regardless of external stimuli are essential components of self-defense in health and disease [Citation1]. Natural autoantibodies are generally found in the blood and have been described as comprising two types of antibodies: i) antigen-induced antibodies with high specificity, and ii) genetically determined antibodies with rather broad specificities [Citation16]. Specific autoantibodies detected in serum might be associated to autoreactive diseases or might be merely part of a naturally occurring stochastic repertoire. There are reports of pre-symptomatic patients displaying serum autoantibodies up to 20 years prior onset of an autoimmune disease, for example, anti-TRIM21 reactivity related to Sjögren syndrome [Citation17] and anti-citrullinated-peptide antibodies (ACPA) related to rheumatoid arthritis [Citation18]. Several studies have shown that healthy individuals have detectable levels of serum autoantibodies which suggests that autoantibody positivity is not necessarily disease associated [Citation19–29]. It remains to be seen if any of the individuals we have investigated herein develop autoimmune diseases.
As for any immunoassay, we observed a continuous gradient from no or low signal intensity to high signal intensity. Clearly, low intensity signals may reflect other biochemical properties of the sample than self-reactive immunoglobulins. We therefore applied a classification based on a stringent sample specific cut-off, to ensure that the defined reactivities were as reliable as possible. The availability herein of repeated samples from the same individuals, with a technical and biological robustness of the measured profiles, strengthened our reliability of the algorithm. Approaches on reactivity classification that are based on the hypothesis that a majority of individuals included in the control group should not display reactivity is often seen. This hypothesis is herein challenged by the identification of antigens with a high reactivity frequency in the population. Since array-based assays have the opportunity to include hundreds or even thousands of antigens, we here decided to make use of an algorithm defining a cut-off based on the sample specific binding profile towards all antigens. Our hypothesis is that every individual should be unreactive towards a majority of the investigated antigens. Using this approach, a subset of antigens was here defined as highly reactive, meaning that more than 10% of the studied individuals had IgG-binding classified as reactive.
For high-reactive antigens, we plan to map the IgG binding to smaller regions, or autoantibody epitopes. This would provide us with the possibility to investigate whether these regions of self-antigens towards which a high proportion of individuals display IgG binding represent or contain sequence or structural similarities to antigens found in specific infectious agents, such as viral or bacterial surface proteins. These approaches are currently pursued in further characterization of the high-reactive antigens we identified here. The two most reactive antigens in this collection were ZNF688 and ARFGAP1. Previous studies in our research group have demonstrated that patients with certain autoimmune disorders have plasma IgG with very high binding intensities to these antigens [Citation11], although a large proportion of control subjects also display binding. The high frequencies of reactive individuals to disease related antigens, such as TRIM21 (also known as SSA or Ro52, related to Sjögren syndrome and SLE), and KCNJ10 (also known as KIR4.1, suggested to be related to multiple sclerosis [Citation29]), are here highlighted as examples of the importance of profiling healthy autoantibody repertoires when studying autoimmune reactivities.
Here, we present autoantibody repertoires of a large number of well-characterised healthy individuals over time. This data highlights the need of personalized baselines as phrased within precision medicine. In a recent review, Burbelo et al. suggested the possibility to perform routine autoantibody mapping using a protein panel that could consist of large numbers of diverse antigens including viral antigens, bacterial, yeast, and fungal proteins, as well as cancer-related antigens, self-antigens and known autoimmune targets [Citation30]. In our approach we aimed at detecting the prevalence of autoantibodies of the IgG type, which are the most abundant immunoglobulins. Some reports claim that autoreactive IgGs act mainly as pathogenic autoantibodies, whilst IgM type autoantibodies are referred to as naturally occurring autoantibodies in healthy individuals [Citation1,Citation31,Citation32]. Nevertheless, to our knowledge, there are no major screening efforts that have been performed to date in order to investigate natural occurring IgM type autoantibodies in healthy individuals over a specific period of time.
When observing IgG reactivities over time, it has been postulated earlier [Citation3,Citation33–35], as well as presented herein, that the overall profile is maintained stable across months to a few years in time. The limited set of individuals and the (immunologically) short time span of our study limit the conclusions on age related autoantibody prevalence. There are, as far as we are aware, no longitudinal studies investigating long-term stability over decades. It has been suggested that the IgG repertoires of healthy individuals are achieved early in life and then remain stable, while reactivities towards bacterial antigens may change depending on age [Citation36]. Previous studies have reported increased positivity associated to age when measuring anti-nuclear antibodies (ANA) in almost 30,000 Chinese individuals [Citation27], indicating an accumulation of B-cell responses, whereas other studies reported the opposite finding [Citation37]. Both of these studies reported an increased frequency of ANA positivity in females compared to males, which is in agreement with the higher prevalence of autoimmune disorders in females and the relation of ANA-positivity and certain autoimmune disorders. A protein array analysis investigating IgG binding towards almost 10,000 proteins claims that the number of reactivities was significantly influenced by age and sex in healthy individuals, using an inclusive cut-off of reactivity [Citation35]. In our presented work, based on a subjective yet stringent classification of reactivity, we did not observe any impact of age nor sex on the antibody profiles. However, the occurring reactivities that we observe are acquired and maintained in subsequent samples, and no reactivity appears to be lost over the study time. If this pattern would extrapolate over time, there are reasons to hypothesize that the self-reactive IgG repertoire is accumulated with age, although in such individual pace that the trend is only observed in population studies of certain size.
Conclusion
In conclusion, healthy individuals display autoantibody binding to self-antigens, which is individual and stable over time. This naturally occurring autoantibody reactivity needs to be taken into account when investigating association of autoantigens with diseases. Discussions on algorithms for selecting un-biased and stringent cut-offs for reactivity are important for the autoimmunity profiling community. With new, improved technologies emerging, broader and deeper autoantibody profiling efforts are possible, which will provide a data-driven basis for further understanding of autoantibodies in health and disease. In this study, we have generated and presented a longitudinal perspective on the distribution of the self-reactive IgG repertoire in healthy individuals.
Supplemental Material
Download MS Word (19.2 KB)Supp_fig_2_-_Single_ags_group_comparisons.pdf
Download PDF (218.4 KB)Supp_fig_1_-_Group_comparisons.tif
Download TIFF Image (644.4 KB)Supp_Table_3_-_High_reactive_antigens.docx
Download MS Word (16.5 KB)Supp_Table_2_-_Antigens.docx
Download MS Word (18.8 KB)Supplementary_Refs.docx
Download MS Word (22.6 KB)Acknowledgements
The skilled technical assistance of Anu Karhu, Josefin Kjelldal and MarieLouise Ekholm are gratefully acknowledged. We acknowledge the assistance of Tea Dodig-Crnkovic and Mun-Gwan Hong at SciLifeLab for support on sample randomization and we thank Ronald Sjöberg for assistance with the high-density arrays. We gratefully thank Jochen Schwenk and the whole S3 wellness profiling team for fruitful discussions and Anna Månberg for valuable comments on the manuscript. We acknowledge the massive efforts of the Human Protein Atlas team for producing the antigens used herein, and especially Anne-Sophie Svensson and Hanna Tegel for re-cultivations of high reactive protein fragments.
Disclosure statement
The authors report no conflicts of interest.
Additional information
Funding
Related Research Data
References
- George J, Gilburd B, Shoenfeld Y. The emerging concept of pathogenic natural autoantibodies. Hum Antibodies. 1997;8:70–75.
- Boyden S. Autoimmunity and Inflammation. Nature. 1964;201:200.
- Francoeur AM. Antibody fingerprinting: A novel method for identifying individual people and animals. Nat Biotechnol. 1988;6:822.
- Uhlén M, Fagerberg L, Hallström BM, et al. Tissue-based map of the human proteome. Science. 2015;347:1260419.
- Thul PJ, Åkesson L, Wiking M, et al. A subcellular map of the human proteome. Science. 2017;356:3321.
- Sjoberg R, Mattsson C, Andersson E, et al. Exploration of high-density protein microarrays for antibody validation and autoimmunity profiling. N Biotechnol. 2016;33:582–592.
- Zandian A, Wingård L, Nilsson H, et al. Untargeted screening for novel autoantibodies with prognostic value in first-episode psychosis. Transl Psychiatry. 2017;7:e1177.
- Zandian A, Forsström B, Häggmark-Månberg A, et al. Whole-proteome peptide microarrays for profiling autoantibody repertoires within multiple sclerosis and narcolepsy. J Proteome Res. 2017;16:1300–1314.
- Häggmark-Månberg A, Zandian A, Forsström B, et al. Autoantibody targets in vaccine-associated narcolepsy. Autoimmunity. 2016;49:421–433.
- Ayoglu B, Mitsios N, Kockum I, et al. Anoctamin 2 identified as an autoimmune target in multiple sclerosis. Proc Natl Acad Sci U S A. 2016;113:2188–2193.
- Häggmark A, Hamsten C, Wiklundh E, et al. Proteomic profiling reveals autoimmune targets in sarcoidosis. Am J Respir Crit Care Med. 2015;191:574–583.
- Ayoglu B, Häggmark A, Khademi M, et al. Autoantibody profiling in multiple sclerosis using arrays of human protein fragments. Mol Cell Proteomics. 2013;12:2657–2672.
- Bergstrom G, Berglund G, Blomberg A, et al. The Swedish CArdioPulmonary BioImage Study: objectives and design. J Intern Med. 2015;278:645–659.
- Team RC. R: a language and environment for statistical computing. Vienna, Austria: R Foundation for Statistical Computing; 2013.
- van der Maaten L, Hinton G. Visualizing data using t-SNE. J Mach Learn Res. 2008;9:2579–2605.
- Avrameas S, Ternynck T. Natural autoantibodies: the other side of the immune system. Res Immunol. 1995;146:235–248.
- Theander E, Jonsson R, Sjöström B, et al. Prediction of Sjögren's syndrome years before diagnosis and identification of patients with early onset and severe disease course by autoantibody profiling. Arthritis Rheumatol. 2015;67:2427–2436.
- Johansson L, Pratesi F, Brink M, et al. Antibodies directed against endogenous and exogenous citrullinated antigens pre-date the onset of rheumatoid arthritis. Arthritis Res Ther. 2016;18:127–127.
- Slight-Webb S, Lu R, Ritterhouse LL, et al. Autoantibody‐positive healthy individuals display unique immune profiles that may regulate autoimmunity. Arthritis Rheumatol. 2016;68:2492–2502.
- Prüßmann J, Prüßmann W, Recke A, et al. Co-occurrence of autoantibodies in healthy blood donors. Exp Dermatol. 2014;23:519–521.
- Young KA, Terrell DR, Guthridge JM, et al. Smoking is not associated with autoantibody production in systemic lupus erythematosus patients, unaffected first-degree relatives, nor healthy controls. Lupus. 2014;23:360–369.
- Madi A, Bransburg-Zabary S, Maayan-Metzger A, et al. Tumor-associated and disease-associated autoantibody repertoires in healthy colostrum and maternal and newborn cord sera. J Immunol. 2015;194:5272–5281.
- Iseme RA, McEvoy M, Kelly B, et al. Autoantibodies are not predictive markers for the development of depressive symptoms in a population-based cohort of older adults. Eur Psychiatry. 2015;30:694–700.
- Piura B, Tauber E, Sarov B, et al. Antinuclear autoantibodies in sera of healthy pregnant women and their offspring. Am J Reprod Immunol Microbiol. 1988;18:116–119.
- Li WH, Zhao J, Li HY, et al. Proteomics-based identification of autoantibodies in the sera of healthy Chinese individuals from Beijing. Proteomics. 2006;6:4781–4789.
- Shapira Y, PoratKatz BS, Gilburd B, et al. Geographical differences in autoantibodies and anti-infectious agents antibodies among healthy adults. Clinic Rev Allerg Immunol. 2012;42:154–163.
- Guo YP, Wang CG, Liu X, et al. The prevalence of antinuclear antibodies in the general population of China: a cross-sectional study. Curr Ther Res. 2014;76:116–119.
- Deshpande P, Lucas M, Brunt S, et al. Low level autoantibodies can be frequently detected in the general Australian population. Pathology. 2016;48:483–490.
- Srivastava R, Aslam M, Kalluri SR, et al. Potassium channel KIR4.1 as an immune target in multiple sclerosis. N Engl J Med. 2012;367:115–123.
- Burbelo PD, Keller JM, Iadarola MJ. Comprehensive antibody profiles as personalized indicators of health and disease. Discov Med 2017;24:161–168.
- Cohen IR, Cooke A. Natural autoantibodies might prevent autoimmune disease. Immunol Today. 1986;7:363–364.
- Elkon K, Casali P. Nature and functions of autoantibodies. Nat Rev Rheumatol. 2008;4:491–498.
- Lacroix-Desmazes S, Kaveri SV, Mouthon L, et al. Self-reactive antibodies (natural autoantibodies) in healthy individuals. J Immunol Methods. 1998;216:117–137.
- Mirilas P, Fesel C, Guilbert B, et al. Natural antibodies in childhood: development, individual stability, and injury effect indicate a contribution to immune memory. J Clin Immunol. 1999;19:109–115.
- Nagele EP, Han M, Acharya NK, et al. Natural IgG autoantibodies are abundant and ubiquitous in human sera, and their number is influenced by age, gender, and disease. PloS One. 2013;8:e60726.
- Lacroix-Desmazes S, Mouthon L, Coutinho A, et al. Analysis of the natural human IgG antibody repertoire: life‐long stability of reactivities towards self antigens contrasts with age‐dependent diversification of reactivities against bacterial antigens. Eur J Immunol. 1995;25:2598–2604.
- Li QZ, Karp DR, Quan J, et al. Risk factors for ANA positivity in healthy persons. Arthritis Res Ther. 2011;13:R38-R38.