
Abstract
Salivary gland involvement is a characteristic feature of primary Sjögren’s syndrome (pSS), where tissue destruction is mediated by infiltrating immune cells, and may be accompanied by the presence of adipose tissue. Optimally diagnosing this multifactorial disease requires the incorporation of additional routines. Screening for disease-specific biomarkers in biological fluid could be a promising approach to increase diagnostic accuracy. We have previously investigated disease biomarkers in saliva and tear fluid of pSS patients, identifying Neutrophil gelatinase-associated lipocalin (NGAL) as the most upregulated protein in pSS. In the current study, we aimed to explore for the first time NGAL expression at the site of inflammation in the pSS disease target organ. Immunohistochemical staining was conducted on minor salivary gland biopsies from 11 pSS patients and 11 non-SS sicca subjects, targeting NGAL-specific cells. Additional NGAL/PNAd double staining was performed to study NGAL expression in high endothelial venules, known as specialised vascular structures. Moreover, NGAL mRNA expression was measured utilising quantitative real-time polymerase chain reaction (qRT-PCR) on minor salivary gland biopsies from 15 pSS patients and 7 non-SS sicca individuals that served as tissue controls. Our results demonstrated NGAL expression in acinar and ductal epithelium within the salivary gland of pSS patients, where significantly greater levels of acinar NGAL were observed in pSS patients (p < .0018) when compared to non-SS subjects. Also, acinar expression positively correlated with focus score values (r 2 = 0.54, p < .02), while ductal epithelial expression showed a negative such correlation (r 2 = 0.74, p < .003). Some PNAD+ endothelial venules also expressed NGAL. An increase in NGAL staining with increased fatty replacement was also observed in pSS patients. Concurringly, a 27% increase in NGAL mRNA levels were also detected in the minor salivary glands of pSS patients when compared to non-SS tissue control subjects. In conclusion, there is a positive association between increase in NGAL expression and inflammation in the pSS disease target organ, which also coincides with its previously demonstrated upregulation in the saliva of pSS patients. Additional functional analyses are needed to better understand the immunological implications of this potential biomarker.
Introduction
In addition to the production of autoantibodies against intracellular proteins Ro/SSA and La/SSB [Citation1–4], the systemic rheumatic autoimmune disorder of primary Sjögren’s syndrome (pSS) is also characterised by inflammation of the exocrine glands [Citation5,Citation6]. The main target organs are the lacrimal and salivary glands, leading to the common sicca symptoms of dry eyes and dry mouth [Citation7]. This inflammatory process eventually results in the replacement of the glandular epithelium by infiltrating mononuclear cells that lead to dysfunction and later destruction of the glands [Citation6,Citation8]. Hence, routine assessment of minor salivary gland tissue has been implemented as part of the diagnostic procedure when evaluating patients for pSS [Citation9,Citation10], and is particularly useful to identify patients with glandular dysfunctions that do not exhibit autoantibody production [Citation11]. Interestingly, salivary gland degeneration is usually coupled with adipose tissue development in pSS [Citation12]. A higher incidence of adipose tissue replacement has been reported in pSS patients, [Citation13] where signalling pathways that promote adipose tissue development, inflammation, and lymphoma have also been identified [Citation14]. Hence, infiltration of adipocytes within the target organ of pSS patients seems to have a proinflammatory function at the site of inflammation, in addition to the infiltrating mononuclear cells.
Considering the current diagnostic procedures available for evaluating pSS, there is an unmet need for the incorporation of non-invasive, more accurate diagnostics. Inspecting the proteome of biological fluids and screening for disease-specific biomarkers [Citation15], utilising liquid chromatography-mass spectrometry (LC-MS) [Citation16,Citation17], has therefore been in focus. Consequently, the analysis of both saliva [Citation15,Citation18–24] and tear fluid [Citation25,Citation26] has led to the identification of potential biomarkers for pSS, such as Neutrophil gelatinase-associated lipocalin (NGAL, also known as LCN2), β-2 microglobulin (B2MG), Lymphocyte-specific protein 1 (LSP1), interleukin-4 (IL-4), IL-5, and Clusterin (CLU) [Citation16,Citation23,Citation27]. We have also screened for disease biomarkers in pSS previously [Citation26,Citation28,Citation29], where NGAL was found to be the most upregulated protein in stimulated whole saliva of pSS patients, and the only upregulated biomarker detected in both saliva and tear fluid of these patients. This iron-binding protein is involved in the innate immune system, and is particularly responsible for the activation of neutrophils, and modulating autoantibody levels in systemic lupus erythematosus [Citation30,Citation31]. NGAL has also been reported to play an active part in systemic vasculitis [Citation32] and ulcerative colitis [Citation33], in addition to suppressing bacterial infection [Citation31,Citation34]. Moreover, NGAL is routinely used as a diagnostic marker in detecting kidney injury [Citation35,Citation36].
To date, NGAL expression has only been investigated in normal human salivary gland tissue and salivary glands with chronic sialadenitis [Citation37]. Hence, given its upregulation in saliva and tear fluid of pSS patients [Citation26], and its inflammatory involvement in other infectious and autoimmune diseases, we wished to further explore the expression pattern of NGAL at the site of inflammation in the pSS disease target organ. By applying immunohistochemistry and quantitative real-time polymerase chain reaction (qRT-PCR) on minor salivary glands from pSS subjects and non-SS sicca controls, in combination with findings from our previous LC-MS analysis [Citation26], we aimed to gain further insight into the immunological involvement of NGAL.
Materials and methods
Study population
A total of 26 patients (22 females, 4 males) were included in the study, recruited at the Department of Oral Surgery and Oral Medicine, University of Oslo, Oslo, Norway. All participants were classified with pSS according to the AECG criteria [Citation38–40]. In addition, 18 female non-SS sicca subjects that were assessed for pSS at the University of Oslo, but did not fulfil the AECG criteria, and had little or no focal inflammation in their salivary gland tissue, served as the non-SS tissue controls. Lower labial minor salivary gland biopsies, taken by one oral and maxillofacial surgeon (JLJ), were obtained from all participants (between the years 2012 and 2019), formalin fixed, and paraffin embedded, followed by staining with haematoxylin and eosin (H&E). The stained tissue sections were then evaluated by one oral pathologist (KS) in order to determine their focus score; defined as the number of focal infiltrates with >50 mononuclear cells per 4mm2 glandular tissue. Further assessment for the presence of germinal centre (GC)-like structures and fatty infiltration (FI) was also conducted on the H&E stained tissue sections. Clinical data and patients’ demographics are presented in (pSS patients) and (non-SS sicca tissue controls). All participating individuals gave their written consent, and the Regional Medical Ethical Committee of South-East Norway (#2010/1292-1, REK2015/363) approved the study.
Table 1. Clinical characteristics of pSS patients included in the study.
Table 2. Clinical characteristics of non-SS sicca subjects included in the study.
Immunohistochemistry
Single staining of NGAL
Formalin fixed, paraffin embedded minor salivary gland biopsies were sectioned using a microtome (4-6 µm). The sections were placed on SuperFrost® Plus microscope slides (Fisher Scientific, Waltham, MA, USA) and incubated overnight at 56 °C. This was followed by deparaffinisation in xylene (Chemi Teknik, Oslo, Norway), and rehydration through a graded ethanol series (100%, 96%, 70%) and TBS (Sigma-Aldrich). The sections were then subjected to epitope retrieval with target retrieval solution (pH 6.0) (Agilent Dako, Carpinteria, CA, USA) using a microwave, at 950 W for 7 min, followed by 350 W for 18 min. Thereafter, the slides were allowed to cool for 20 min, and then washed in water until reaching room temperature (approximately 5 min).
Endogenous peroxidase activity was blocked using Dako Real Peroxidase Blocking solution for 5 min. The primary antibody NGAL (Abcam, Cambridge, UK) was diluted (1:25) in antibody diluent (Agilent Dako), then added to the sections, and incubated for 60 min in a humidified chamber. The specificity of this primary antibody was verified by the manufacturer through western blotting analysis and immunohistochemistry. This was followed by incubation with horseradish peroxidase (HRP)-conjugated BrightVision poly HRP-Anti-Mouse secondary antibody (Immunologic, Amsterdam, the Netherlands) for 30 min. Thereafter, sections were incubated for 10 min with diaminobenzidine (DAB) (Agilent Dako). All incubations were performed at room temperature, and TBS containing 0.1% Tween was used as washing buffer (pH 7.6) between each step for 10 min. Finally, the sections were counterstained with Haematoxylin (Agilent Dako) for 5 min, washed in water for 5 min, then dehydrated through a graded ethanol series (70%, 96%, 100%) and xylene. Finally, sections were mounted under coverslips using pertex (Histolab).
Double-staining of NGAL and PNAd
A double-staining using NGAL (Abcam, Cambridge, UK) was performed alongside PNAd (BD Pharmingen, San Diego, California, USA) to target high endothelial venules. The same procedure was conducted as described above, where inactivation of peroxidase and alkaline phosphatase was conducted using Dako Dual Endogenous Enzyme Block (Agilent Dako). NGAL was used as the first primary antibody (dilution of 1:50), and incubated at 4 °C over night. As a secondary antibody, Goat Anti-Mouse AP (SouthernBiotech, Birmingham, Alabama, USA) was applied for 30 min (dilution 1:100 in Dako antibody diluent). It was then developed using Vulcan fast red chromogen (Biocare, Birmingham, UK) for 15 min, and washed in water for 5 min. Denaturation was then conducted with buffer pH 6, by means of a microwave at 950 W for 3 min, followed by 350 W for 5 min. Inactivation of peroxidases was then achieved by incubating the sections with Dako Real Peroxidase Blocking Solution (Agilent Dako) for 5 min. The sections were further incubated with PNAd (dilution 1:500) for 60 min, followed by the secondary antibody BrightVision poly HRP-Anti-Mouse (Immunologic, Amsterdam, the Netherlands) for 30 min. Vina Green Chromogen (Biocare, Birmingham, UK) was then used to develop the staining. Ultimately, all sections were washed in water for 5 min, counterstained with Haematoxylin (Agilent Dako) for 10 s, dehydrated in an incubator at 56 °C for 20 min, followed by xylene for 2 min, and finally mounted with pertex (Histolab).
Evaluation of staining
The minor salivary gland sections were inspected using a light microscope (Leica, DMLB, Leica Microsystems Wetzlar, Wetzlar). This allowed the detection and quantification of mononuclear cells, located in focal infiltrates and interstitially, i.e. in close proximity to the acinar or ductal epithelium, as part of routine procedure. Furthermore, the salivary gland sections were scored blindly by two investigators in parallel (KS, LAA) for the presence of fatty deposition, in order to deduce the fatty infiltration score (FI score). Numbers 0, 1, or 2 were assigned during assessment of fatty replacement, where 0 was considered negative, 1 was regarded moderate, while 2 represented prominent fatty infiltration.
Moreover, immunohistochemically stained sections were concurrently analysed by two investigators (KS, LAA), and the staining pattern was examined as an entity, and in relation to both focal inflammation and adipose tissue replacement (FI-score) in the glands. Cells were regarded positively stained when approximately 50% or more of the cell membrane was stained. Here, a similar approach was applied to score the stained salivary gland sections for NGAL+ cells, as for FI. In this regard, 0 represented detection of no NGAL+ cells, 1 reflected few to moderate numbers of positively stained cells, and 2 represented prominent numbers of NGAL+ cells. This approach allowed the evaluation and quantification of NGAL staining in the ductal epithelium, and interstitially in the acinar epithelium within the salivary gland of pSS and non-SS subjects.
Quantification of NGAL mRNA in salivary gland tissue
Salivary gland tissue preparation and RNA isolation
Minor labial salivary glands from 15 pSS patients and 7 non-SS tissue controls were used for RNA isolation and qRT-PCR. The fresh glands were placed in RNAlater (Sigma-Aldrich, St Louis, MO) and kept at 4 °C before being frozen at −150 °C. RNeasy Mini kit (Qiagen, Valencia, CA) was used for total RNA extraction, according to the manufacturer’s instructions, and RNA purity and quantification were measured with a NanoDrop spectrophotometer (NanoDrop Technologies Inc., Wilmington, DE).
qRT-PCR
Quantification of mRNA was performed as previously described [Citation41]. In brief, a total of 200 ng RNA was used per 10 µl reverse transcriptase step. Complementary DNA (cDNA) was generated using the Reverse Transcription Core Kit (Eurogentec, Seraing, Belgium), with a mix of reverse transcriptase enzyme, RNAse inhibitor, MgCl, dNTP and 10× buffer. Each cDNA synthesis was performed in a total volume of 30 µl for 10 min at 25 °C, then at 48 °C for 30 min and terminated by incubation for 5 min at 95 °C. Detection of NGAL and glyceraldehyde 3-phosphate dehydrogenase (GAPDH) was carried out using Assay-on-Demand TaqMan Gene Expression Assay (AOD, Applied Biosystems, Foster City, CA). Each qRT- PCR reaction consisted of 1× AOD mix, 1× qPCR Takyon Low Rox Probe MasterMix dTTP Blue (Eurogentec, Seraing, Belgium) and 10 µl cDNA (diluted 1:2.5 µl with H2O) as the template. qRT- PCR reactions were performed in a 96-wells PCR reaction plate on AriaMx Real-Time PCR System (Agilent Technologies, Santa Clara, CA) for 40 cycles (95 °C for 15 s and 60 °C for 1 min) after an initial 10 min incubation at 95 °C. The data were normalised to GAPDH as endogenous control, and a Non-Template Control (NTC) was included for each run to validate the assay. For each experiment every individual sample was run in duplicates. The relative amount of NGAL mRNA was standardised to that of GAPDH mRNA using ΔCq = [Cq (target gene) − Cq (reference gene)] and displayed as 2(−Δ Cq ).
Proteomic analysis of saliva
Stimulated whole saliva was formerly collected from another cohort of 27 pSS patients and 32 healthy controls by chewing on a paraffin block (Paraffin Pellets, Ivoclar Vivadent, Shawn, Lichtenstein, Germany) for 5 min. This was followed by proteomic analysis, conducted in a previous study (Supplementary file 1) [Citation26]. In brief, in-solution protein digestion was conducted, followed by LC-MS using an Ultimate 3000 RSLCnano-UHPLC system connected to a Q Exactive mass spectrometer (Thermo Fisher Scientific, Bremen, Germany). Scaffold (version Scaffold_4.4, Proteome Software Inc., Portland, OR, USA) was then applied to allow the validation of the MS/MS-based peptide and protein identifications. Spectral counts were thus provided for each protein (Supplementary file 1), and the most upregulated protein found in stimulated whole saliva of these patients, namely NGAL, was identified based on our former proteomics data analysis [Citation26].
Statistical analysis
The Mann-Whitney U-test was used for comparing two groups (non-normal distribution of values). The Spearman non-parametric correlation test was used to examine correlation between parameters. All calculations were performed using Prism 8 (GraphPad). A p-value <.05 was considered statistically significant.
Results
Expression of NGAL in the salivary gland tissue of pSS patients correlates with inflammation
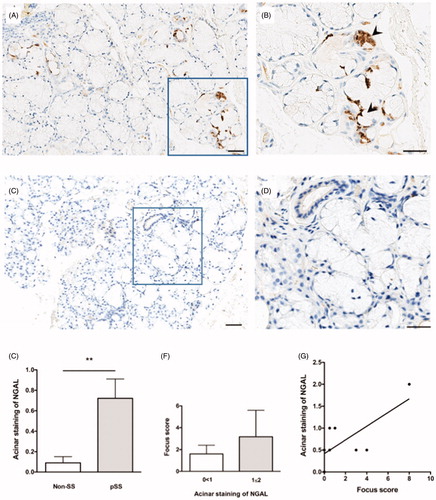
Cells expressing NGAL were detected in the acinar epithelium of pSS patients (), while little to no staining was observed in the non-SS subjects (). A quantification of NGAL staining revealed significantly greater NGAL expression in the acini of pSS patients as compared to non-SS sicca subjects (p < .0018) (). Furthermore, an increase in degree of acinar staining with increasing focus score was also observed in patients with pSS (), where a positive correlation between acinar NGAL staining and focus score was also identified (r 2 = 0.54, p < .02) (). No striking difference was observed in the non-SS sicca group with regard to acinar staining and focus score (data not shown).
Figure 1. NGAL expression in the acinar epithelium of salivary glands from patients with pSS. (A) NGAL (brown) is detected in acinar epithelium within the salivary glands of pSS patients. (B) A magnified representation of (A), where the arrowheads indicate NGAL staining of the acinar epithelium. (C) Little to no NGAL staining was observed in the non-SS subjects. (D) A magnified representation of (C). E) A quantification of NGAL staining within the salivary gland tissue reveals significantly greater NGAL expression in the acini of pSS patients as compared to non-SS sicca subjects (p < .0018). (F) Increase in degree of acinar NGAL staining with increasing focus score in patients with pSS. (G) Positive correlation between acinar NGAL staining and focus score in pSS patients (p < .02, r 2 = 0.54).
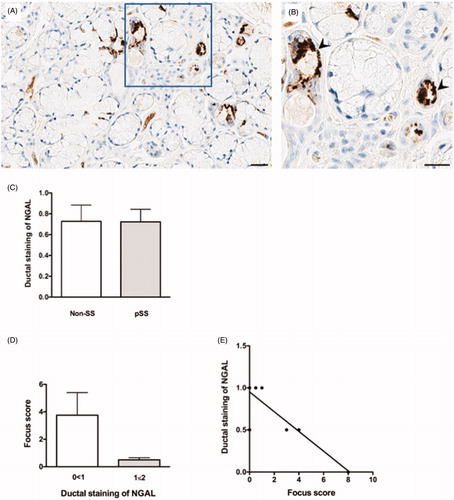
Interestingly, NGAL+ cells were also detected in the ductal epithelium within the pSS target organ (), with similar levels of NGAL expression in the ductal epithelium of pSS patients as compared to non-SS sicca subjects (). However, contrary to the expression pattern in acinar epithelium, a decrease in degree of ductal staining was detected in pSS patients with increasing focus score (), resulting in a negative correlation between ductal NGAL staining and focus score in these patients (r 2 = 0.74, p < .003) (). Meanwhile, no noteworthy difference was observed in the non-SS sicca group with regard to ductal NGAL staining and focus score (data not shown).
Figure 2. NGAL expression in the ductal epithelium of salivary glands from patients with pSS. (A) NGAL (brown) is detected in ductal epithelium within the salivary glands of pSS patients. (B) A magnified representation of (A), where the arrowheads indicate NGAL staining of the ductal epithelium. (C) A quantification of NGAL staining within the salivary gland tissue shows similar levels of NGAL expression in the ductal epithelium of pSS patients as compared to non-SS sicca subjects. (D) Decrease in degree of ductal NGAL staining with increasing focus score in patients with pSS. E) Negative correlation between ductal NGAL staining and focus score in pSS patients (p < .003, r 2 = −0.74).
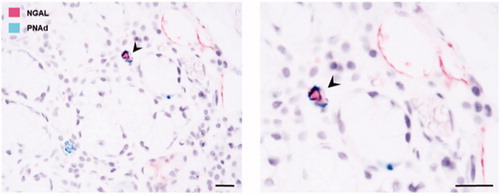
Moreover, NGAL staining was also expressed in some blood vessels in the salivary gland tissue. To confirm whether NGAL was indeed binding to specialised vascular structures known as high endothelial venules, double immunohistochemical staining was performed utilising NGAL in combination with PNAd for the detection of high endothelial venules. Some double-positive blood vessels expressing both NGAL and PNAd were thus detected within the target organ of pSS patients ().
Figure 3. NGAL expression in the blood vessels of salivary glands from patients with pSS. Double immunohistochemical staining utilising NGAL (pink) and PNAd (green); for the detection of high endothelial venules, confirms NGAL expression in some of the blood vessels within the pSS target organ. The arrowheads indicate a double-positive blood vessel expressing both NGAL and PNAd.
NGAL detection in areas of close proximity to adipose tissue within the target organ of pSS patients
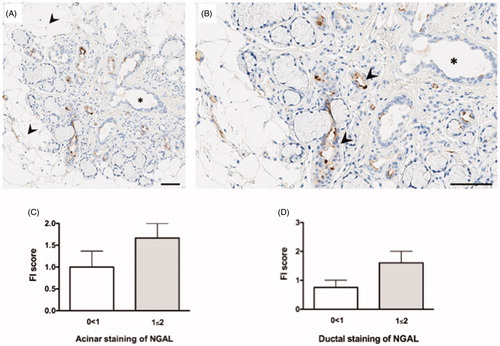
Through immunohistochemical detection of NGAL+ cells in the pSS target organ, we were able to study the expression pattern of NGAL in relation to fatty replacement. Indeed, NGAL+ cells were detected in close proximity to adipose tissue within the salivary glands of pSS patients (). An increase in both acinar and ductal NGAL staining was observed with increasing FI score in pSS patients (). No notable differences were observed in the non-SS sicca group with regard to FI score and NGAL expression (data not shown).
Figure 4. NGAL expression in relation to fatty infiltration. (A) NGAL (brown) is expressed in close proximity to adipose tissue in the salivary glands of pSS patients, where the arrowheads indicate areas of fatty infiltration. (B) A magnified representation of (A), where the arrowheads pinpoint NGAL stained areas in close proximity to the adipocytes. (C) Increase in NGAL acinar staining with increasing FI score in pSS subjects. (D) Increase in NGAL ductal staining with increasing FI score in patients with pSS.
Enhanced NGAL mRNA expression in the salivary glands of pSS patients
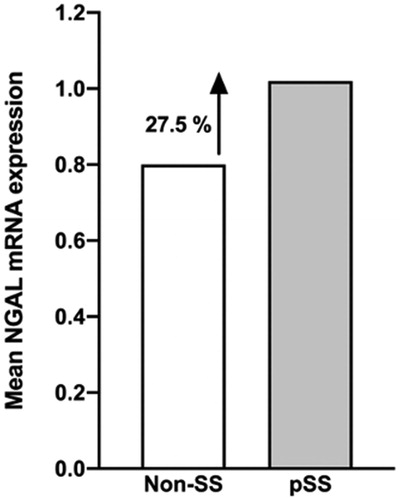
In order to verify the detection and increase of NGAL+ cells in the salivary gland tissue of pSS patients, as compared to non-SS sicca controls, qRT-PCR was conducted. The median of 2−(Δ Ct ) was calculated and presented in 10−4, where ΔCt = Ct (NGAL) – Ct (GAPDH). Our result indicated a 27.5% increase in NGAL (pSS 1.02, non-SS 0.82; p < .8) mRNA levels in the salivary glands of pSS patients when compared to non-SS tissue controls ().
Figure 5. Expression of NGAL mRNA in salivary gland tissue using qRT-PCR. Enhanced NGAL mRNA expression is observed in the salivary glands of pSS patients, as compared to non-SS sicca subjects, with a 27.5% increase in the patient group (pSS 1.02, non-SS 0.82; p < .8). The mean of 2−(Δ Ct ) was calculated and presented in 10−4, where ΔCt = Ct (NGAL) – Ct (GAPDH).
Overexpression of NGAL in the saliva of pSS patients analysed by LC-MS
We have previously conducted a proteomic analysis on stimulated whole saliva collected from a different cohort of pSS patients and healthy controls (Supplementary file 1) [Citation26]. Our former analysis revealed that the most upregulated protein identified in stimulated whole saliva of pSS patients was indeed NGAL. In the current study, we graphically illustrate for the first time the spectral counts measured in the saliva of each of those participants from our previous study, hence providing a visual representation of NGAL abundance, where significantly greater amounts of NGAL protein were observed in the pSS patients as compared to healthy controls ().
Figure 6. Detection and quantification of NGAL protein in the saliva of pSS patients through LC-MS analysis. A previous detection and quantification of proteins in stimulated whole saliva through LC-MS analysis [Citation26] revealed that NGAL protein is the most upregulated protein in saliva of pSS patients with the highest amount of proteins expressed, as compared to healthy controls. Illustrated above for the first time are the spectral counts measured in the saliva (purple) of each participant, representing NGAL abundance, where significantly greater amounts of NGAL protein are observed in the pSS patients.
![Figure 6. Detection and quantification of NGAL protein in the saliva of pSS patients through LC-MS analysis. A previous detection and quantification of proteins in stimulated whole saliva through LC-MS analysis [Citation26] revealed that NGAL protein is the most upregulated protein in saliva of pSS patients with the highest amount of proteins expressed, as compared to healthy controls. Illustrated above for the first time are the spectral counts measured in the saliva (purple) of each participant, representing NGAL abundance, where significantly greater amounts of NGAL protein are observed in the pSS patients.](/cms/asset/d9d572fa-4fa3-4d71-aceb-3fbf8e767424/iaut_a_1795140_f0006_c.jpg)
Discussion
Delineating the development of a complex and heterogeneous disease such as pSS has indeed proven challenging over the years. As salivary gland involvement plays an essential role in disease progression and pathogenesis, increasing diagnostic accuracy in pSS by searching for potential biomarkers through LC-MS approaches should also be accompanied by investigating and understanding the expression of such biomarkers at the site of inflammation in the pSS disease target organ. We have previously identified potential novel disease biomarkers in saliva and tear fluid of pSS patients [Citation26,Citation28], where NGAL was the most upregulated protein in stimulated whole saliva of pSS patients, and the only biomarker that was upregulated in both saliva and tear fluid of pSS patients when compared to healthy controls, making it an ideal candidate for further investigation. Thus far, the expression of NGAL has only been explored in normal human salivary gland tissue and salivary glands with chronic sialadenitis [Citation37]. In the current study, we aimed to explore the expression pattern of NGAL in minor salivary gland biopsies from pSS subjects and non-SS sicca controls. Together, our findings could aid in providing further insight into pSS pathogenesis, diagnostic accuracy, and may also contribute to tailoring current therapeutic strategies [Citation42,Citation43].
We have shown cells expressing NGAL in the acinar epithelium and ductal epithelium within the salivary glands of pSS patients. However, an interpretation of NGAL staining revealed significantly greater NGAL+ cells in the acini of pSS patients as compared to non-SS sicca subjects, while similar levels of NGAL expression was observed in the ductal epithelium of pSS patients and non-SS sicca tissue controls. Moreover, an increase in degree of acinar NGAL staining was found in pSS patients with increasing focus score, with a contrasting decrease in degree of ductal NGAL staining as focus score values increase. This positive correlation of NGAL expression with inflammation in the acinar epithelium of pSS salivary gland tissue, and negative association with expression in the ductal epithelium, could be the result of the cellular functions of this protein. Since NGAL is also involved in regulating neutrophils and supressing infection [Citation36], and could play a part in the initial phases of disease and innate immunity [Citation30], one would therefore suspect it to be expressed at early stages of disease development, as pathogenic inflammation targets the salivary glands, and also interstitially [Citation44]. However, further functional studies are needed to verify the functional role of NGAL in relation to neutrophil expression in pSS.
Interestingly, NGAL was expressed on some endothelial cells in the glandular tissue, as confirmed by our double immunohistochemical staining of PNAd and NGAL. The formation of these high endothelial venules has previously been shown at the site of inflammation in pSS, where they facilitated migration of immune cells into the lymphoid organs by binding certain chemokines [Citation45]. Hence, NGAL expression in some of these high endothelial venules identified in our current analysis may indicate a regulatory role of navigating the immune cells into the glandular tissue [Citation45]. Additionally, the detection of NGAL+ cells in close proximity to adipose tissue within the salivary glands of pSS patients is a further indication of NGAL involvement in the inflammatory process, as shown by the increase in NGAL+ cells with increasing FI score in these patients.
The overexpression of NGAL+ cells in the salivary glands of pSS patients coincides with increased NGAL mRNA expression. Moreover, enhanced NGAL detection in the pSS disease target organ corresponds with its upregulation in the saliva and tear fluid of pSS patients, as shown by our previous LC-MS analyses [Citation26,Citation28,Citation29]. In the current study, we illustrated for the first time a representation of NGAL abundance where the spectral counts measured in the saliva of each participant revealed significantly greater amounts of NGAL protein in the pSS patients as compared to healthy controls. This strengthens the notion of involvement and over-activation of the innate immune system in pSS through the upregulation of NGAL and other pro-inflammatory related proteins in the pSS patients to form protein-protein network interactions.
Conclusions
By applying immunohistochemistry and qRT-PCR on minor salivary glands from pSS patients and non-SS sicca subjects, in combination with previous outcomes from our LC-MS analysis on saliva [Citation26], we have now gained further insight into the expression pattern of NGAL. Our results indicated a positive association between increase in NGAL+ cells in the pSS disease target organ and inflammation, particularly in the acinar epithelium, as supported by increased NGAL mRNA levels in the patients. This also coincides with the previously detected upregulation of NGAL in the saliva of pSS patients. Accordingly, additional functional analyses are needed to better understand the immunological implications of this potential biomarker.
Aqrawi_et_al-2017.pdf
Download PDF (2.4 MB)Acknowledgements
We express our gratitude to the subjects that have participated in the study, members of the Dry Mouth Clinic for assisting with saliva sample collection, and members of the proteomic facility at Oslo Science Park for performing the proteomic analysis. Furthermore, we appreciatively acknowledge Ann-Kristin Ruus for excellent technical assistance with the qRT-PCR analysis. The study was supported by the Faculty of Dentistry at the University of Oslo, the Faculty of Medicine at the University of Bergen, and Western Norway Regional Health Authority.
Disclosure statement
No potential conflict of interest was reported by the author(s).
References
- Franceschini F , Cavazzana I. Anti-Ro/SSA and La/SSB antibodies. Autoimmunity. 2005;38(1):55–63.
- Volchenkov R , Jonsson R , Appel S. Anti-Ro and anti-La autoantibody profiling in Norwegian patients with primary Sjögren’s syndrome using luciferase immunoprecipitation systems (LIPS)). Scand J Rheumatol. 2012;41(4):314–315.
- Gordon TP , Bolstad AI , Rischmueller M , et al. Autoantibodies in primary Sjögren’s syndrome: new insights into mechanisms of autoantibody diversification and disease pathogenesis. Autoimmunity. 2001;34(2):123–132.
- Aqrawi LA , Skarstein K , Oijordsbakken G , et al. Ro52- and Ro60-specific B cell pattern in the salivary glands of patients with primary Sjögren’s syndrome. Clin Exp Immunol. 2013;172(2):228–237.
- Jonsson R , Bolstad AI , Brokstad KA , et al. Sjögren’s syndrome-a plethora of clinical and immunological phenotypes with a complex genetic background. Ann N Y Acad Sci. 2007;1108:433–447.
- Jonsson R , Vogelsang P , Volchenkov R , et al. The complexity of Sjögren’s syndrome: novel aspects on pathogenesis. Immunol Lett. 2011;141(1):1–9.
- Ramos-Casals M , Brito-Zeron P , Siso-Almirall A , et al. Topical and systemic medications for the treatment of primary Sjögren’s syndrome. Nat Rev Rheumatol. 2012;8(7):399–411.
- Pullerits R , Jonsson IM , Verdrengh M , et al. High mobility group box chromosomal protein 1, a DNA binding cytokine, induces arthritis. Arthritis Rheum. 2003;48(6):1693–1700.
- Chisholm DM , Mason DK. Labial salivary gland biopsy in Sjögren’s disease. J Clin Pathol. 1968;21(5):656–660.
- Daniels TE , Whitcher JP. Association of patterns of labial salivary gland inflammation with keratoconjunctivitis sicca. Analysis of 618 patients with suspected Sjogren’s syndrome. Arthritis Rheum. 1994;37(6):869–877.
- Giovelli RA , Santos MC , Serrano EV , et al. Clinical characteristics and biopsy accuracy in suspected cases of Sjögren’s syndrome referred to labial salivary gland biopsy. BMC Musculoskelet Disord. 2015;16:30
- Skopouli FN , Li L , Boumba D , et al. Association of mast cells with fibrosis and fatty infiltration in the minor salivary glands of patients with Sjogren’s syndrome. Clin Exp Rheumatol. 1998;16:63–65.
- Skarstein K , Aqrawi LA , Oijordsbakken G , et al. Adipose tissue is prominent in salivary glands of Sjögren’s syndrome patients and appears to influence the microenvironment in these organs. Autoimmunity. 2016;49(5):338–346.
- Aqrawi LA , Jensen JL , Oijordsbakken G , et al. Signalling pathways identified in salivary glands from primary Sjögren’s syndrome patients reveal enhanced adipose tissue development. Autoimmunity. 2018;51(3):135–146.
- Giusti L , Baldini C , Bazzichi L , et al. Proteome analysis of whole saliva: a new tool for rheumatic diseases-the example of Sjögren’s syndrome. Proteomics. 2007;7(10):1634–1643.
- Baldini C , Giusti L , Ciregia F , et al. Proteomic analysis of saliva: a unique tool to distinguish primary Sjögren’s syndrome from secondary Sjögren’s syndrome and other sicca syndromes. Arthritis Res Ther. 2011;13(6):R194.
- Giusti L , Baldini C , Bazzichi L , et al. Proteomic diagnosis of Sjögren’s syndrome. Expert Rev Proteomics. 2007;4(6):757–767.
- Ryu OH , Atkinson JC , Hoehn GT , et al. Identification of parotid salivary biomarkers in Sjogren’s syndrome by surface-enhanced laser desorption/ionization time-of-flight mass spectrometry and two-dimensional difference gel electrophoresis. Rheumatology (Oxford). 2006;45(9):1077–1086.
- Peluso G , De Santis M , Inzitari R , et al. Proteomic study of salivary peptides and proteins in patients with Sjögren’s syndrome before and after pilocarpine treatment. Arthritis Rheum. 2007;56(7):2216–2222.
- Hu S , Wang J , Meijer J , et al. Salivary proteomic and genomic biomarkers for primary Sjogren’s syndrome. Arthritis Rheum. 2007;56(11):3588–3600.
- Hu S , Vissink A , Arellano M , et al. Identification of autoantibody biomarkers for primary Sjögren’s syndrome using protein microarrays. Proteomics. 2011;11(8):1499–1507.
- Fleissig Y , Deutsch O , Reichenberg E , et al. Different proteomic protein patterns in saliva of Sjögren’s syndrome patients. Oral Dis. 2009;15(1):61–68.
- Delaleu N , Mydel P , Kwee I , et al. High fidelity between saliva proteomics and the biologic state of salivary glands defines biomarker signatures for primary Sjögren’s syndrome. Arthritis & Rheumatology. 2015;67(4):1084–1095.
- Denny P , Hagen FK , Hardt M , et al. The proteomes of human parotid and submandibular/sublingual gland salivas collected as the ductal secretions. J Proteome Res. 2008;7(5):1994–2006.
- Tomosugi N , Kitagawa K , Takahashi N , et al. Diagnostic potential of tear proteomic patterns in Sjögren’s syndrome. J Proteome Res. 2005;4(3):820–825.
- Aqrawi LA , Galtung HK , Vestad B , et al. Identification of potential saliva and tear biomarkers in primary Sjogren’s syndrome, utilising the extraction of extracellular vesicles and proteomics analysis. Arthritis Res Ther. 2017;19(1):14.
- Ambatipudi KS , Swatkoski S , Moresco JJ , et al. Quantitative proteomics of parotid saliva in primary Sjögren’s syndrome. Proteomics. 2012;12(19–20):3113–3120.
- Aqrawi LA , Chen X , Jensen JL , et al. Severity of clinical dry eye manifestations influences protein expression in tear fluid of patients with primary Sjogren’s syndrome. PloS One. 2018;13(10):e0205762.
- Aqrawi LA , Galtung HK , Guerreiro EM , et al. Proteomic and histopathological characterisation of sicca subjects and primary Sjogren’s syndrome patients reveals promising tear, saliva and extracellular vesicle disease biomarkers. Arthritis Res. Ther. 2019;21(1):181.
- Pawar RD , Goilav B , Xia Y , et al. Serum autoantibodies in pristane induced lupus are regulated by neutrophil gelatinase associated lipocalin. Clin Immunol. 2014;154(1):49–65.
- Li H , Feng D , Cai Y , et al. Hepatocytes and neutrophils cooperatively suppress bacterial infection by differentially regulating lipocalin-2 and neutrophil extracellular traps. Hepatology. 2018;68(4):1604–1620.
- Ohlsson S , Wieslander J , Segelmark M. Increased circulating levels of proteinase 3 in patients with anti-neutrophilic cytoplasmic autoantibodies-associated systemic vasculitis in remission. Clin Exp Immunol. 2003;131(3):528–535.
- Muthas D , Reznichenko A , Balendran CA , et al. Neutrophils in ulcerative colitis: a review of selected biomarkers and their potential therapeutic implications. Scand J Gastroenterol. 2017;52(2):125–135.
- Jonsson N , Gille-Johnson P , Martling CR , et al. Performance of plasma measurement of neutrophil gelatinase-associated lipocalin as a biomarker of bacterial infections in the intensive care unit. J Crit Care. 2019;53:264–270.
- Da Y , Akalya K , Murali T , et al. Serial quantification of urinary protein biomarkers to predict drug-induced acute kidney injury. CDM. 2019;20(8):656–664.
- Marko L , Park JK , Henke N , et al. B-cell lymphoma/leukemia 10 (Bcl10) and angiotensin II-induced kidney injury. Cardiovasc Res. 2019.
- Woo JS , Kim KM , Kang JS , et al. Expression of neutrophil gelatinase-associated lipocalin in human salivary glands. The Annals of otology . Ann. Otol. Rhinol. Laryngol. 2007;116(8):599–603.
- Vitali C , Bombardieri S , Jonsson R , et al. Classification criteria for Sjögren’s syndrome: a revised version of the European criteria proposed by the American-European Consensus Group . Ann Rheum Dis. 2002;61(6):554–558.
- Rasmussen A , Ice JA , Li H , et al. Comparison of the American-European Consensus Group Sjogren’s syndrome classification criteria to newly proposed American College of Rheumatology criteria in a large, carefully characterised sicca cohort. Ann Rheum Dis. 2014;73(1):31–38.
- Shiboski SC , Shiboski CH , Criswell L , et al. American College of Rheumatology classification criteria for Sjogren’s syndrome: a data-driven, expert consensus approach in the Sjogren’s International Collaborative Clinical Alliance cohort. Arthritis Care Res. 2012;64(4):475–487.
- Enger TB , Aure MH , Jensen JL , et al. Calcium signaling and cell volume regulation are altered in Sjögren’s Syndrome. Acta Odontol Scand. 2014;72(7):549–556.
- Isaksen K , Jonsson R , Omdal R. Anti-CD20 treatment in primary Sjögren’s syndrome. Scand J Immunol. 2008;68(6):554–564.
- Cornec D , Devauchelle-Pensec V , Tobon GJ , et al. B cells in Sjögren’s syndrome: from pathophysiology to diagnosis and treatment. J Autoimmun. 2012;39(3):161–167.
- Nicaise C , Weichselbaum L , Schandene L , et al. Phagocyte-specific S100A8/A9 is upregulated in primary Sjogren’s syndrome and triggers the secretion of pro-inflammatory cytokines in vitro. Clin Exp Rheumatol. 2017;35:129–136.
- Szyszko EA , Brokstad KA , Oijordsbakken G , et al. Salivary glands of primary Sjögren’s syndrome patients express factors vital for plasma cell survival. Arthritis Res Ther. 2011;13(1):R2.