
Abstract
Background
Oesophageal squamous cell carcinoma (ESCC) is a malignant tumour of the digestive system that is associated with high morbidity and mortality rates worldwide. With the increased use of immunotherapy in cancer treatment, there is an urgent need to elucidate the immune-related mechanisms in ESCC and other digestive system carcinomas.
Methods
In our study, single-sample gene set enrichment analysis (ssGSEA) was first performed to analyse the expression profile downloaded from the NCBI Gene Expression Omnibus (GEO) database. Then, via a series of bioinformatic analyses, including the Mann-Whitney test, weighted gene co-expression network analysis (WGCNA), functional enrichment analysis and differentially expressed genes (DEGs) analysis, we identified target immunocytes and related genes. Finally, we validated the results with the TIMER database.
Results
Our analyses showed that the numbers of infiltrating macrophages were obviously higher in advanced stages in ESCC compared with other types of immunocytes. MEOX2 was identified as a biomarker correlated with macrophage infiltration in ESCC and other types of digestive system carcinomas. And MEOX2 expression was strongly associated with the mRNA expression of colony-stimulating factor 1 (CSF-1) and CSF-1 receptor (CSF-1R) in these kinds of carcinomas.
Conclusion
We speculated that MEOX2 could facilitate macrophage infiltration via CSF-1/CSF-1R signalling in ESCC and other kinds of digestive system carcinomas, and MEOX2 might serve as a novel target in prospective tumour immunotherapies.
Background
As a common malignant tumour of the upper digestive tract, oesophageal carcinoma (EC) is the sixth most common cause of cancer-related death around the world, and accounting for 509,000 cancer-related deaths each year [Citation1]. Oesophageal carcinoma is composed of two main histological types, oesophageal adenocarcinoma (EAC) and oesophageal squamous cell carcinoma (ESCC); of these types, oesophageal squamous-cell carcinoma accounts for approximately 90% of cases worldwide [Citation2]. Although numerous breakthroughs have been achieved in the diagnosis, screening, surgical resection and chemoradiotherapy of ESCC, the prognosis of patients with ESCC remains unsatisfactory [Citation3]. Currently, immunotherapy has gradually become a hot topic in oncology treatment, and its application in melanoma, pulmonary carcinoma and many other malignancies has been proven to be very successful [Citation4,Citation5]. However, the use of immunotherapy in ESCC treatment remains limited due to the absence of reliable biomarkers related to immunocyte infiltration into the tumour microenvironment (TME) of ESCC. Therefore, there is an urgent need to identify novel biomarkers of immune interactions with ESCC as well as new targets for immune-related therapy.
Previous studies have reported some of the characteristics of the immune microenvironment of ESCC. Oesophageal carcinoma is considered to have an adequate mutation load for checkpoint inhibitor treatment, which opens up possibilities for immunotherapy in the treatment of this disease [Citation6]. Schumacher et al. found that CD8(+) T cell infiltration in oesophageal carcinomas was a favourable prognostic factor and had potential therapeutic value [Citation7]. Nishimura et al. showed that increased numbers of mature LAMP-3 (lysosome-associated membrane glycoprotein 3) DCs (dendritic cells) were correlated with increased infiltration of CD8(+) T cells in ESCC and that these DCs were associated with a better prognosis [Citation8].
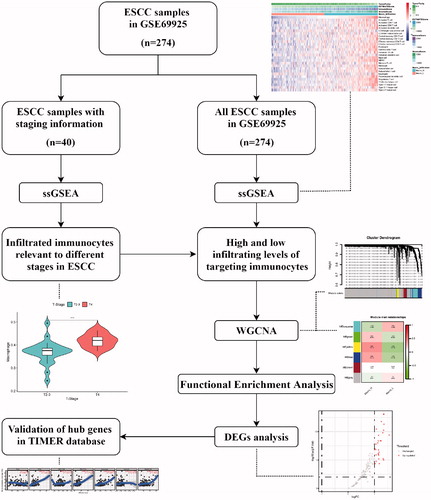
However, considering the complicated factors implicated in the regulation of tumour immunity, more studies are required to complete the immune atlas of ESCC. Currently, with the development of bioinformatics, a great deal of public data containing gene expression and clinicopathological information can be utilized to explore the tumour microenvironment of ESCC. Therefore, on the basis of public data and bioinformatic analyses, our study aimed to explore the association between infiltrating immunocytes and clinicopathological characteristics, and to detect novel immune-related genes. In this study, via single-sample gene set enrichment analysis (ssGSEA), weighted gene co-expression network analysis (WGCNA), differentially expressed genes analysis (DEGs) and online database analysis, we identified a novel biomarker associated with immunocyte infiltration in ESCC. The detailed workflow is shown in .
Figure 1. The detailed workflow of this study. ESCC, oesophageal squamous cell carcinoma. ssGSEA, single-sample gene set enrichment analysis. WGCNA: weighted gene co-expression network analysis; DEGs: differentially expressed genes.
Materials and methods
Data collection and preprocessing
The gene expression profile of GSE69925 from the NCBI Gene Expression Omnibus (GEO) database was searched with “oesophageal squamous cell cancer” and “Homo sapiens” as keywords. GSE69925 includes 274 ESCC biopsy specimens, which were processed by Affymetrix Gene Chip HG-U133Plus2.0 to obtain comprehensive gene expression profiling [Citation9]. Of all the 274 samples, 40 samples contain tumour staging information (3 samples of stage T2, 21 samples of stage T3 and 16 samples of stage T4).
The probes in this series were annotated by gene symbol information from soft formatted family files, the probe annotated by multiple genes was deleted, and the average value was recorded as the final expression value for the gene matched to multiple probes.
Implementation of Single-Sample gene set enrichment analysis (ssGSEA)
Immune-related gene sets were obtained from the Cancer Immunome database (TCIA) [Citation10]. The data from TCIA contains 28 immunocyte-related gene sets, including gene sets related to innate and adaptive immunity. The innate immune system includes activated dendritic cells, immature dendritic cells, plasmacytoid dendritic cells, CD56dim natural killer cells, CD56bright natural killer cells, eosinophils, mast cells, macrophages, MDSCs, monocytes, natural killer cells, natural killer T cells and neutrophils. The adaptive immune system includes activated CD4 T cells, activated CD8 T cells, central memory CD4 T cells, central memory CD8 T cells, effector memory CD4 T cells, effector memory CD8 T cells, gamma delta T cells, activated B cells, immature B cells, memory B cells, T follicular helper cells, regulatory T cells, type 1 T helper cells, type 2 T helper cells and type 17 T helper cells.
The levels of infiltration related to 28 types of immunocytes were quantified by the ssGSEA algorithm in R package GSVA, which could apply gene signatures of immunocytes to every cancer sample [Citation11]. Then, the R package ESTIMATE was utilized to calculate the immune score, the stromal score, and tumour purity and to estimate the score of every tumour sample [Citation12].
Identification of differentially infiltrated immunocytes in different stages
Based on the T stages of samples with tumour stage information, 40 samples were classified into two groups, namely the T2 + T3 and T4 groups. Then, we identified differentially infiltrated immunocytes between the two groups, which was analysed by the Mann-Whitney test, and differences were considered statistically significant when the p value was <.05. The immunocytes with the greatest differences and clinical significance were selected as the target immunocytes for the next analysis.
Identification of genes related to infiltrating immunocytes by weighted gene Co-expression network analysis (WGCNA)
The expression profiling of all the 274 samples was used in this analysis. In this analysis, 5,000 genes with the highest average expression were selected, and the gene expression was calculated using the WGCNA algorithm [Citation13]. First, the soft threshold for network construction was selected by calculating the scale-free topology fit index for several powers. Then, a scale-free network was constructed and the module eigengene (ME) was calculated. Each module contained a list of genes with the most appropriate accounting of gene expression profile. All the 274 samples were divided into a high-infiltration group and a low-infiltration group according to the infiltration scores of the targeted immunocytes, the scores were utilized as the clinicopathological features for the next step. Finally, the correlation between the ME and the clinicopathological features in each module was calculated. According to module-trait relationships, the module exhibiting the most obvious correlation was considered a key module and selected for further calculation [Citation14].
Functional enrichment analysis
Metascape is a meta-analysis website that integrates gene annotation and functional enrichment analysis. In this section, by using the “Express Analysis” module in Metascape, we explored the enriched biological processes and pathways of the list of genes contained in the key module [Citation15].
Differentially expressed genes (DEGs) and correlation analysis
We analysed the list of genes contained in the key module to identify DEGs between the high-infiltration and low-infiltration groups, and we further identified target genes associated with immunocyte infiltration. The DEGs were analysed using the limma package of R software with an adjusted p value < .05 and |logFC| >1 [Citation16].
Spearman’s correlation test was performed to evaluate potential correlations between the mRNA expression of the target genes and immunocyte infiltration levels [Citation17].
TIMER database analysis
TIMER is a comprehensive website for the systematic analysis of infiltrating immunocytes across diverse carcinomas [Citation18]. We analysed the expression of the target genes in different types of carcinoma and the correlations of these genes with 6 types of infiltrating immunocytes (B cells, CD4+ T cells, CD8+ T cells, neutrophils, macrophages, and dendritic cells) in oesophageal carcinoma and other digestive system carcinomas. Gene expression levels against tumour purity is a critical factor that affects the analysis of immunocyte infiltration levels, and it is shown in the left-most panel [Citation12]. The correlations between the mRNA expression of the target genes and that of related colony-stimulating factors (CSFs) were also analysed with TIMER.
Results
Data information
GSE69925 was submitted by the Japan National Cancer Centre Research Institute, and includes 274 pre-treatment oesophageal squamous cell carcinoma biopsy specimens. These specimens were analysed by comprehensive gene expression profiling. After preprocessing, 21,654 genes were annotated and retained for subsequent analysis.
Infiltrating immunocytes relevant to different stages in ESCC
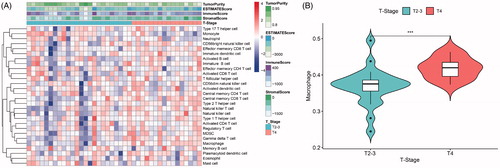
The immune infiltration levels of 40 samples with stage information are shown as a heat map (). Between the two groups (the T2 + T3 and T4 groups), our analysis showed that 7 types of immunocytes had significantly different levels of infiltration, including central memory CD8 T cells, gamma delta T cells, immature B cells, macrophages, monocytes, natural killer T cells and type 2 T helper cells. Among these types of immunocytes, macrophages exhibited a more significant difference (p < .001, ) and have been reported to participate in tumour-promoting activities in oesophageal carcinoma [Citation19]. Thus, macrophages were selected as a target immunocyte in our study.
Figure 2. (A) Immune infiltration levels of 40 samples with stage information. (B) Macrophage infiltration levels were obviously higher in advanced stages of oesophageal squamous cell carcinoma (ESCC) (***, p < .001).
Identification of genes related to macrophage infiltration
The immune infiltration levels of all the 274 samples are shown in . As shown in the figure, all the samples were divided into a high macrophage infiltration group (Macrophage High) and a low macrophage infiltration group (Macrophage Low) according to the median level of macrophage infiltration (median value, 0.418).
Figure 3. Identification of macrophage infiltration-related genes. (A) Immune infiltration levels of all 274 samples in GSE69925 (Macrophage High, high level of macrophage infiltration. Macrophage Low, low level of macrophage infiltration.). (B) The scale-free fit index and mean connectivity of various soft-thresholding powers. When the power value is 3, a scale-free co-expression network can be achieved. (C) Gene numbers of constructed modules. (D) Correlations between gene modules and clinicopathological features. (E) Gene significance of the genes contained in the yellow module versus module membership.
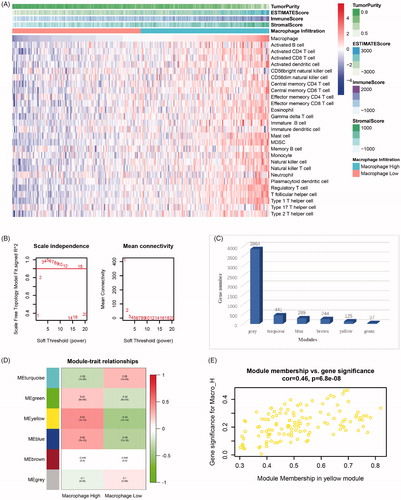
Based on 5,000 genes with the highest average expression in the 274 samples, gene co-expression modules were analysed by the WGCNA algorithm. In our analysis, when the power value was 3, a scale-free co-expression network was achieved (). Then, 6 modules containing the 5,000 genes mentioned above were constructed. All the modules are marked with different colours and are shown in . Using macrophage infiltration levels as clinicopathological features, we plotted module-feature relationships (). From the figure, we observed that high macrophage infiltration group (Macrophage High) was strongly associated with the yellow module (r = 0.43, p = 1E-13). The gene significance of 125 genes contained in the yellow module versus module membership is depicted in a scatter plot (). Therefore, the gene list contained in the yellow module was considered to be significant for macrophage infiltration in ESCC and was selected as the hub gene list.
Functional enrichment analysis of the hub gene list
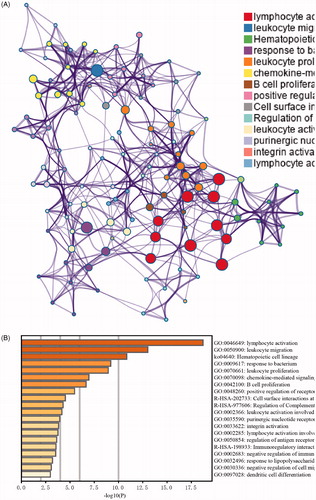
The biological processes of the gene list were explored utilizing GO and KEGG analyses in Metascape (). As shown in this figure, the top 5 enrichment items were: GO:0046649: lymphocyte activation; GO:0050900: leukocyte migration; ko04640: haematopoietic cell lineage; GO:0009617: response to bacterium; and GO:0070661: leukocyte proliferation. The enrichment analysis results indicated that the hub gene list was highly associated with immune system functions.
Figure 4. Functional enrichment analysis of the gene list contained in the yellow module. (A) Network of functional enrichment terms coloured by clusters. (B) Heatmap of functional enrichment terms coloured by p-values.
Identification of macrophage infiltration-related genes
The hub gene list was further screened to identify differentially expressed genes (DEGs) between the high macrophage infiltration group and the low macrophage infiltration group. In this step, 29 differentially expressed genes were extracted via the limma package in R (, ). Considering that the selected gene list was strongly correlated with a high level of macrophage infiltration, every DEG was upregulated gene (adj.p.Val < .05, logFC > 1).
Figure 5. Identification of macrophage infiltration-related genes. (A) Volcano plot of differentially expressed genes (DEGs) between the high macrophage infiltration group and the low macrophage infiltration group. (B) Violin plot of the MEOX2 expression levels in the two groups (Macro-H, high level of macrophage infiltration. Macro-L, low level of macrophage infiltration. ***, p < 0.001). (C) Correlation between MEOX2 expression and macrophage infiltration.
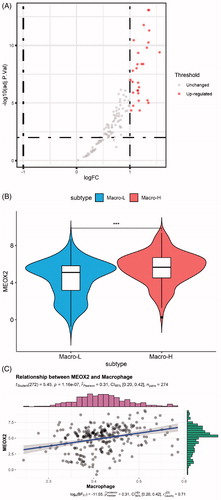
Table 1. All 29 differentially expressed genes (DEGs).
Table 2. Correlation analysis between MEOX2 and CSF-1 and CSF-1R in TIMER.
The DEGs included some genes that were members of TCIA immune gene sets used for ssGSEA, and these genes were first excluded. Then, the genes that were expressed specifically in immune cells were eliminated. Finally, we focussed on MEOX2, which is also known as GAX and MOX2, according to GenBank in NCBI [Citation20].
The expression level of MEOX2 in the two groups is shown as a violin plot in . The correlation between MEOX2 expression and macrophage infiltration was calculated by Spearman’s correlation test, and the results are shown in (r = 0.31, p = 1.16e-7).
Confirmation of the correlation between MEOX2 expression and macrophage infiltration with the TIMER database
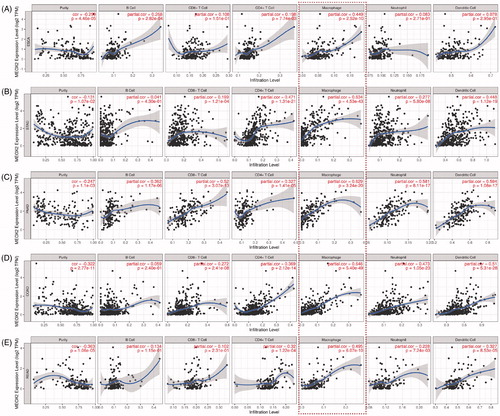
The TIMER database was utilized to verify the correlation between the MEOX2 expression level and the degree of immunocyte infiltration in oesophageal carcinoma (). As shown in the figure, the MEOX2 expression levels had a highly positive correlation with the macrophage infiltration levels (r = 0.449, p = 2.52e-10). Then, we further assessed the correlations between the MEOX2 expression level and the degree of immunocyte infiltration in other digestive system carcinomas, including stomach adenocarcinoma (STAD), pancreatic adenocarcinoma (PAAD), colon adenocarcinoma (COAD) and rectum adenocarcinoma (READ) (). The results indicated that the MEOX2 expression levels had a significantly positive correlation with the numbers of infiltrating macrophages in all the carcinomas mentioned above, including STAD (r = 0.634, p = 4.53e-43), PAAD (r = 0.629, p = 3.24e-20), COAD (r = 0.646, p = 5.40e-49) and READ (r = 0.495, p = 6.07e-10).
Figure 6. Correlations of MEOX2 expression with immunocyte infiltration in oesophageal carcinoma and other digestive system carcinomas in TIMER database. (A) ESCA, oesophageal carcinoma. (B) STAD, stomach adenocarcinoma. (C) PAAD, pancreatic adenocarcinoma. (D) COAD, colon adenocarcinoma. (E) READ, rectum adenocarcinoma.
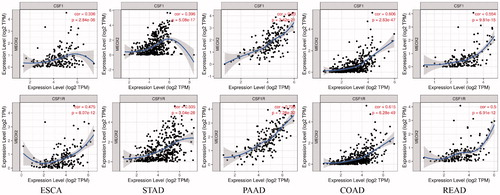
Colony-stimulating factor 1 (CSF-1) is essential for the proliferation and differentiation of macrophages. Thus, we explored correlations between the mRNA expression of MEOX2 and the mRNA expression of colony-stimulating factor 1 (CSF-1) and colony-stimulating factor 1 receptor (CSF-1R) with the TIMER database. The results showed that MEOX2 expression exhibited positive correlations with the mRNA expression of CSF-1 (r = 0.336, p = 2.84e-6) and CSF-1R (r = 0.475, p = 8.07e-12) in oesophageal carcinoma. Further analysis indicated that in the other digestive system carcinomas, MEOX2 expression exhibited positive correlations with the mRNA expression of CSF-1 and CSF-1R, and the correlations in these kinds of carcinomas were even more obvious (, ).
Figure 7. Correlations between mRNA expression of MEOX2 and mRNA expression of colony-stimulating factor 1 (CSF-1) and colony-stimulating factor 1 receptor (CSF-1R) in oesophageal carcinoma and other digestive system carcinomas.
Discussion
In this study, we found that the degree of macrophage infiltration was notably higher in advanced stages of ESCC. Then, through a series of bioinformatic analyses, MEOX2 was identified as a biomarker that was positively correlated with macrophage infiltration levels in ESCC and other types of digestive system carcinomas. To the best of our knowledge, our study is the first to report that MEOX2 is a biomarker associated with immunocyte infiltration in carcinoma.
Tumour associated macrophages (TAMs) are defined as macrophages that reside in tumour tissues, and are essential immunocytes in the tumour microenvironment (TME), TAMs play complicated roles in tumorigenesis, tumour development and metastasis [Citation21,Citation22]. In the initial stage of tumour development, macrophages from surrounding tissues are attracted by tumour cell-derived colony-stimulating factors (CSFs) and infiltrate the tumour tissue where they establish a supportive microenvironment for tumour cells [Citation23]. Then, macrophages secrete various kinds of pro-tumorigenic cytokines, which can promote tumour cell proliferation, inhibit anti-tumour immunity, and increase angiogenesis in tumour tissues [Citation24–27]. With the progression of tumour, some macrophage-derived collagenases, such as MMP2 and MMP9, can degrade the basement membrane and promote angiogenesis, playing indispensable roles in tumour invasion and metastasis [Citation28].
As an indispensable factor for macrophage differentiation and survival, colony-stimulating factor 1 (CSF-1) has been shown to be largely expressed in several kinds of carcinoma cells [Citation24,Citation29,Citation30]. The CSF-1 receptor (CSF-1R) belongs to the transmembrane tyrosine kinase receptor family and is specifically expressed in monocytic lineages [Citation29]. And CSF-1/CSF-1R mediated signalling was reported to be associated with worse prognosis in patients with a variety of carcinomas, including breast and hepatic cancers [Citation31,Citation32]. Therefore, inhibitory mechanisms that target CSF-1/CSF-1R have recently drawn increasing attention, such mechanisms include the humanized monoclonal antibody RG7155 and the small molecular compound PLX3397, which have displayed efficacy in several preclinical models [Citation33,Citation34].
The role of TAMs in oesophageal carcinoma has also been reported in many studies. Manabu Shigeoka et al. found that high TAM density was correlated with poor prognosis in ESCC [Citation35]. In our study, the macrophage infiltration level in stage T4 was clearly higher than that in stage T2-3, which is consistent with the previous study. Taisuke Yagi et al. showed that TAMs could upregulate programmed death ligand 1 (PD-L1) expression in oesophageal carcinoma cells, which would be likely to have clinical implications for immune checkpoint therapy [Citation36]. In addition, TAMs were identified as a biomarker for predicting responses to chemotherapy in oesophageal carcinoma [Citation37].
Mesenchyme homeobox 2 (MEOX2) is a protein-coding gene, that is also known as GAX (growth arrest homeobox) and MOX2 [Citation38]. The protein encoded by this gene is a homeodomain transcription factor, that has traditionally been regarded as essential for bone and muscle growth in embryos [Citation39]. In recent years, MEOX2 has been shown to suppress cell proliferation and EMT (epithelial-to-mesenchymal transition) in cell models [Citation40,Citation41]. In addition, MEOX2 has also been reported to play vital roles in platinum-based drug resistance and EGFR-TKI (epidermal growth factor receptor- tyrosine kinase inhibitor)-based treatment responses in non-small cell lung cancer (NSCLC) patients, leading to poor prognoses in these patients [Citation42]. However, the role of MEOX2 in immune infiltration of TME has never been described.
In our study, the mRNA expression of MEOX2 was positively correlated with the degree of macrophage infiltration in oesophageal squamous cell carcinoma, which was confirmed by the following analysis with the TIMER database. Such correlations could also be detected in other kinds of digestive system carcinomas, and the correlations were even more obvious in these other carcinomas. Further analysis indicated that MEOX2 expression was strongly associated with the mRNA expression of CSF-1 and CSF-1R in oesophageal carcinoma and all the other digestive system carcinomas examined in this study. In summary, we speculated that MEOX2 could promote macrophage infiltration into the tumour microenvironment via CSF-1/CSF-1R signalling in oesophageal carcinoma and other digestive system carcinomas.
We acknowledge that there are several limitations in this study. The histological type of samples contained in GSE69925 is squamous cell carcinoma, whereas the histological type of the majority of oesophageal samples in TIMER database is adenocarcinoma. In addition, our study was based on bioinformatics analysis of expression profiles from public databases, and further biological experiments are required to confirm the results.
Conclusion
In summary, our study provides novel insight into the role of MEOX2 in macrophage infiltration in ESCC and other kinds of digestive system carcinomas. In the carcinomas mentioned above, MEOX2 expression was not only associated with macrophage infiltration but also positively correlated with the mRNA expression of CSF-1 and CSF-1R. Therefore, we hypothesized that MEOX2 could facilitate macrophage infiltration via CSF-1/CSF-1R signalling in these kinds of carcinomas.
Consent for publication
Not applicable.
Ethics approval and consent to participate
Not applicable.
Author contributions
Peng Lin and Zhihua Zhu conceived this study; Rusi Zhang, Bin Luo and Bingchen Xu retrieved and disposed data from GEO database; Zhen Wang and Han Yang performed data analysis prepared the manuscript; Peng Lin and Zhihua Zhu revised the manuscript. All authors read and approved the final manuscript.
Acknowledgements
We thank the contributors to the profile of GSE69925 in the GEO datasets (https://www.ncbi.nlm.nih.gov/geoprofiles).
Disclosure statement
No potential conflict of interest was reported by the author(s).
Availability of data and materials
The datasets analysed during the current study are available in the NCBI Gene Expression Omnibus (GEO) repository (https://www.ncbi.nlm.nih.gov/geo/).
References
- Ferlay J, Colombet M, Soerjomataram I, et al. Estimating the global cancer incidence and mortality in 2018: GLOBOCAN sources and methods. Int J Cancer. 2019;144(8):1941–1953.
- Rustgi AK, El-Serag HB. Esophageal carcinoma. N Engl J Med. 2014;371(26):2499–2509.
- Watanabe M, Otake R, Kozuki R, et al. Recent progress in multidisciplinary treatment for patients with esophageal cancer. Surg Today. 2020;50(1):12–20.
- Ammannagari N, Atasoy A. Current status of immunotherapy and immune biomarkers in gastro-esophageal cancers. J Gastrointest Oncol. 2018;9(1):196–207.
- Tang H, Bai Y, Shen W, et al. Clinical significance of combined detection of interleukin-6 and tumour markers in lung cancer. Autoimmunity. 2018;51(4):191–198.
- Dhupar R, Van Der Kraak L, Pennathur A, et al. Targeting immune checkpoints in esophageal cancer: a high mutational load tumor. Ann Thorac Surg. 2017;103(4):1340–1349.
- Schumacher K, Haensch W, Roefzaad C, et al. Prognostic significance of activated CD8(+) T cell infiltrations within esophageal carcinomas. Cancer Res. 2001;61:3932–3936.
- Nishimura J, Tanaka H, Yamakoshi Y, et al. Impact of tumor-infiltrating LAMP-3 dendritic cells on the prognosis of esophageal squamous cell carcinoma. Esophagus. 2019;16(4):333–344.
- Tanaka Y, Aoyagi K, Minashi K, et al. Discovery of a good responder subtype of esophageal squamous cell carcinoma with cytotoxic T-lymphocyte signatures activated by chemoradiotherapy. PLoS One. 2015;10(12):e0143804.
- Charoentong P, Finotello F, Angelova M, et al. Pan-cancer immunogenomic analyses reveal genotype-immunophenotype relationships and predictors of response to checkpoint blockade. Cell Rep. 2017;18(1):248–262.
- Hanzelmann S, Castelo R, Guinney J. GSVA: gene set variation analysis for microarray and RNA-seq data. BMC Bioinf. 2013;14(1):7.
- Yoshihara K, Shahmoradgoli M, Martinez E, et al. Inferring tumour purity and stromal and immune cell admixture from expression data. Nat Commun. 2013;4(1):2612.
- Langfelder P, Horvath S. WGCNA: an R package for weighted correlation network analysis. BMC Bioinf. 2008;9(1):559.
- Li J, Liu C, Chen Y, et al. Tumor characterization in breast cancer identifies immune-relevant gene signatures associated with prognosis. Front Genet. 2019;10:1119.
- Zhou Y, Zhou B, Pache L, et al. Metascape provides a biologist-oriented resource for the analysis of systems-level datasets. Nat Commun. 2019;10(1):1523.
- Ritchie ME, Phipson B, Wu D, et al. limma powers differential expression analyses for RNA-sequencing and microarray studies. Nucleic Acids Res. 2015;43(7):e47.
- Holderried TAW, de Vos L, Bawden EG, et al. Molecular and immune correlates of TIM-3 (HAVCR2) and galectin 9 (LGALS9) mRNA expression and DNA methylation in melanoma. Clin Epigenet. 2019;11(1):161.
- Li T, Fu J, Zeng Z, et al. TIMER2.0 for analysis of tumor-infiltrating immune cells. Nucleic Acids Res. 2020;48(W1):W509–W14.
- Huang TX, Fu L. The immune landscape of esophageal cancer. Cancer Commun. 2019;39(1):79.
- Mascher M, Schreiber M, Scholz U, et al. Genebank genomics bridges the gap between the conservation of crop diversity and plant breeding. Nat Genet. 2019;51(7):1076–1081.
- Ostuni R, Kratochvill F, Murray PJ, et al. Macrophages and cancer: from mechanisms to therapeutic implications. Trends Immunol. 2015;36(4):229–239.
- Nguyen KQ, Tsou WI, Kotenko S, et al. TAM receptors in apoptotic cell clearance, autoimmunity, and cancer. Autoimmunity. 2013;46(5):294–297.
- Pollard JW. Tumour-educated macrophages promote tumour progression and metastasis. Nat Rev Cancer. 2004;4(1):71–78.
- Komohara Y, Fujiwara Y, Ohnishi K, et al. Tumor-associated macrophages: potential therapeutic targets for anti-cancer therapy. Adv Drug Deliv Rev. 2016;99:180–185.
- Wu A, Wei J, Kong LY, et al. Glioma cancer stem cells induce immunosuppressive macrophages/microglia. Neuro Oncol. 2010;12(11):1113–1125.
- Vlaicu P, Mertins P, Mayr T, et al. Monocytes/macrophages support mammary tumor invasivity by co-secreting lineage-specific EGFR ligands and a STAT3 activator. BMC Cancer. 2013;13(1):197.
- Lin EY, Li JF, Gnatovskiy L, et al. Macrophages regulate the angiogenic switch in a mouse model of breast cancer. Cancer Res. 2006;66(23):11238–11246.
- Wyckoff JB, Wang Y, Lin EY, et al. Direct visualization of macrophage-assisted tumor cell intravasation in mammary tumors. Cancer Res. 2007;67(6):2649–2656.
- Mantovani A, Marchesi F, Malesci A, et al. Tumour-associated macrophages as treatment targets in oncology. Nat Rev Clin Oncol. 2017;14(7):399–416.
- Cannarile MA, Weisser M, Jacob W, et al. Colony-stimulating factor 1 receptor (CSF1R) inhibitors in cancer therapy. J Immunother Cancer. 2017;5:53.
- Zhu XD, Zhang JB, Zhuang PY, et al. High expression of macrophage colony-stimulating factor in peritumoral liver tissue is associated with poor survival after curative resection of hepatocellular carcinoma. J Clin Oncol. 2008;26(16):2707–2716.
- Lin EY, Nguyen AV, Russell RG, et al. Colony-stimulating factor 1 promotes progression of mammary tumors to malignancy. J Exp Med. 2001;193(6):727–740.
- Ries CH, Cannarile MA, Hoves S, et al. Targeting tumor-associated macrophages with anti-CSF-1R antibody reveals a strategy for cancer therapy. Cancer Cell. 2014;25(6):846–859.
- Tap WD, Wainberg ZA, Anthony SP, et al. Structure-guided blockade of CSF1R kinase in tenosynovial giant-cell tumor. N Engl J Med. 2015;373(5):428–437.
- Shigeoka M, Urakawa N, Nakamura T, et al. Tumor associated macrophage expressing CD204 is associated with tumor aggressiveness of esophageal squamous cell carcinoma. Cancer Sci. 2013;104(8):1112–1119.
- Yagi T, Baba Y, Okadome K, et al. Tumour-associated macrophages are associated with poor prognosis and programmed death ligand 1 expression in oesophageal cancer. Eur J Cancer. 2019;111:38–49.
- Yamamoto K, Makino T, Sato E, et al. Tumor-infiltrating M2 macrophage in pretreatment biopsy sample predicts response to chemotherapy and survival in esophageal cancer. Cancer Sci. 2020;111(4):1103–1112.
- Brown GR, Hem V, Katz KS, et al. Gene: a gene-centered information resource at NCBI. Nucleic Acids Res. 2015;43(D1):D36–42.
- Mankoo BS, Collins NS, Ashby P, et al. Mox2 is a component of the genetic hierarchy controlling limb muscle development. Nature. 1999;400(6739):69–73.
- Valcourt U, Thuault S, Pardali K, et al. Functional role of Meox2 during the epithelial cytostatic response to TGF-beta. Mol Oncol. 2007;1(1):55–71.
- Patel S, Leal AD, Gorski DH. The homeobox gene Gax inhibits angiogenesis through inhibition of nuclear factor-kappaB-dependent endothelial cell gene expression. Cancer Res. 2005;65(4):1414–1424.
- Armas-Lopez L, Pina-Sanchez P, Arrieta O, et al. Epigenomic study identifies a novel mesenchyme homeobox2-GLI1 transcription axis involved in cancer drug resistance, overall survival and therapy prognosis in lung cancer patients. Oncotarget. 2017;8(40):67056–67081.