
Abstract
Constituted by various heterogeneous cells, the tumor microenvironment (TME) is capable of promoting tumor proliferation, invasion, and metastasis through extensive crosstalk. The pivotal factor influencing the survival time of patients and their response to immunotherapy lies in the intratumoral immune environment. We obtained 112 differential genes related to T cell-mediated tumor killing in LUAD by employing bioinformatics analysis on the basis of the TCGA and TISIDB databases. Then the 6-gene prognostic risk score model (CA9, OIP5, TIMP1, SEC11C, FURIN, and TLR10) was constructed by conducting univariate LASSO as well as multivariate Cox regression analyses. The median risk score was taken as the threshold to classify the samples into two groups. Survival analysis revealed that the low-risk group exhibited a more favorable prognosis. Subsequently, the Cox regression analysis combined with clinical information (age, gender, and pathological stage) and the risk score of LUAD patients demonstrated the potential of this model as an independent prognostic factor. The nomogram established based on clinical information and a risk score in combination with the calibration curve indicated that this model had good predictive ability. Notable enrichment of the differential genes from the high- and low-risk groups was discovered in immune-associated processes or pathways, as shown by the GO and KEGG enrichment analyses. The combined use of single-sample gene enrichment analysis (ssGSEA) and immunophenoscore (IPS) demonstrated heightened immune infiltration and IPS scores in the low-risk group, indicating that immunotherapy was likely to show good efficacy in patients from this group. To sum up, the prognostic model of LUAD constructed based on T-cell-mediated cell killing-related genes was not only capable of screening the prognosis of LUAD patients but was also used for screening those LUAD patients with high sensitivity to immunotherapy. Our study offered novel insights into the clinical treatment and prognostic prediction of LUAD patients.
Graphical Abstract
Introduction
The number of people who die from lung cancer each year is up to 1.8 million, accounting for 18% of total cancer mortality [Citation1]. Lung cancer has two primary subtypes, namely, squamous cell carcinoma and lung adenocarcinoma (LUAD) [Citation2]. Currently, there are various strategies for combating LUAD, including chemotherapy, surgical resection, radiotherapy, and molecular targeted therapy [Citation3]. Nevertheless, the prognosis of LUAD patients remains unsatisfactory. Immunotherapy, as a popular treatment, can greatly improve the anti-cancer ability of patients, and immune checkpoint inhibitors (ICIs) developed with PD-1/PD-L1 inhibitors have achieved good efficacy in lung cancer clinical research and become a new method of NSCLC immunotherapy. For example, Forde et al. [Citation4] reported 21 patients with stage I-IIIa NSCLC treated with preoperative adjuvant therapy using nivolumab monotherapy, of whom 20 patients achieved R0 resection after monotherapy, with a major pathological response rate of 45%, and two patients (10%) achieved pathological complete response. Although this result has given medical workers great encouragement, the large individual differences bring about unsatisfactory response rates to immunotherapy, and patients are prone to immune-related adverse reactions [Citation5]. Therefore, it is necessary to identify patient groups that can benefit from immunotherapy, which will bring great significance to the treatment of LUAD patients.
As regulators of the immune system, immune checkpoints are pivotal for self-tolerance, which forestalls the indiscriminatory attack on cells from the immune system. High expression of immune checkpoints can hinder immune cell function and thus mediate tumor immune escape. Currently, immune checkpoint blockade-based cancer immunotherapy has contributed to excellent and long-lasting clinical responses in various cancer patients. The tumor microenvironment (TME) is the crucial determinant of responses to checkpoint blockades. T cells, especially antigen-specific cytotoxic T cells, are able to detect and eliminate cancer cells by recognizing tumor-related antigens. The cardinal principle of immunotherapy lies in T-cell-mediated tumor killing (TTK). Hong et al. [Citation6] constructed the subtypes through TTK sensitivity-related genes. The prognostic value of these subtypes for immunotherapy in hepatocellular carcinoma has been evaluated. Kim et al. [Citation7] identified a novel checkpoint inhibitory molecule, LILRB1, which could suppress CD8+ T cell-mediated cytolysis, and blocking LILRB1 was able to enhance CD8 + T cell-induced tumor cell killing. Aschmoneit et al. [Citation8] found that the binding of scDb-scFv to tumor cells expressing HER3 effectively formed an immunological synapse, and this increased binding could facilitate the proliferation and activation of T cells and improve the killing ability of T cells against tumor cells. Nevertheless, TME is still limited in predicting the response of patients to immunotherapy, and further exploration is needed to improve its clinical role. In addition, TTK-related features in LUAD and their value in clinical outcome and response to immunotherapy remain to be explored.
Here, the differential analysis was conducted based on LUAD TTK-related genes in the TCGA and TISIDB databases, followed by LASSO-Cox analysis to build a LUAD polygenic prognostic risk score model. We also analyzed the accuracy and prognostic value of the model. Grounded in this model, we screened the LUAD patient with high sensitivity to immunotherapy, hoping to provide new insight into the prediction of prognosis as well as develop therapeutic strategies for treating LUAD patients.
Material and method
Data download
We utilized the obtained data (expression data (count data), SNV mutation data, and clinical data of LUAD) from the TCGA database (https://portal.gdc.cancer.gov/) as the training set, including 54 normal samples and 501 LUAD samples. From the GEO database (https://www.ncbi.nlm.nih.gov/), GSE72094 (annotation platform: GPL15048) was downloaded as the validation set. We also searched through the TISIDB database (http://cis.hku.hk/TISIDB/) for the genes related to good response to TTK in cancer immunotherapy, which were named genes sensitive to TTKs (GSTTKs) (Table S1).
Identification of TTKRGs in LUAD
For the identification of differentially expressed genes (DEGs), mRNA expression data were analyzed for gene differences between normal and tumor samples using the “edgeR” package [Citation9]. LUAD-related DEGs were screened with a screening threshold of |logFC|>1 and FDR < 0.05. LUAD-related DEGs were intersected with GSTTKs to obtain TTK-related DEGs (TTKRGs) in LUAD for subsequent analysis.
Construction and validation of TTKRGs risk prognostic models
Tumor patient samples with survival a time greater than thirty days were selected, and by utilizing the “survival” package [Citation10], a univariate Cox regression was conducted on the TTKRGs to identify genes that greatly affected survival (p < 0.05). In case the model was overfitted, we then conducted the LASSO regression by utilizing the “glmnet” package as per the conclusion of the univariate Cox regression analysis [Citation11]. At last, by employing the “survival” package, we conducted multivariate Cox analysis on the identified genes from LASSO regression, leading to the development of the prognostic model.
The risk score was then computed, the median value of which was utilized as the cutoff value to classify the patients into high- and low-risk groups. To compare the survival rates of LUAD patients between the two groups, Kaplan-Meier survival curves for the two groups were made utilizing the “survival package”. The “timeROC” package [Citation12] was then utilized for plotting receiver operating characteristic (ROC) curves for 1, 3, and 5 years, and the predictive accuracy of the model was evaluated based on area under curve (AUC) values. Finally, the model underwent further validation using the GSE72094 dataset.
Independent prognostic analysis
Combined with the clinical information of LUAD samples, univariate as well as multivariate Cox analyses were conducted for risk scores, age, gender, pathological stage, and other characteristics using the “survival” package. Subsequently, by utilizing the “rms” package [Citation13], nomograms were obtained based on risk score and four other clinical features. Next, through the calibration curves, the capability of the nomograms to predict was assessed.
Gene ontology (GO) and Kyoto encyclopedia of genes and genomes (KEGG) enrichment analyses
To figure out which biological functions or pathways DEGs between two groups were associated with, we conducted the differential analysis between two groups utilizing the “edgeR” package and selected DEGs in different risk groups according to the threshold (p < 0.05, |logFC|>1). KEGG enrichment and GO enrichment analyses were subsequently conducted for different risk groups using the “clusterProfiler” package [Citation14].
Immunogene analysis
To dissect the immune infiltration in different risk groups, the TME of each sample from the two groups was assessed using “estimate” [Citation15], and their immune score, stromal score, and ESTIMATE score were also calculated and assessed separately. ssGSEA was employed on tumor samples from the two groups using the “GSVA” package [Citation16], and Wilcoxon was employed to ascertain the distinctiveness between the two groups with high and low risk (p < 0.05). Utilizing pheatmap (https://cran.r-project.org/web/packages/pheatmap/index.html), antitumor immune infiltration from the two groups was visualized. The TIMER 2.0 database (http://timer.comp-genomics.org/) was used to further explore the immune infiltration levels of the high- and low-risk groups. The correlation between riskscore and immune-related cell/function score (p < 0.05) was calculated using the Pearson correlation test to determine the trend of immune level with riskscore.
Immunophenoscore (IPS)
IPS score, only the expression of immune checkpoints (CTLA-4/PD-1/PD-L1/PD-L2) of tumor-associated immune cells (lymphocytes, macrophages, etc.) was used as a separate evaluation index to distinguish the benefit groups. IPS can predict patients’ responses to ICI therapy. IPS [Citation17] for LUAD patients in the two groups was acquired from the TCIA database (https://tcia.at), and the difference in IPS between these two groups was compared by using T-test statistical analysis (p < 0.05).
Tumor mutation analysis
We obtained SNV mutation data from the STAD database for genes with mutation rates in the top 30 for both risk groups, and waterfall plots were drawn using the “GenVisR” package [Citation18]. The significance of the difference between the mutation frequencies of the top 5 genes with the highest mutation frequency between the two groups was judged using the Chi-square test.
Drug prediction
CMAP is an expression profile database based on intervention gene expression. It is widely used in pharmacogenomics research by computational biologists and drug screening researchers to reveal functional links between small molecule compounds, genes, and disease states. We used the CMAP database to explore linkages between prognostic signature genes, diseases, and drugs.
Results
Construction of TTKRGs risk prognostic model
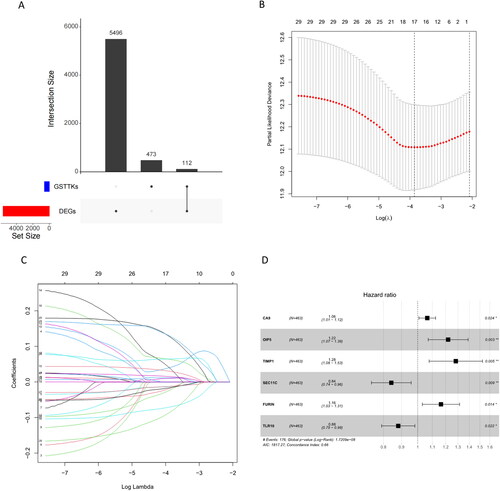
By analyzing the genes in the TCGA-LUAD dataset, a total of 5608 mRNAs with significant differences were obtained. We subsequently took the intersection of 585 GSTTKs obtained from the TISIDB database with DEGs in LUAD to yield 112 TTKRGs (). After screening these 112 TTKRGs and clinical data, we obtained samples from LUAD patients with a survival time higher than 30 days. 31 genes were selected as candidates by univariate regression analysis using the survival package (p < 0.05) (Table S2). To prevent model overfitting, LASSO-Cox regression analysis was further employed on the candidate genes utilizing the glmnet package, which subsequently yielded 17 candidate genes (Table S3) (). Then, a multivariate regression model was constructed for candidate genes obtained from LASSO-Cox regression analysis utilizing the survival package, and six signature genes (CA9, OIP5, TIMP1, SEC11C, FURIN, and TLR10) were selected (), and a prognostic risk score model was established: Riskscore = 0.0625*CA9 + 0.1985*OIP5 + 0.2486*TIMP1-0.1717*SEC11C + 0.1518*FURIN-0.1267*TLR10.
Figure 1. Construction of TTKRGs risk prognostic model in LUAD. (A) Upset plot of DEGs and GSTTKs between LUAD samples and normal samples. (B) Coefficient distribution plot generated for log (λ) sequences in LASSO model; the value of λ determines how many genes have coefficients that can remain. The parameter corresponding to the dashed line on the left is lambda.min, which is the value selected this time. (c) LASSO coefficient profile analyzed by LASSO-Cox; A line represents a gene, and the ordinate is the coefficient of that gene. (D) Forest plot of six signature genes obtained by multivariate regression analysis. The dashed line indicates HR = 1, HR < 1 stands for protective factor, and HR > 1 represents risk factors.
Validation of TTKRGs risk prognostic model
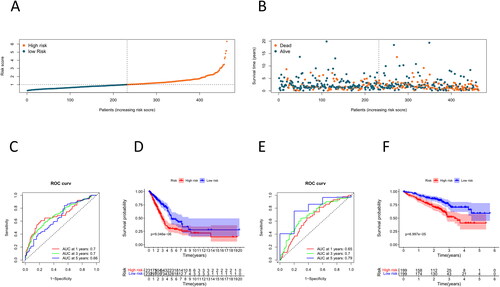
To verify whether this model has high accuracy as well as efficacy, we calculated riskscore values based on the expression levels of the training set samples, which were classified into two groups at riskscore medians, namely, a high-risk group and a low-risk group. We discovered that patients’ higher risk scores were directly linked to higher mortality (). The ROC curves of the training set were plotted using the “timeROC” package, and their AUC values at 1, 3, and 5 years were 0.7, 0.7, and 0.66, respectively (). We then employed the “survival” package to conduct the survival analysis, and it was illustrated by the survival curve that the survival rate in the high-risk group was lower than that in the low-risk group (). Next, we further validated the predictive value of this model using the GSE72094 dataset as a validation set. The AUC values of 1-, 3-, and 5-year from the validation set in the ROC curves were 0.65, 0.7, and 0.79, respectively (). The high-risk group exhibited a significantly lower survival rate compared to the low-risk group, as indicated by the survival curves (). To sum up, this risk prognostic model of our research has good prognostic accuracy.
Figure 2. Validation of TTKRGs risk prognostic model in LUAD. (A) Risk score distribution of LUAD samples (blue: low-risk score, red: high-risk score). (B) Scatter plot showing the survival status of LUAD patients according to the risk score distribution (blue points are surviving patients, and red points are dead patients). (C) ROC curves of the training set samples. The larger the AUC value, the better the prediction performance of the model classifier. (D) K–M survival analysis of high- and low-risk groups of training set samples. (E) ROC curves of the validation set samples. (F) K–M survival analysis of high- and low-risk groups of the validation set samples. When p < 0.05 indicates a significant difference in survival status between the two groups.
Analysis of the independent prognostic capability of the risk score model
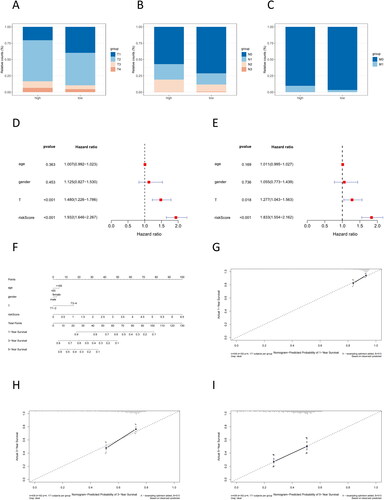
Through validation, we established a correlation between the risk score and the survival rate of cancer patients. Subsequently, we delved deeper into the association between the risk score and the clinical stage of cancer patients. Patients in the high-risk group possessed a higher degree of tumor progression (). To demonstrate whether this prognostic risk model can act as an independent prognostic factor, we first did univariate and multivariate Cox regression analyses combining clinical information and riskscore values (), with results showing that riskscore was less than 0.001, which suggests that it was reasonable to use our constructed model as an independent prognostic factor for LUAD individuals. Subsequently, nomograms and calibration curves were plotted for forecasting the 1-, 3-, and 5-year survival rates of individuals (), and the calibration curves showed that the predicted survival rate of the model fitted well with the actual survival rate () and had a better prognostic performance.
Figure 3. Analysis of the independent prognostic capability of risk score model. (A–C) Number of patients at the TNM stage in the high- and low-risk groups. (D–E) Forest plot for univariate and multivariate regression analyses of prognostic model risk score combined with clinical information; the nomogram was used to assess the significance of risk scores and clinical factors on patient survival. (F) Nomogram of prognostic model risk score combined with clinical information. Each value level of each influencing factor was scored, and then the scores were added to obtain the total risk score of the patient. (G–I) 1 year, 3 years, and 5 years risk prediction calibration curves. The abscissa is the predicted probability, and the ordinate is the observed actual rate. The better the fit, the higher the prediction accuracy of the nomogram.
GO and KEGG enrichment analyses
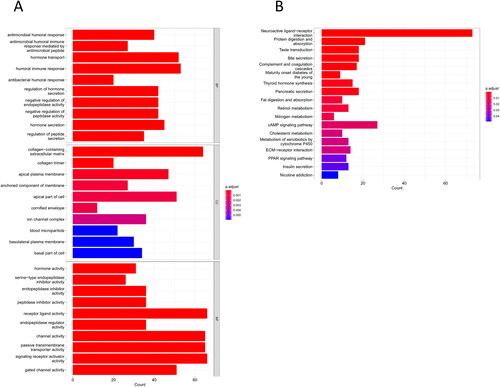
To unmask those functions or pathways associated with DEGs, we first used “edgeR” to obtain 1340 DEGs between the two risk groups. Next, these DEGs were utilized for KEGG and GO enrichment analyses. GO analysis results illustrated that most of these genes were substantially enriched in antimicrobial peptide-mediated humoral immune response, humoral immune response, negative regulation of peptidase activity, endopeptidase inhibitor activity, peptidase inhibitor activity, and other functions related to humoral immunity and endopeptidase activity (). KEGG results ascertained that these DEGs were substantially enriched in immune-related pathways such as complement and coagulation cascades, ECM-receptor interaction, and neuroactive ligand-receptor interaction ().
Figure 4. GO and KEGG enrichment analyses. (A) GO enrichment analysis result; (B) KEGG enrichment analysis result
Differences in TME between high- and low-risk groups
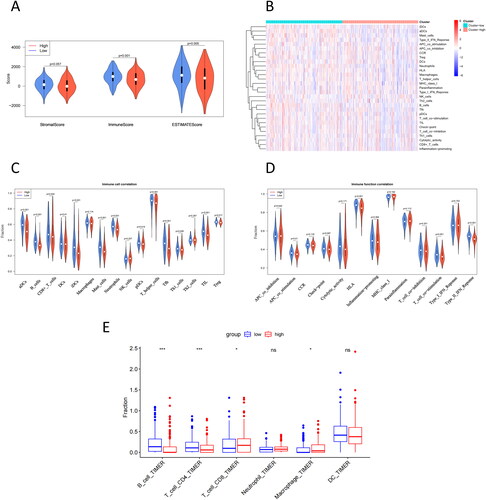
Enrichment analysis demonstrated that the difference in the survival rates of the two risk groups was primarily immune-related. To understand the TME difference between the two groups, the stromal and immune scores of LUAD tumor samples in the training set were calculated, which illustrated that compared with the low-risk group, the high-risk group had a much lower immune score as well as ESTIMATE score (). Then, the level of immune infiltration was evaluated for each LUAD tumor sample, which demonstrated that, in contrast to the high-risk group, the low-risk group had a higher degree of immune infiltration (). Moreover, we also detected the differences in immune cells and function between the two groups and discovered that the low-risk group had a much higher immune cell component () and immunocompetence () than the high-risk group. Based on TIMER analysis, B cells, and CD4 + T cells had significantly higher infiltration levels in the low-risk group, while CD8 + T cells and macrophages had significantly higher infiltration levels in the high-risk group ().
Figure 5. Differences in TME between high- and low-risk groups. (A) Differential analysis of stromal score, immune score, and ESTIMATE score in the high- and low-risk groups. (B) Immune component heatmap in the high- and low-risk groups of LUAD tumor samples. (C) Violin map of differential analysis of immune cell component in the high- and low-risk groups. (D) Violin map of differential analysis of immune function in the high- and low-risk groups; blue represents the low-risk group of LUAD, and red represents the high-risk group of LUAD. (E) TIMER was used to analyze the difference in immune infiltration between high- and low-risk groups. p < 0.05 indicates a significant difference in the index between the two groups.
To assess the effect of immunotherapy on patients in different risk groups, we performed a correlation analysis between risk score and immune function score, as well as a correlation analysis between risk score and immune cell score (). We found a negative and statistically significant correlation with risk score among neutrophils, aDCs, B cells, iDCs, Type II IFN response, TIL, mast cells, HLA, T helper cells, T cell co-stimulation, Treg, Tfh, APC co stimulation, CD8 + T cells, macrophages, pDCs, T cell co-inhibition, check-point, CCR, Th1 cells, and Th2 cells. Taken together, the model constructed in this study may have potential value in judging patients’ TME profiles for screening groups that respond better to immunotherapy.
Table 1. Correlation analysis of risk score with immune cell score and immune function score.
IPS
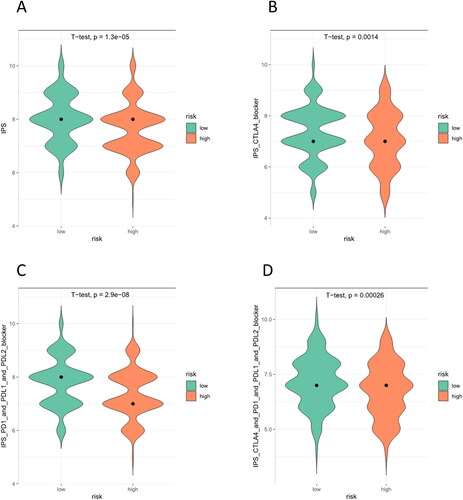
To figure out the sensitivity of patients from these two groups to immunotherapy, we assessed IPS between the two groups of LUAD to assess their immunogenicity. As can be seen, the low-risk group scores higher in IPS, IPS CTLA4, IPS-PD1-PD-L1-PD-L2, and IPS-PD1-PD-L1-PD-L2-CTLA4 (). IPS had a positive correlation with the effect of immunotherapy. Thus, compared with individuals in the high-risk group, individuals in the low-risk group had higher immunogenicity and were more likely to benefit from immunotherapy.
Figure 6. IPS for high- and low-risk groups. (A) IPS score. (B) IPS-CTLA4 blocker score (PD-1/PD-L1/PD-L2 negative and CTLA-4 positive). (C) IPS-PD1/PDL1/PDL2 blocker score (PD-1/PD-L1/PD-L2 positive and CTLA-4 negative). (D) IPS-CTLA4/PD1/PDL1/PDL2 blocker score (CTLA-4/PD-1/PD-L1/PD-L2 positive).
Tumor mutation analysis
To look at the differences in mutated genes between these two risk groups, the SNV data of individuals was first counted to find the top 30 mutation load genes (). The waterfall plot illustrated a higher mutation frequency in the top 30 genes in the high-risk group, most of which were non-synonymous mutations, and the mutation type was missense mutations. The top five genes for each group were TP53, TTN, CSMD3, MUC16, and RYR2 (in the high-risk group) and TP53, MUC16, TTN, CSMD3, and LRP1B (in the low-risk group).
Figure 7. TMB waterfall plot of top 30 genes in high- (A) and low-risk (B) groups. The abscissa corresponds to the patient sample. The ordinate represents the gene.
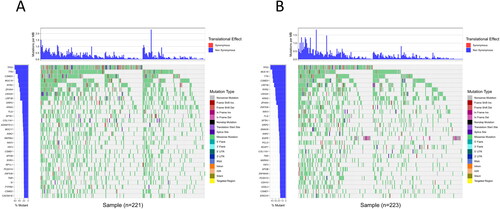
The top five genes from two groups were taken and pooled, and the chi-square test was used to determine the difference in mutation frequencies of these genes in different groups (). It was finally discovered that the high-risk group had much elevated mutation frequencies of TP53, TTN, and RYR2.
Table 2. Chi-square test results for gene mutation frequency in high- and low-risk groups.
Drug prediction
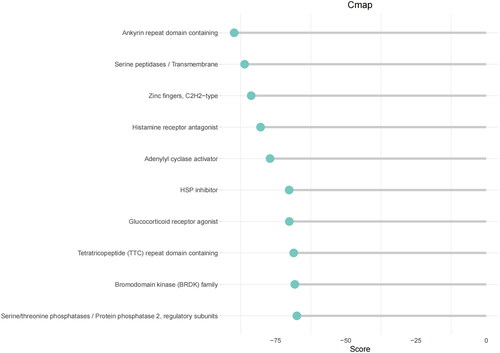
The top 150 DEGs in high- and low-groups were input into the CMAP database to forecast small molecule compounds targeting LUAD. According to score scoring, negative values indicated antagonistic expression. These small molecules that exhibited antagonistic effects had the potential to be considered candidates for the treatment of LUAD. The top 10 most antagonistic drug candidates were identified (Table S4; ).
Figure 8. Prediction of small molecule drugs.
Discussion
Despite tremendous advances over the last few years, LUAD remains a tumor with a poor prognosis when detected in advanced stages [Citation19]. Hence, it is necessary to explore new prognostic biomarkers that are conducive to the treatment of LUAD patients to improve patient survival. Recent immunotherapies have provided new perspectives in cancer therapy [Citation20]. LUAD has been shown to tend to have a high tumor mutation burden (TMB) and strong immunogenicity, making it an ideal indication for immunotherapy [Citation21]. Therefore, this study investigated TTKRGs in LUAD in public databases and constructed a polygenic prognostic risk score model. Potential LUAD populations that could benefit from immunotherapy were identified by this model.
Prognostic predictors of LUAD patients excavated in our institute included: CA9, OIP5, TIMP1, SEC11C, FURIN, and TLR10. Among them, the risk factors consisted of TIMP1, FURIN, CA9, and OIP5. The protective factors included SEC11C and TLR10. TIMP1 is composed of a dual domain with metalloproteinase inhibition and cytokine-like signaling activity, which is thought to have a connection with immune cell infiltration in glioblastoma [Citation22]. Numerous studies have demonstrated that TIMP1 expression is greatly elevated in various cancer types and is linked to a worse prognosis, which can serve as an independent prognostic marker [Citation23, Citation24]. TIMP1 accelerates renal tumorigenesis through EMT signaling [Citation25] and facilitates cell proliferation and invasion in colon cancer through FAK/Akt signaling [Citation26]. Zeng et al. [Citation27] found that gene expression and methylation of TIMP1 can be prognostic predictors of low-grade gliomas. As a protein convertase, FURIN is capable of bolstering the development of diverse malignant tumors. As found by Luo et al. [Citation28], FURIN demonstrates a high expression level in LUAD patients, which is considered a promising biomarker to determine prognosis and immune infiltration in LUAD patients, which is consistent with our study. In their functional studies, inhibition of FURIN activity by genetic silencing or by the application of inhibitors was found to affect the growth and metastasis of breast cancer cells [Citation29]. CA9 is a cell surface metalloenzyme that allows tumor cells to survive in an acidic microenvironment [Citation29] and is commonly expressed in cancer cells under hypoxia[Citation30]. Cancer cells, through CA9-related mechanisms, are capable of impeding the infiltration of CD8+ T cells in the TME of pancreatic cancer, which gives rise to a poor prognosis [Citation31]. Studies have ascertained that hypomethylation of CA9 can induce migration and invasion of ovarian cancer cells [Citation32]. OIP5 belongs to the tumor/testis antigen [Citation33], whose high expression has been discovered and implicated in many biological processes in diverse cancers, such as renal clear cell carcinoma [Citation31]. Chun et al. [Citation34] reached the conclusion that in colorectal and gastric cancers, knockdown of OIP5 impedes cell growth and facilitates apoptosis of cancer cells. Chen et al. [Citation35] uncovered the upregulation of OIP5 in malignant gliomas and illustrated the potential of OIP5 as a potential immunotherapeutic target in malignant gliomas, which echoes our findings. As pattern-recognition receptors crucial in inborn and adaptive immunity, toll-like receptors (TLRs) are capable of activating inflammatory signaling pathways and inducing the development of inflammation following stimulation by ligands, such as pathogens and their metabolites [Citation36]. TLR10 was present as a protective factor in this study, which echoed the findings of Yu et al. [Citation37], where TLR10 showed an inhibitory effect on inflammation in prostate epithelial cells. As a homolog of SEC11 only responsible for signal peptide processing, SEC11C has a crucial role in protein processing, localization, and secretion [Citation38]. It has not been reported recently regarding the connection between tumor immunity and SEC11. Previous studies have elucidated the effect of these signature genes in several tumors; however, there remains an unanswered question regarding their prognostic value. Those screened prognostic genes held some promise as biomarkers for LUAD therapeutic strategies.
In the immune systems of patients, ICIs are helpful in recognizing and attacking cancer cells. For the ICI response, cancer cell immunogenicity is an essential determinant. In theory, tumors with very low or no immunogenicity will not respond to treatment strategies that improve immune responses. However, promoting tumor immunogenicity is capable of potentially transforming tumors that do not respond to immunotherapy into immunotherapy-responsive tumors [Citation39]. Several factors have been reported to influence the effectiveness of ICI, and TMB [Citation40] is no exception. Our research uncovered that LUAD patients from the low-risk group had better tumor immunotherapy and lower TMB, which echoes the study of Yi et al. [Citation41]. Nevertheless, in many studies, high TMB has contributed to the immunotherapy of tumors because higher TMB leads to more neoantigens and, through major histocompatibility complex MHC proteins, is presented to T cells, increasing TTK action [Citation42]. However, this explanation has also not been fully demonstrated in all cancers [Citation43]. Our study provided significant reference value for the therapeutic effect of LUAD patients on tumor immune responses.
We identified LUAD-associated DEGs and used the CMAP database to predict small molecule drugs targeting the DEGs, with results showing that levocetirizine could target HRH1 and CXCL8. A previous study found that levocetirizine combined with capecitabine and bevacizumab can overcome colorectal cancer resistance [Citation44]. Forskolin can target ADCY2, ADCY5, and GNAS. Furthermore, forskolin has demonstrated the potential to sensitize triple-negative breast cancer cells to doxorubicin [Citation45]. However, the effect of these drugs on LUAD has not been found, and the specific mechanism of drug action remains to be explored.
However, certain limitations existed. Firstly, the results obtained were based solely on data from public databases without the validation of relevant trials. Therefore, further clinical trials in collaboration with multiple centers will be conducted to validate the findings of our study. Secondly, more evidence is warranted to prove the correlation between risk score and patient immunity. Additionally, the specific mechanism of prognostic signature genes in patients requires further investigation through molecular and cellular assays, which will provide insights into the impact of signature genes on the progression of LUAD patients.
Discussion
In short, the 6-gene prognostic risk score model was constructed in our research by studying TTKRGs in public databases. The risk score derived from this prognostic model served not only as an independent prognostic factor for LUAD but also offered valuable information regarding patients’ sensitivity to immunotherapy. In future studies, we aim to delve deeper into the practical applicability of the model in clinical practice, with the hope of offering novel insights into the clinical prognosis and treatment strategies for LUAD patients.
Author contributions
ZL performed conceptualization, funding acquisition, project administration, and writing—review, editing. LB performed data curation, formal analysis, and writing—original draft. CA performed investigation, resources, and visualization. HZ performed methodology. ZC performed Software. YD performed supervision. JX performed validation.
Supplemental Material
Download Zip (44.2 KB)Disclosure statement
No potential conflict of interest was reported by the authors.
Data availability statement
The data that support the findings of this study are available on request from the corresponding author.
Additional information
Funding
References
- Sung H, Ferlay J, Siegel RL, et al. Global cancer statistics 2020: GLOBOCAN estimates of incidence and mortality worldwide for 36 cancers in 185 countries. CA Cancer J Clin. 2021;71(3):1–12.
- Travis WD. Pathology of lung cancer. Clin Chest Med. 2011;32(4):669–692.
- Miller KD, Goding Sauer A, Ortiz AP, et al. Cancer statistics, 2018. CA Cancer J Clin. 2018;68(6):425–445.
- Forde PM, Chaft JE, Pardoll DM. Neoadjuvant PD-1 blockade in resectable lung cancer. N Engl J Med. 2018;379(9):e14.
- Michot JM, Bigenwald C, Champiat S, et al. Immune-related adverse events with immune checkpoint blockade: a comprehensive review. Eur J Cancer. 2016;54:139–148.
- Hong WF, Liu MY, Liang L, et al. Molecular characteristics of T cell-mediated tumor killing in hepatocellular carcinoma. Front Immunol. 2022;13:868480.
- Kim A, Han CJ, Driver I, et al. LILRB1 blockade enhances bispecific T cell engager antibody-induced tumor cell killing by effector CD8(+) T cells. J Immunol. 2019;203(4):1076–1087.
- Aschmoneit N, Steinlein S, Kuhl L, et al. A scDb-based trivalent bispecific antibody for T-cell-mediated killing of HER3-expressing cancer cells. Sci Rep. 2021;11(1):13880.
- Robinson MD, McCarthy DJ, Smyth GK. edgeR: a bioconductor package for differential expression analysis of digital gene expression data. Bioinformatics. 2010;26(1):139–140.
- Flynn R. Survival analysis. J Clin Nurs. 2012;21(19-20):2789–2797.
- Friedman J, Hastie T, Tibshirani R. Regularization paths for generalized linear models via coordinate descent. J Stat Softw. 2010;33(1):1–22.
- Blanche P, Dartigues JF, Jacqmin-Gadda H. Estimating and comparing time-dependent areas under receiver operating characteristic curves for censored event times with competing risks. Stat Med. 2013;32(30):5381–5397.
- Huang C, Liu Z, Xiao L, et al. Clinical significance of serum CA125, CA19-9, CA72-4, and fibrinogen-to-lymphocyte ratio in gastric cancer with peritoneal dissemination. Front Oncol. 2019;9:1159.
- Yu G, Wang LG, Han Y, et al. clusterProfiler: an R package for comparing biological themes among gene clusters. OMICS. 2012;16(5):284–287.
- Yoshihara K, Shahmoradgoli M, Martínez E, et al. Inferring tumour purity and stromal and immune cell admixture from expression data. Nat Commun. 2013;4:2612.
- Hänzelmann S, Castelo R, Guinney J. GSVA: gene set variation analysis for microarray and RNA-seq data. BMC Bioinform. 2013;14:7.
- Charoentong P, Finotello F, Angelova M, et al. Pan-cancer immunogenomic analyses reveal genotype-immunophenotype relationships and predictors of response to checkpoint blockade. Cell Rep. 2017;18(1):248–262.
- Skidmore ZL, Wagner AH, Lesurf R, et al. GenVisR: genomic visualizations in R. Bioinformatics. 2016;32(19):3012–3014.
- Siegel RL, Miller KD, Goding Sauer A, et al. Cancer statistics, 2020. CA Cancer J Clin. 2020;70(3):145–164.
- Yi M, Jiao D, Xu H, et al. Biomarkers for predicting efficacy of PD-1/PD-L1 inhibitors. Mol Cancer. 2018;17(1):129.
- Yi M, Qin S, Zhao W, et al. The role of neoantigen in immune checkpoint blockade therapy. Exp Hematol Oncol. 2018;7:28.
- Liu L, Yang S, Lin K, et al. Sp1 induced gene TIMP1 is related to immune cell infiltration in glioblastoma. Sci Rep. 2022;12(1):11181.
- Meng C, Yin X, Liu J, et al. TIMP-1 is a novel serum biomarker for the diagnosis of colorectal cancer: a meta-analysis. PLoS One. 2018;13(11):e0207039.
- D'Costa Z, Jones K, Azad A, et al. Gemcitabine-induced TIMP1 attenuates therapy response and promotes tumor growth and liver metastasis in pancreatic cancer. Cancer Res. 2017;77(21):5952–5962.
- Shou Y, Liu Y, Xu J, et al. TIMP1 indicates poor prognosis of renal cell carcinoma and accelerates tumorigenesis via EMT signaling pathway. Front Genet. 2022;13:648134.
- Ma B, Ueda H, Okamoto K, et al. TIMP1 promotes cell proliferation and invasion capability of right-sided Colon cancers via the FAK/akt signaling pathway. Cancer Sci. 2022;113(12):4244–4257.
- Zeng WJ, Yang YL, Wen ZP, et al. Identification of gene expression and DNA methylation of SERPINA5 and TIMP1 as novel prognostic markers in lower-grade gliomas. PeerJ. 2020;8:e9262.
- Luo L, Li M, Su J, et al. FURIN correlated with immune infiltration serves as a potential biomarker in SARS-CoV-2 infection-related lung adenocarcinoma. Clin Exp Med. 2022;22(3):371–384.
- Ma YC, Fan WJ, Rao SM, et al. Effect of Furin inhibitor on lung adenocarcinoma cell growth and metastasis. Cancer Cell Int. 2014;14:43.
- Debreova M, Csaderova L, Burikova M, et al. CAIX regulates invadopodia formation through both a pH-dependent mechanism and interplay with actin regulatory proteins. Int J Mol Sci. 2019;20(11):2745.
- Yin L, Lu Y, Cao C, et al. CA9-related acidic microenvironment mediates CD8+ T cell related immunosuppression in pancreatic cancer. Front Oncol. 2021;11:832315.
- Sung HY, Ju W, Ahn JH. DNA hypomethylation-mediated overexpression of carbonic anhydrase 9 induces an aggressive phenotype in ovarian cancer cells. Yonsei Med J. 2014;55(6):1656–1663.
- Afsharpad M, Nowroozi MR, Mobasheri MB, et al. Cancer-testis antigens as new candidate diagnostic biomarkers for transitional cell carcinoma of bladder. Pathol Oncol Res. 2019;25(1):191–199.
- Chun HK, Chung KS, Kim HC, et al. OIP5 is a highly expressed potential therapeutic target for colorectal and gastric cancers. BMB Rep. 2010;43(5):349–354.
- Chen L, Wang R, Gao L, et al. Opa-interacting protein 5 expression in human glioma tissues is essential to the biological function of U251 human malignant glioma cells. Cancer Control. 2020;27(1):1073274820968914.
- Konner AC, Bruning JC. Toll-like receptors: linking inflammation to metabolism. Trends Endocrinol Metab. 2011;22(1):16–23.
- Fan Y, Yang L, Wei Q, et al. Toll-like receptor 10 (TLR10) exhibits suppressive effects on inflammation of prostate epithelial cells. Asian J Androl. 2019;21(4):393–399.
- Bohni PC, Deshaies RJ, Schekman RW. SEC11 is required for signal peptide processing and yeast cell growth. J Cell Biol. 1988;106(4):1035–1042.
- Wang S, He Z, Wang X, et al. Antigen presentation and tumor immunogenicity in cancer immunotherapy response prediction. Elife. 2019;8:e49020.
- Yarchoan M, Hopkins A, Jaffee EM. Tumor mutational burden and response rate to PD-1 inhibition. N Engl J Med. 2017;377(25):2500–2501.
- Yi M, Li A, Zhou L, et al. Immune signature-based risk stratification and prediction of immune checkpoint inhibitor’s efficacy for lung adenocarcinoma. Cancer Immunol Immunother. 2021;70(6):1705–1719.
- Jardim DL, Goodman A, de Melo Gagliato D, et al. The challenges of tumor mutational burden as an immunotherapy biomarker. Cancer Cell. 2021;39(2):154–173.
- McGrail DJ, Pilie PG, Rashid NU, et al. High tumor mutation burden fails to predict immune checkpoint blockade response across all cancer types. Ann Oncol. 2021;32(5):661–672.
- Amin M, Desai M, Trinkaus K, et al. Phase II trial of levocetirizine with capecitabine and bevacizumab to overcome the resistance of antiangiogenic therapies in refractory metastatic colorectal cancer. J Gastrointest Oncol. 2019;10(3):412–420.
- Illiano M, Sapio L, Salzillo A, et al. Forskolin improves sensitivity to doxorubicin of triple negative breast cancer cells via protein kinase A-mediated ERK1/2 inhibition. Biochem Pharmacol. 2018;152:104–113.