
Abstract
A novel therapeutic regimen showed that the oncolytic type II herpes simplex virus (oHSV2) was able to prevent colorectal cancer growth, recurrence, and metastasis. However, no study has yet explored whether oHSV2 has an impact on the development of diffuse large B-cell lymphoma (DLBCL). We chose the clinical chemotherapeutic drug doxorubicin (DOX) as a positive control to evaluate the effect of oHSV2 infection on the apoptotic, invasive, and proliferative capacity of DLBCL cells. We next further explored the therapeutic efficacy of oncolytic virus oHSV2 or DOX in DLBCL tumor bearing BALB/c mice, and evaluated the infiltration of CD8 + T cells and CD4 + T cells in tumor tissues. A pathological approach was used to explore the effects of oHSV2 on various organs of tumor bearing mice, including the heart, liver, and kidney. Next, SU-DHL-4 cells were co-cultured with cytotoxic T lymphocytes (CTLs) to mimic the tumor immune microenvironment (TME), to explore the impact of oHSV2 on the immune environment at the cellular level, and then analyzed the relationship between oHSV2 and the PD-1/PD-L1 immune-checkpoint. Subsequently, we further validated the efficacy of combined oHSV2 and PD-L1 treatment on transplanted tumor growth in mice at the in vivo level. DLBCL cells were sensitive to the action of the oncolytic virus oHSV2, and the decline in their proliferative activity showed a time-and dose-dependent manner. oHSV2 and DOX intervention preeminently increased the cell apoptosis, restrained cell proliferation and invasion, with the greatest changes occurring in response to oHSV2 infection. oHSV2 application effectively improved the immune status of the tumor microenvironment, favoring the invasion of CD8 + T and CD4 + T cells, thereby enhancing their antitumor effects. Besides, oHSV2 treatment has a safety profile in the organs of tumor bearing mice and indeed inhibits the PD-1/PD-L1 immune checkpoint in DLBCL. Interestingly, the combination of oHSV2 and PD-L1 antibodies results in more profound killing of DLBCL cells than oHSV2 infection alone, with a significant increase in the proportion of CD4 + T cells and CD8 + T cells. The antitumor effect was the best after combining oHSV2 and PD-L1 antibodies, suggesting that the combination therapy of oHSV2 and PD-L1 would have a better prospect for clinical application.
1. Introduction
Diffuse large B-cell lymphoma (DLBCL) is a class of mature B-cell neoplasms with a high degree of aggressiveness and is also the most common type of lymphoma, accounting for approximately 30%–40% of all lymphomas [Citation1]. The incidence of DLBCL is as high as 40%–50% in China, which is higher than its incidence of 30% in western countries [Citation2,Citation3]. Currently, with the advancement of treatment technology and newer iterations of treatment regimens, such as chemoradiotherapy, immunotherapy, and targeted therapy, the progression free survival and overall survival of patients have been significantly improved [Citation4]. The current standard chemotherapy regimen of R-CHOP has resulted in long-term remission in 60–65% of DLBCL patients, but still about 30% will relapse and/or become resistant [Citation5]. Additionally, the remarkable morphological features, immunological phenotype, genetic and clinical heterogeneity of DLBCL create a great impediment to treatment. Therefore, more accurate prognostic stratification as well as more well-established treatment regimens require further exploration and evaluation.
Recently, there has been a rapid rise of studies on the mechanisms of immune escape, with increasing attention focused on immune checkpoints, particularly programmed cell death protein-1 (PD-1/PD-L1), which has marked a new phase in the study of tumor initiation, progression, and treatment [Citation6]. PD-L1 was the first Food and Drug Administration (FDA) approved biomarker for immune checkpoint inhibitors [Citation7]. The use of monoclonal antibodies against PD-1/PD-L1 has a major impact on the prognosis of cancer patients and has become the first choice for second-line treatment of cancer [Citation8]. It has been reported that PD-1 and PD-L1 binding can inhibit the proliferation and survival of cytotoxic T lymphocytes (CTLs) and induce the apoptosis of infiltrating T cells, which leads to the reduced production of cytokines [Citation9]. Furthermore, PD-L1 is highly expressed in most patients with DLBCL, and tumor cells evade immune responses by inhibiting T cell function through upregulation of PD-L1 [Citation10]. Besides, PD-1/PD-L1 monoclonal antibodies (mAbs) can reinvigorate the antitumor activity of CD8 + T cells by blocking signals that inhibit T cells. However, currently targeting one immunosuppressive pathway may not be sufficient for tumor elimination.
Oncolytic virotherapy has recently been recognized as a promising biological therapy in the field of tumor therapy, which mainly applies wild-type or genetically engineered viruses to treat malignant tumors [Citation11]. Vector viruses can be engineered to selectively recognize, infect, and lyse malignant tumor cells with minimal impact on normal cells. For example, Li et al. [Citation12] proposed that oncolytic viruses might eventually provide a therapeutic option for digestive system malignancies. Ishino et al. [Citation13] demonstrated that intra-tumoral injection of the oncolytic virus HSV-1 may be applicable to systemic hematologic malignancies. Accumulating evidence suggests that oncolytic viruses provoke a cascade of antitumor immune responses that result in immunogenicity in the tumor microenvironment and modulation of the immunosuppressive tumor microenvironment. Previous studies have confirmed that oncolytic viral therapy can effectively break immune tolerance in the tumor microenvironment region by blocking immune checkpoints, converting immunosuppressive cells into a proinflammatory phenotype. Wang et al. [Citation14] discovered that oncolytic viruses secrete PD-L1 inhibitors that bind systemically and inhibit PD-L1 on tumor cells and immune cells. However, few reports are currently available on the efficacy and mechanism of oncolytic viruses against DLBCL.
In this study, we used oncolytic type II herpes simplex virus (oHSV2). A previous study found that oHSV2 treatment was effective in eliminating mouse colon primary tumors, generating tumor specific immunity, eliciting immune memory, and inhibiting tumor recurrence and metastasis [Citation15]. From this, to understand the tumor suppressive effect of oHSV2 on DLBCL, as well as the regulation of the tumor microenvironment (TME), we aimed to evaluate the effect of oHSV2 on the growth of DLBCL cells as well as immune cell infiltration in vivo and in vitro.
2. Materials and methods
2.1. Cell culture and treatment
The human DLBCL cell lines SU-DHL-4 and SU-DHL-6 were purchased from Shanghai Institutes for Biological Sciences, Chinese Academy of Sciences (Shanghai, China). SU-DHL-4 and SU-DHL-6 cells in logarithmic growth phase were seeded into Petri dishes and cultured by using DMEM medium (Sigma-Aldrich, USA) supplemented with penicillin, streptomycin and 10% fetal bovine serum under an airtight condition of 5% CO2, 37° C. The solution was changed every two days and passaged around four days. We used an oHSV2, an attenuated active oncolytic type II herpes simplex virus derived from the wild-type II herpes simplex virus (HSV-2 virus strain) HG52 strain. oHSV2, in which the ICP47 gene and the ICP34.5 gene with neurotoxic effects were deleted based on the original strain, was obtained after several screening and purification steps. Subsequently, the suspension of oncolytic virus oHSV2 at MOI = 0.1, MOI = 1, MOI = 2, and MOI = 3 was sequentially added to the cells. SU-DHL-4 cells and CTLs were subjected to in vitro co culture using Transwell. SU-DHL-4 cells were placed in the upper chamber, CTLs cells were placed in the lower chamber, and the two cells were in direct contact.
2.2. Cell transfection
Antibodies against PD-L1 were purchased from Abcam company (Abcam, UK). PD-L1 was transfected into SU-DHL-4 cells by using Lipofectamine®3000 transfection reagent according to the manufacturer’s requirements. SU-DHL-4 cells were used for subsequent experiments 48 h after transfection.
2.3. In vivo experiments
Animal experiments were approved and supervised by the animal ethics committee of Harbin Medical University Cancer Hospital. Ten five-week-old male athymic BALB/C nude mice were obtained from the experimental animal center of Harbin Medical University and randomly divided into 3 groups, including control group, Dox group and oHSV2 group. First, 5 × 10⁵ SU-DHL-4 cells were subcutaneously injected into the peritoneal cavity of mice to establish subcutaneous xenograft tumors in nude mice. For the oHSV2 group, 2 × 10⁶ pfu/100 μL of oHSV2 was injected intraperitoneally daily. For the DOX group, 6 mg/Kg of DOX was injected intraperitoneally daily.
2.4. Cell viability and proliferation assay
SU-DHL-4 and SU-DHL-6 cells in logarithmic growth phase were seeded into 96 well culture plates at a certain density, and different MOI of oHSV2 were added to each well, respectively, according to the grouping, and cultured at 5% CO2, 37 °C. 10 µL of CCK-8 reagent (Sigma-Aldrich, USA) was added to each well at 12, 24, 48, 72 h of incubation. The optical density (OD) value at the wavelength of 450 nm was determined with a microplate reader (Bio-Rad, USA). For the cell viability assay, the mean value measured for the cells of the control group was 100%, and the cell viability of each group was calculated. Cells from different treatments in each group were collected. 4 × 10⁵ cells/well were seeded in culture dishes. The EdU solution was diluted using DMEM medium at a 5000:1 ratio to make an appropriate amount of 50 μmol/L EdU medium. Subsequently, 200 μL of EdU medium was added to the culture dish and incubated for 2 h. After discarding the medium, cells were sequentially incubated with fixative solution (PBS containing 4% paraformaldehyde), glycine and Permeabilizer. After incubation for 30 min in the dark at room temperature with the addition of DAPI reaction solution, anti-fluorescent quencher blocking reagent was added, and the images were observed and acquired under a fluorescence microscope for analysis.
2.5. Cell apoptosis assay
The cells with different treatments in each group were collected. According to the manufacturer, cell suspension and 200 μL of binding buffer were added to 10 μL of annexin V-FITC and 5 μL of PI, protected from light for 15 min after mixing, and then 300 μL of binding buffer was added. The FACScan flow cytometer (Becton Dickinson, USA) was performed using an argon ion laser beam at 488 nm.
2.6. Cell invasion assay
Cells from tumors of mice in logarithmic growth phase was taken and starved for 24 h. Cells were digested resuspended to a concentration of 2 × 10⁵/mL. 0.2 mL of the cell suspension was added to the upper chamber of the Transwell coated with Matrigel, and 700 μL of pre chilled DMEM cell culture with 10% FBS was added to the lower chamber. The Transwell chambers were then placed in an incubator containing 5% CO2, 37 °C, and the cells on the upper chamber and basement membrane were swabbed after 24 h using a wet cotton swab. Subsequently, methanol was used to fix the cells for 30 min, and 0.1% crystal violet was used to stain the cells for 20 min. It was finally observed and photographed under an inverted fluorescence microscope (IX53, Olympus Corp, Tokyo, Japan). Five fields were randomly selected, and the number of membrane penetrating cells was counted.
2.7. Immunohistochemical staining
Tissue sections from tumor were deparaffinized, hydrated, antigen retrieval, serum blocking, incubation of primary antibodies (CD4, CD8, PD-L1, Abcam, USA) and corresponding secondary antibodies, washing, DAB color development, hematoxylin counterstaining, and mounting of the sections were performed sequentially. The number of cells positive for CD4, CD8 and PD-L1 expression was counted in three randomly selected high-power fields per section under the inverted fluorescence microscope (IX53, Olympus Corp, Tokyo, Japan).
2.8. Detection of number of positive cells
Cells from tumors of mice in each group were collected and counted so that the number of cells per flow tube reached 1 × 10⁶ CD4 (5 µL), CD8 (5 µL), or PD-1 (5 µL) fluorescein labeled antibodies (Abcam, UK) were added and incubated for 20 min in the dark after mixing. The cells were centrifuged and then analyzed by a FACScan flow cytometer (Becton Dickinson, USA).
2.9. HE staining
Mouse heart, liver, and kidney tissues from different treatments in each group were collected and fixed using 4% paraformaldehyde at 4 °C for one week. After tissue paraffin embedding and wax block sectioning, hematoxylin, and eosin staining (Thermofisher, USA) was used according to the manufacturer’s requirements. Finally, the slides were blocked after dehydration by using ethanol, and then the staining was observed under an inverted fluorescence microscope (IX53, Olympus Corp, Tokyo, Japan). We used a microscopic color image processing system (DpxView Pro, Korea) to calculate the fibrotic area of the cardiac tissue. Based on the Suzuki score, the pathological damage of liver tissue seen under the microscope was quantified from congestion, vacuolar degeneration, necrosis, and their damage degree, so as to evaluate liver injury from the pathological perspective more objectively and reasonably. The highest score was 4 and the lowest score was 0. The higher the score, the more serious the injury. In addition, the glomerular volume in the renal tissue was calculated and quantified by a microscopic color image processing system (DpxView Pro, Korea).
2.10. Biochemical parameter assay
Vein blood of 3 mL was collected from mice and allowed to stand for 30 min before centrifugation, and the serum was aspirated and stored at −80 °C. Biochemical parameters, including alanine aminotransferase (ALT), aspartate aminotransferase (AST), blood urea nitrogen (BUN) and blood creatinine (CREA), were measured in mouse serum samples using a fully automated biochemical analyzer (AU400, Olympus, Japan) according to the manufacturer’s instructions (Oulebo Medical devices, Shandong, China). In brief, 100 μL of the sample was injected into the sample tank, and the rear hatch door opened automatically by clicking the screen “Analyze,” and then place the reagent tray in the appropriate position and click to close the hatch. Mice grouping information was entered according to the prompts. Finally, the test results will be automatically printed and recorded after the test is finished.
2.11. Creatine kinase isoenzyme MB (CK-MB) and cardiac troponin I (cTnI) determination
Vein blood of 3 mL was collected from mice and allowed to stand for 30 min before centrifugation, and the serum was aspirated and stored at −80 °C. The CK-MB and cTnI in the stored serum were centrally monitored by Enzyme-linked immunosorbent assay (ELISA, Shanghai Yanhui Biotechnology Co., Ltd, Shanghai, China). The specific operation steps were carried out according to the instructions of the kit.
2.12. Western blotting
Mouse tumor tissues or cells were washed 2 times with cold PBS and lysed according to the application in RIPA lysis buffer (Roche Diagnostics, Basel, Switzerland) filled with protease inhibitors. The protein concentration values were then accurately measured according to the BCA protein assay kit (Thermo Fisher, USA). Equal proteins were subjected to 10% SDS-PAGE at 70 V for 30 min, followed by 90 min at 120 V. Protein heterobands migrated to PVDF membranes at 300 Ma for 2 h, and membranes were subsequently blocked in 5% low-fat milk for 2 h. Subsequently, the membrane was incubated with horseradish peroxidase (HRP)-conjugated dairy goat anti-rabbit IgG for 1 h at room temperature. β-actin served as an endogenous contrast. The information of antibodies was listed in Supplementary Table S1. Hetero-band data were visualized according to the application of the ECL Plus Electrochemiluminescence Detection Kit (Pierce, Rockford, IL, USA) and photographed according to the Electrochemiluminescence 3D Imaging System software. Image J mobile phone software was used to quantify and analyze the relative density of spurious bands.
2.13. RT-qPCR
Tumor tissue samples from mice in each group were collected, and Trizol (ThermoFisher, USA) was added to extract total cellular RNA according to the instructions of total RNA extraction reagent. After measurement of A260/A280 between 1.8 and 2.0. Total cellular RNA was reverse transcribed into cDNA using a reverse transcription Kit (Qiagen, Germany), with a 20 μL of reverse transcription reaction system including 0.2 μL of MMLV (200 U/μL), 1.2 μL of miR-RT primer (1 μmol/L), 0.75 μL of dNTP (10 mmol/L), 4 μL of 5 × RT buffer, 10 μL of total RNA and 3.85 μL of RNase free ddH2O. This cDNA was then used as a template for PD-L1 amplification on Bio-Rad CFX90 Real time PCR. RT-PCR reaction conditions: pre denaturation at 95° C for 30 s, 39 cycles of denaturation at 95° C for 5 s, annealing at 60° C for 5 s, and extension at 65° C for 5 s. The efficiency of the PCR should be between 90 and 110% (3.6 > slope > 3.1). GAPDH was used as an internal reference and relative expression levels were calculated by using the 2−ΔΔCT method. The sequences were as follows: PD-L1 forward, 5′-TTCCCTCAGCAGCCTCCTAT-3′, and reverse, 5′-GCAACTGGGCTTCCTCTCAT-3′.
2.14. Cytotoxicity assay
T cell cytotoxicity was checked by LDH cytotoxicity Kit (Biovision, USA) following the manufacturer’s instructions. Untouched CD8+ T cells were isolated using the CD8+ T Cell Isolation Kit (Miltenyi biotec, Germany) and quantified using a Vi-CELL XR (Beckman Coulter). Five thousand SU-DHL-4 cells were seeded in triplicates in a 96-well flat bottom plate and cocultured with 50,000 CD8+ T cells. Cytotoxicity = [1 − (ODCase – ODeffector cell)/ODtarget cell] × 100%.
2.15. CD8+ T cell proliferation assay
Untouched CD8+ T cells were isolated using the CD8+ T Cell Isolation Kit (Miltenyi) and quantified using a Vi-CELL XR (Beckman Coulter). CD8 + T cells were cultured in medium containing 10% fetal bovine serum (GIBCO, Carlsbad, CA), and isolated CD8 + T cells were labeled with the reactive dye carboxyfluorescein diacetate succinimidyl ester (CFSE; Invitrogen, USA) at a final concentration of 0.5 mm for 15 min. Finally, CFSE intensity was analyzed using FACScan flow cytometer (Becton Dickinson, USA).
2.16. Bioinformatics analysis
The relevant data of lymphoma tissues were screened based on GEPIA database (http://gepia.cancer-pku.cn/), and the expression difference of PD-L1 in lymphoma tissues and adjacent tissues was analyzed combined with other relevant literature research. GEPIA is an online database, and its various analysis results are derived from the original data in the TCGA database. The expression levels and gene correlation of key genes in tumor tissues and normal tissues were analyzed to further verify the relationship between key genes and the occurrence and development of lymphoma. We are very sorry that we did not describe clearly in the paper.
2.17. Granzyme-B and Perforin determination
The concentrations of Granzyme-B and Perforin produced by CD8 + T cells were measured by ELISA kits (eBioscience, USA) in accordance with the manufacturer’s guidelines.
2.18. Statistical analysis
Data are processed using SPSS 22.0 statistical software and presented as the mean ± SEM of results from at least three independent experiments. Student’s t-test was used for the comparison of two sample means. Differences among more than two groups in the above assays were estimated using one-way ANOVA, with p < .05 considered significant.
3. Results
3.1. Effect of oHSV2 at different multiplicity of infection on the viability of DLBCL cells
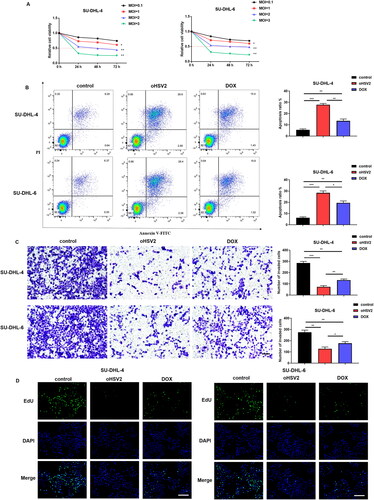
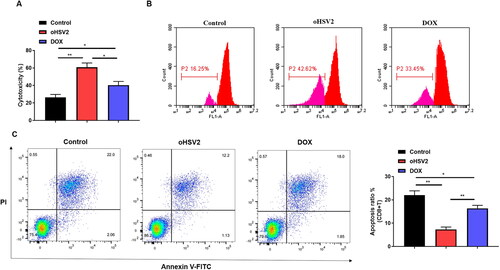
Firstly, we validated the oncolytic capacity of the oncolytic virus oHSV2 against the human DLBCL cell lines SU-DHL-4 and SU-DHL-6 in vitro. To assess whether the activity of SU-DHL-4 and SU-DHL-6 cells was altered at different multiplicities of infection (MOI) of oHSV2, we used the CCK-8 assay kit to measure cell viability of DLBCL cells after infection with oncolytic virus oHSV2. The results in suggest that SU-DHL-4 and SU-DHL-6 cells are sensitive to the action of oncolytic virus oHSV2, and the decline in their proliferative activity showed a time - and dose-dependent manner. At a MOI of 2 with oHSV2, the viability of DLBCL cells was already reduced by about 50% at 48 h. Subsequently, we selected doxorubicin (DOX), a clinical chemotherapeutic agent [Citation16], as a positive control to further evaluate the effect of oHSV2 infection on the apoptotic, invasive, and proliferative capacity of DLBCL cells. The results in illustrate that both oHSV2 and DOX treatment prominently increased the apoptotic rate of DLBCL cells, with the greatest increase occurring in response to oHSV2 infection. The results of Transwell assay revealed that the number of invaded cells was observably decreased after oHSV2 and DOX treatment, suggesting that the effect of oHSV2 infection was consistent with DOX treatment (). Furthermore, the EdU staining results illustrated that the cell proliferation ability was materially reduced after oHSV2 or DOX treatment, reflected by reduced green fluorescence, of which the fluorescence intensity of oHSV2 infection was the weakest ().
Figure 1. Effect of oHSV2 at different multiplicity of infection on the viability of DLBCL cells. (A) CCK-8 assay assessment of the effect of oHSV2 at various MOI on the viability of SU-DHL-4 and SU-DHL-6 cells at 0, 24, 48, and 72 h, two-way ANOVA. (B) Flow cytometry assessment of the apoptosis of SU-DHL-4 and SU-DHL-6 cells under oHSV2 or DOX treatment, one-way ANOVA and t-test. (C) Transwell assay assessment of the invasion ability of SU-DHL-4 and SU-DHL-6 cells under oHSV2 or DOX treatment, scale bar: 100 μm, one-way ANOVA and t-test. (D) EdU staining assessment of the proliferation ability of SU-DHL-4 and SU-DHL-6 cells under oHSV2 or DOX treatment, scale bar: 100 μm. Images were viewed using an inverted fluorescence microscope (#IX53, Olympus Corp, Tokyo, Japan) and captured by Image-ProPlus 5.1 Chinese. *p<.05, **p<.01, ***p<.001 vs control group. n = 3.
3.2. oHSV2 potently inhibits transplanted tumor growth and accelerates CD4 + T and CD8 + T cell infiltration in mice
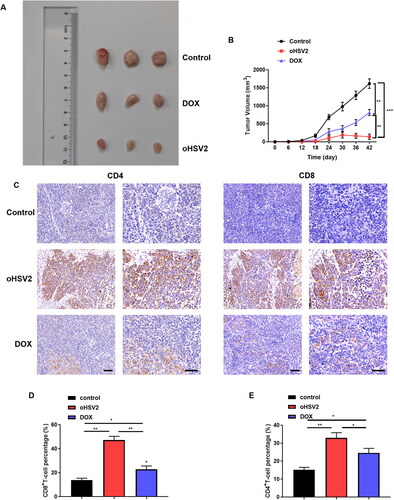
Next, we initially explored the therapeutic effect of oncolytic virus oHSV2 or chemotherapeutic drug DOX on mouse DLBCL tumor bearing model in BALB/c mice tumor bearing animal model. The long and short diameters of tumors in mice in each group were observed and recorded every six days, the tumor volume was calculated, and the tumor volume was plotted as a function of time. The growth of tumor volume in mice treated with DOX was slowed down but still showed a gradually increasing trend over time, while the tumor volume in mice injected with oncolytic virus oHSV2 showed a short-term increasing trend in the initial stage and was gradually decreased thereafter (). Subsequently, to further demonstrate whether the administration of the oncolytic virus oHSV2 altered the immune microenvironment of the tumor, we immunohistochemically labeled the tumor tissues after oHSV2 treatment with antibodies against CD8 + T and CD4 + T cells. The results suggested that the distribution of CD8 + T cells and CD4 + T cells in the tumors of mice treated with oHSV2 was higher than that in the other two groups (). In addition, flow cytometry was further applied to determine the percentages of the two immune cells in the tumor, which showed that the percentages of CD8 + T and CD4 + T cells in the tumor tissues were preeminently increased after oHSV2 treatment compared with the control group and DOX group (). The above results revealed that oHSV2 application effectively improved the immune status of the tumor microenvironment, favoring the invasion of CD8 + T and CD4 + T cells, thereby enhancing their antitumor effects.
Figure 2. oHSV2 potently inhibits transplanted tumor growth and accelerates CD4 + T and CD8 + T cell infiltration in mice. (A) Representative images of DLBCL tumors after 42 days of oHSV2 or DOX treatment. (B) Volume changes of mouse tumors at days 0–42 after oHSV2 or DOX treatment, two-way ANOVA. (C) Immunohistochemistry assessment of the expression of antibodies against CD8 + T and CD4 + T cells in the tumor tissues of mice after oHSV2 or DOX treatment, CD8 and CD4 are both T cell membrane labeling, scale bar: 50 μm. (D) Flow cytometry assessment of the percentages of CD8 + T cells in the tumor tissues of mice after oHSV2 or DOX treatment, one-way ANOVA and t-test. (E) Flow cytometry assessment of the percentages of CD4 + T cells in the tumor tissues of mice after oHSV2 or DOX treatment, one-way ANOVA and t-test. *p<.05, **p<.01, ***p<.001 vs control group. n = 8.
3.3. Safety of oHSV2 treatment in various organs of tumor bearing mice
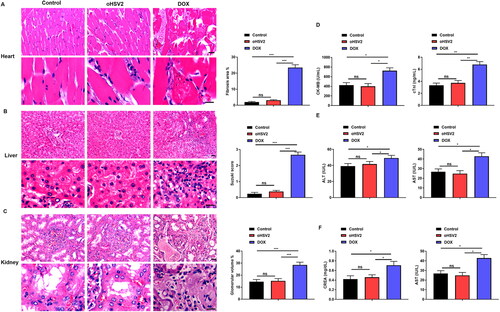
Through the above experiments, we have demonstrated that the oncolytic virus oHSV2 has an obvious killing effect on DLBCL cells and tumors, but the safety of oHSV2 remains to be determined. Additionally, many clinical applications have revealed that the use of DOX is limited by significant cardiotoxicity, nephrotoxicity, and hepatotoxicity. Therefore, we next used pathological methods to explore the effect of oncolytic virus oHSV2 on various organs of tumor bearing mice and evaluated the therapeutic safety of oncolytic virus oHSV2. The important organs, including heart, kidney, and liver, of the tumor bearing mice in each group were collected, and 3–5 μm sections were prepared for HE staining. The organs of each group were observed microscopically and compared. As shown in , minor damage to the heart, kidney, and liver could be observed in the DOX group, and the fibrotic area of the heart tissue, Suzuki score of liver tissue and glomerular hyperplasia were significantly increased compared with the control group, whereas no obvious abnormalities were observed in the mouse heart, kidney, and liver in the oHSV2 treated group and the control group. Therefore, oncolytic virus oHSV2 can be considered biosafety. Subsequently, we further evaluated the liver, kidney, and heart function of mice, in which the liver function indexes included ALT and AST, and the kidney function indexes included BUN and CREA, as well as the cardiac function indexes included CK-MB and cTnI. The results showed a significant elevation of CK-MB, cTnI, ALT, AST, BUN, and CREA in the DOX treated group, whereas CK-MB, cTnI, ALT, AST, BUN, and CREA in the oHSV2 treated group remained the same as the control group (). These results indicate that oHSV2 treatment has a safety profile in the organs of tumor bearing mice.
Figure 3. Safety of oHSV2 treatment in various organs of tumor bearing mice. (A) HE staining assessment of the pathological changes in the heart tissues of mice after oHSV2 or DOX treatment, Fibrosis area was calculated using a microscopic color image processing system (DpxView Pro, Korea), scale bar: 25 μm, one-way ANOVA and t-test. (B) HE staining assessment of the pathological changes in the kidney tissues of mice after oHSV2 or DOX treatment, the Suzuki score was used to quantify the pathological changes of liver tissue in terms of congestion, vacuolar degeneration, necrosis and the degree of injury, scale bar: 25 μm, one-way ANOVA and t-test. (C) HE staining assessment of the pathological changes in the liver tissues of mice after oHSV2 or DOX treatment, the volume of glomeruli in renal tissue was calculated and quantified by a microscopic color image processing system, scale bar: 25 μm, one-way ANOVA and t-test. (D) ELISA assessment of the levels of CK-MB and cTnI in the serum of mice after oHSV2 or DOX treatment, one-way ANOVA and t-test. (E) Automatic biochemical analyzer detection of the levels of ALT and AST in the serum of mice after oHSV2 or DOX treatment, one-way ANOVA and t-test. (F) Automatic biochemical analyzer detection of the level of BUN and CREA in the serum of mice after oHSV2 or DOX treatment, one-way ANOVA and t-test. ns p>.05, *p<.05, **p<.01, ***p<.001. n = 8.
3.4. oHSV2 can inhibit the PD-1/PD-L1 immune-checkpoint
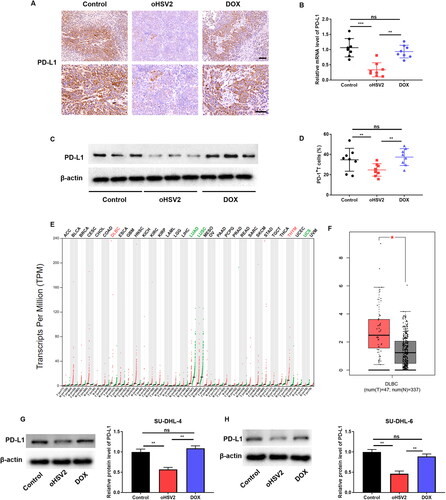
We next further analyzed the relationship between oHSV2 and the PD-1/PD-L1 immune-checkpoint. Firstly, immunohistochemistry was applied to examine PD-L1 positivity in mouse tumors, and the results suggested that PD-L1 positive staining was strikingly attenuated in the oHSV2 treatment group compared with the control and DOX groups (). Furthermore, RT-qPCR and Western blotting results similarly showed an approximately three-fold reduction in PD-L1 expression after oHSV2 treatment (). Interestingly, we discovered that the proportion of PD-L + T cells was also decreased after oHSV2 treatment (). Subsequently, we discovered that PD-L1 was abnormally highly expressed in some tumors by GEPIA website analysis, including DLBCL and thymoma (THYM). And PD-L1 was remarkably under-expressed in some tumors, including lung adenocarcinoma (LUAD), and uterine carcinosarcoma (UCS) (). In particular, we found that PD-L1 expression was conspicuously higher in tissues from 47 DLBCL tumor patients than in 337 normal tissues (). Next, we aimed to validate the regulation of PD-L1 expression upon oHSV2 infection at the cellular level. Western blotting results suggested that PD-L1 expression was observably downregulated in DLBCL cells infected with oHSV2 but not DOX (). These data demonstrate that oHSV2 treatment can indeed inhibit the PD-1/PD-L1 immune checkpoint in DLBCL.
Figure 4. oHSV2 can inhibit the PD-1/PD-L1 immune-checkpoint. (A) Immunohistochemical evaluation of PD-L1-positive rate in tumor tissues of mice after oHSV2 or DOX treatment, scale bar: 50 μm, n = 8. (B) RT-qPCR evaluation of PD-L1 mRNA level in tumor tissues of mice after oHSV2 or DOX treatment, non-paired t-test, n = 8. (C) Western blotting evaluation of PD-L1 protein level in tumor tissues of mice after oHSV2 or DOX treatment, n = 8. (D) Flow cytometry assessment of the percentages of PD-L + T cells in the tumor tissues of mice after oHSV2 or DOX treatment, non-paired t-test, n = 8. (E) The PD-L1 expression profile across all tumor samples and paired normal tissues (dot plot), each dots represent expression of samples. (F) Based on GEPIA database, the expression of PD-L1 in in tissues from 47 DLBCL tumor patients and 337 normal tissues, non-paired t-test. (G) Western blotting evaluation of PD-L1 protein level in SU-DHL-4 cells after oHSV2 or DOX treatment, one-way ANOVA and t-test, n = 3. (H) Western blotting evaluation of PD-L1 protein level in SU-DHL-6 cells after oHSV2 or DOX treatment, one-way ANOVA and t-test, n = 3. nsp>.05, **p<.01, ***p<.001. n = 6.
3.5. oHSV2 restrains cytotoxic T lymphocyte (CTL) apoptosis and encourages cell proliferation by inhibiting the PD-1/PD-L1 immune-checkpoint on DLBCL cells
Subsequently, SU-DHL-4 cells were co-cultured with CTLs to mimic the TME, to explore the impact of oHSV2 on the immune environment at the cellular level. The results showed that CTL cytotoxicity was obviously enhanced after oHSV2 infection of SU-DHL-4 cells compared with the control group and DOX treated group (). Furthermore, proliferation of CD8 + T cells, as measured by CFSE staining assay, was remarkably enhanced after oHSV2 infection of DLBCL cells (). Similarly, flow cytometry results suggested that the apoptosis level of CD8 + T cells was markedly attenuated after oHSV2, but not DOX, treatment of SU-DHL-4 cells ().
Figure 5. oHSV2 restrains cytotoxic T lymphocyte (CTL) apoptosis and encourages cell proliferation by inhibiting the PD-1/PD-L1 immune-checkpoint on DLBCL cells. (A) LDH cytotoxicity kit evaluation of cytotoxicity of CD8+ T cells after co-culture of CD8 + T and SU-DHL-4 cells under oHSV2 or DOX treatment, one-way ANOVA and t-test. (B) CFSE staining assay evaluation of CD8+ T cell proliferation after co-culture of CD8 + T and SU-DHL-4 cells under oHSV2 or DOX treatment. (C) Flow cytometry evaluation of CD8+ T cell apoptosis after co-culture of CD8 + T and SU-DHL-4 cells under oHSV2 or DOX treatment, one-way ANOVA and t-test. *p<.05, **p<.01 vs control group. n = 3.
3.6. Effect of oHSV2 in combination with PD-1/PD-L1 immune-checkpoint inhibitors on DLBCL cell behavior
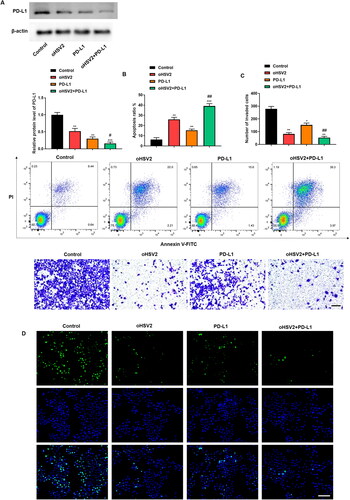
Next, we sought to combine oHSV2 and PD-L1 antibodies at the cellular level and observe their effects on DLBCL cell behavior. results illustrated that PD-L1 antibody transfection significantly inhibited PD-L1 protein levels, and the inhibitory effect was more significant than that of oHSV2 infection, whereas the combination of oHSV2 and PD-L1 reduced PD-L1 protein levels by up to approximately five-fold. Subsequently we further analyzed cell proliferation, apoptosis, and invasion. The results displayed that the combination of oHSV2 and PD-L1 inhibited the proliferation and invasion of DLBCL cells as well as facilitated the apoptosis more prominently than oHSV2 alone (). These data demonstrate that the combination of oHSV2 and PD-L1 antibodies results in more profound killing of DLBCL cells than oHSV2 infection alone.
Figure 6. Effect of oHSV2 in combination with PD-1/PD-L1 immune-checkpoint inhibitors on DLBCL cell behavior. (A) Western blotting assessment of the PD-L1 protein level in SU-DHL-4 cells under oHSV2 or/and PD-L1 antibodies treatment, one-way ANOVA and t-test. (B) Flow cytometry assessment of the apoptosis ability of SU-DHL-4 cells under oHSV2 or/and PD-L1 antibodies treatment, one-way ANOVA and t-test. (C) Transwell assessment of the invasion ability of SU-DHL-4 cells under oHSV2 or/and PD-L1 antibodies treatment, scale bar: 100 μm, one-way ANOVA and t-test. (D) EdU staining assessment of the proliferation ability of SU-DHL-4 cells under oHSV2 or/and PD-L1 antibodies treatment, scale bar: 100 μm. *p<.05, **p<.01, ***p<.001 vs control group. #p<.05, ##p<.01 vs oHSV2 or PD-L1 group. n = 3.
3.7. Combination of oHSV2 and PD-L1 conspicuously inhibited transplanted tumor growth in mice
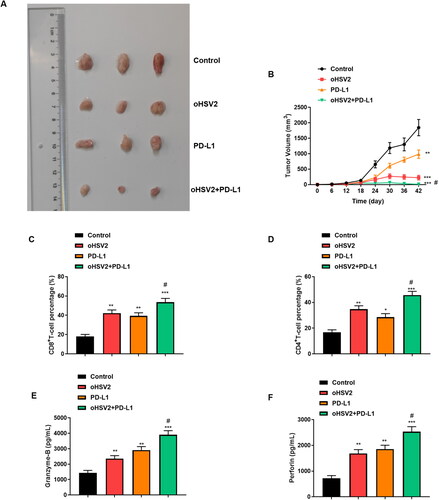
Subsequently, we further validated the efficacy of combined oHSV2 and PD-L1 treatment on transplanted tumor growth in mice at the in vivo level. From the experimental results, we can observe that the combination of oHSV2 and PD-L1 resulted in the most significant inhibition of DLBCL tumors compared with oHSV2 and PD-L1 alone, and complete tumor regression was observed in one mouse (). Furthermore, the proportion of CD4 + T cells CD8 + T cells in tumor tissues was determined using flow cytometry. The results suggested that the proportion of T lymphocytes CD4 + T cells and CD8 + T cells reflecting immune activation function in vivo were significantly increased in tumor bearing mice compared with those treated with oHSV2 alone (). In addition, we evaluated the levels of granzyase-B and Perforin in serum and showed that the levels of the cytokines Granzyme-B and Perforin secreted by CD8 + T cells were significantly increased after oHSV2 and PD-L1 treatment alone. However, the expression of granzyme-B and Perforin was further increased after oHSV2 and PD-L1 combined treatment ().
Figure 7. Combination of oHSV2 and PD-L1 conspicuously inhibited transplanted tumor growth in mice. (A) Representative images of DLBCL tumors after 42 days of oHSV2 or/and PD-L1 antibody treatment. (B) Volume changes of mouse tumors at days 0–42 after oHSV2 or/and PD-L1 antibody treatment, two-way ANOVA. (C) Flow cytometry assessment of the percentages of CD8 + T cells in the tumor tissues of mice after oHSV2 or/and PD-L1 antibody treatment, one-way ANOVA and t-test. (D) Flow cytometry assessment of the percentages of CD4 + T cells in the tumor tissues of mice after oHSV2 or/and PD-L1 antibody treatment, one-way ANOVA and t-test. (E) ELISA assessment of the contents of Granzyme-B in the serum of mice after oHSV2 or/and PD-L1 antibody treatment, one-way ANOVA and t-test. (F) ELISA assessment of the contents of Perforin in the serum of mice after oHSV2 or/and PD-L1 antibody treatment, one-way ANOVA and t-test. *p<.05, **p<.01, ***p<.001 vs control group. #p<.05 vs oHSV2 or PD-L1 group. n = 8.
4. Discussion
DLBCL is the most common non-Hodgkin’s lymphoma, and its incidence is rising year by year [Citation17]. DLBCL is a highly heterogeneous and aggressive tumor with great differences in morphology, genetics, and biological behavior [Citation18]. DLBCL can occur anywhere in the body, with lymph nodes, tonsils, spleen, and bone marrow being the most vulnerable sites, since lymph nodes and lymphoid tissues are all over the body and communicate with the monocyte macrophage system and hematological system [Citation19]. Although many patients can lose their lesions after being treated with a ‘standardized R-CHOP’ regimen, a subset of cases will still present with an enlarging lesion that makes it difficult to treat. Besides, only 30%–40% of patients respond to salvage chemotherapy. It is therefore of great importance to discover more effective and specific therapeutic approaches to inhibit and attack metastatic growth.
In recent years, as immunotherapy and biological therapy become more widely used in the field of tumor treatment, oncolytic virotherapy has also received more and more attention [Citation20]. Oncolytic virotherapy is a novel cancer treatment, and oncolytic viruses, with their unique characteristics, offer a new research direction in immunotherapy, providing a new alternative to improve the prognosis of patients with tumors as well as to improve the survival rate of patients [Citation21]. T-VEC, an HSV-1 oncolytic virus from Amgen, was officially approved by the FDA of the United States of America in October 2015 as a locoregional treatment for unresectable lesions in patients with malignant melanoma who have relapsed after first surgery, the first FDA approved oncolytic virus-based therapy [Citation22]. In accordance with this, the safety and potential effects of oncolytic viruses are gradually being recognized. The tumor killing effect of oncolytic virus oHSV2 has been demonstrated by Zhang et al. [Citation23], and the data suggested that oHSV2 could effectively kill primary tumors and attack distant and metastatic tumors by inducing an immune response. The results of the present study found that oHSV2 potently inhibited the growth of subcutaneous primary tumors, as well as the proliferation and invasion of DLBCL cells, compared with the control group, and the effect was more significant than that in the DOX-treated group. DOX has been reported to exert strong antitumor effects and can successfully induce apoptosis in a variety of malignancies, including acute leukemia, DLBCL, breast, lung, ovarian, sarcoma, bladder, thyroid, prostate, head and neck squamous cell carcinoma, testicular, gastric, liver, and others [Citation24–27]. However, its application in clinic is limited by significant cardiotoxicity, nephrotoxicity, and hepatotoxicity due to the lack of targeting of DOX to tumors [Citation28–30]. According to previous studies, oncolytic viruses can selectively infect tumor cells, but not harm normal cells. To confirm the safety of oHSV2, we performed pathological analyses of mouse heart, liver, and kidney tissues after oHSV2 infection. It was found that oHSV2 did not cause pathologically visible damage to all organs of the mice while exerting its tumor killing utility. Taken together with the good mental status, healthy fur gloss, and normal physiological metabolic activities of the tumor bearing mice throughout their survival, we can think that oHSV2 is safe for the treatment of DLBCL tumor bearing mice.
Emerging studies confirm that oncolytic virus treatment of tumor prematurity does not solely rely on its direct oncolytic effect, but on the activation of an organism specific antitumor immune response on the basis of oncolysis [Citation31]. In addition to stimulating the maturation of dendritic cells, local inflammatory changes induced by infection with oncolytic viruses promote the trafficking of dendritic cells to the spleen and local lymph nodes, which can present tumor associated antigens to T cells, cause the infiltration of antitumor CD4 + T and CD8 + T cells, and then specifically kill tumor cells [Citation32]. In the present study, the number of CD4 + T and CD8 + T cells in tumor tissues was increased in mice inoculated with DLBCL cells that were treated with oncolytic virus oHSV2, suggesting that oHSV2 was able to accelerate the invasion of CD4 + T and CD8 + T cells into tumors. Recently, the study of immune escape mechanisms represented by PD-1/PD-L1 has been developed rapidly. In which PD-L1 can bind to PD-1 expressed on T cells to generate a co inhibitory signal that inhibits T cell receptor (TCR) downstream signals, inducing T cell exhaustion and tolerance, thus avoiding elimination by the human immune system [Citation33]. Most of the patients’ tumor tissues expressed PD-L1 to various degrees, and the expression of CD4, CD8, and PD-1 was checked in the peritumoral infiltrating lymphocytes. The study by Kwon et al. [Citation34] highlighted a potential relationship between PD-L1 level and DLBCL prognosis. Recently Kim et al. [Citation35] conducted the largest study to date on PD-L1 versus DLBCL sample size, analyzed the prognostic impact in experimental and validation cohorts and according to treatment modality, and determined that tumor PD-L1 expression was an independent prognostic indicator of poor overall survival. Besides, Woo et al. [Citation36] found that a novel oncolytic virus could efficiently infect and kill human pancreatic ductal adenocarcinoma and produce functional anti-PD-L1 antibodies. Storey et al. [Citation37] demonstrated that oncolytic virus therapy exerts antitumor effects through an adaptive immunosuppressive mechanism involving the PD-1/PD-L1 checkpoint pathway. Similarly, the present study discovered that PD-L1 was strongly expressed in murine DLBCL xenografts, whereas its expression level was conspicuously reduced after oHSV2 treatment. Presumably, oHSV2 prevented tumor cells from undergoing immune escape by inhibiting the PD-1/PD-L1 immune-checkpoint. However, while oncolytic virotherapy holds great potential, the targets that can be achieved as monotherapy are limited. Therefore, we sought to find rational combination therapies that could further enhance the antitumor efficacy of oncolytic viruses. After transplanting tumors in mice treated with combined oHSV2 and PD-L1 antibodies, we discovered that the proportions of CD4 + T cells and CD8 + T cells, which reflect the in vivo immune activation function, were conspicuously increased in tumor bearing mice compared with mice treated with oHSV2 alone, and the tumor size was strikingly smaller or even disappeared.
Taken together, this study confirmed that the decreased PD-L1 level by lymphocytes and immune cells surrounding the tumor tissue after oHSV2 treatment could be explained to some extent by the fact that the patients had an immune capacity against the tumor that could kill tumor cells. And, the antitumor effect was the best after combining oHSV2 and PD-L1 antibodies. Therefore, the combination therapy of oHSV2 and PD-L1 will have a better prospect of clinical application.
Supplemental Material
Download MS Word (15.4 KB)Disclosure statement
No potential conflict of interest was reported by the author(s).
Data availability statement
The datasets used during the present study are available from the corresponding author upon reasonable request.
Additional information
Funding
References
- Li S, Young KH, Medeiros LJ. Diffuse large B-cell lymphoma. Pathology. 2018;50(1):1–13.
- Kanas G, Ge W, Quek RGW, et al. Epidemiology of diffuse large B-cell lymphoma (DLBCL) and follicular lymphoma (FL) in the United States and Western Europe: population-level projections for 2020-2025. Leuk Lymphoma. 2022;63(1):54–63.
- Wang S, Wang L, Hu J, et al. Outcomes in refractory diffuse large B-cell lymphoma: results from a multicenter real-world study in China. Cancer Commun. 2021;41(3):229–239.
- He MY, Kridel R. Treatment resistance in diffuse large B-cell lymphoma. Leukemia. 2021;35(8):2151–2165.
- Mondello P, Mian M. Frontline treatment of diffuse large B-cell lymphoma: beyond R-CHOP. Hematol Oncol. 2019;37(4):333–344.
- Ai L, Xu A, Xu J. Roles of PD-1/PD-L1 pathway: signaling, cancer, and beyond. Adv Exp Med Biol. 2020;1248:33–59.
- Yi M, Zheng X, Niu M, et al. Combination strategies with PD-1/PD-L1 blockade: current advances and future directions. Mol Cancer. 2022;21(1):28.
- Dermani FK, Samadi P, Rahmani G, et al. PD-1/PD-L1 immune checkpoint: potential target for cancer therapy. J Cell Physiol. 2019;234(2):1313–1325.
- Majidpoor J, Mortezaee K. The efficacy of PD-1/PD-L1 blockade in cold cancers and future perspectives. Clin Immunol. 2021;226:108707.
- Cioroianu AI, Stinga PI, Sticlaru L, et al. Tumor microenvironment in diffuse large B-cell lymphoma: role and prognosis. Anal Cell Pathol. 2019;2019:8586354.
- Ylösmäki E, Cerullo V. Design and application of oncolytic viruses for cancer immunotherapy. Curr Opin Biotechnol. 2020;65:25–36.
- Li Q, Oduro PK, Guo R, et al. Oncolytic viruses: immunotherapy drugs for gastrointestinal malignant tumors. Front Cell Infect Microbiol. 2022;12:921534.
- Ishino R, Kawase Y, Kitawaki T, et al. Oncolytic virus therapy with HSV-1 for hematological malignancies. Mol Ther. 2021;29(2):762–774.
- Wang G, Kang X, Chen KS, et al. An engineered oncolytic virus expressing PD-L1 inhibitors activates tumor neoantigen-specific T cell responses. Nat Commun. 2020;11(1):1395.
- Zhang W, Hu X, Liang J, et al. oHSV2 Can Target Murine Colon Carcinoma by Altering the Immune Status of the Tumor Microenvironment and Inducing Antitumor Immunity. Mol Ther Oncolytics. 2020;16:158–171.
- Lai C, Cole DE, Steinberg SM, et al. Doxorubicin pharmacokinetics and toxicity in patients with aggressive lymphoma and hepatic impairment. Blood Adv. 2023;7(4):529–532.
- Jiang M, Bennani NN, Feldman AL. Lymphoma classification update: b-cell non-Hodgkin lymphomas. Expert Rev Hematol. 2017;10(5):405–415.
- Crombie JL, Armand P. Diffuse large B-cell lymphoma and high-grade B-cell lymphoma: genetic classification and its implications for prognosis and treatment. Hematol Oncol Clin North Am. 2019;33(4):575–585.
- Xu PP, Huo YJ, Zhao WL. All roads lead to targeted diffuse large B-cell lymphoma approaches. Cancer Cell. 2022;40(2):131–133.
- Kaufman HL, Kohlhapp FJ, Zloza A. Oncolytic viruses: a new class of immunotherapy drugs. Nat Rev Drug Discov. 2015;14(9):642–662.
- Mondal M, Guo J, He P, et al. Recent advances of oncolytic virus in cancer therapy. Hum Vaccin Immunother. 2020;16(10):2389–2402.
- Bommareddy PK, Patel A, Hossain S, et al. Talimogene laherparepvec (T-VEC) and other oncolytic viruses for the treatment of melanoma. Am J Clin Dermatol. 2017;18(1):1–15.
- Zhang W, Zeng B, Hu X, et al. Oncolytic herpes simplex virus type 2 can effectively inhibit colorectal cancer liver metastasis by modulating the immune status in the tumor microenvironment and inducing specific antitumor immunity. Hum Gene Ther. 2021;32(3-4):203–215.
- Carvalho C, Santos RX, Cardoso S, et al. Doxorubicin: the good, the bad and the ugly effect. Curr Med Chem. 2009;16(25):3267–3285.
- Meredith AM, Dass CR. Increasing role of the cancer chemotherapeutic doxorubicin in cellular metabolism. J Pharm Pharmacol. 2016;68(6):729–741.
- Paskeh MDA, Saebfar H, Mahabady MK, et al. Overcoming doxorubicin resistance in cancer: siRNA-loaded nanoarchitectures for cancer gene therapy. Life Sci. 2022;298:120463.
- Sun Z, Zhou D, Yang J, et al. Doxorubicin promotes breast cancer cell migration and invasion via DCAF13. FEBS Open Bio. 2022;12(1):221–230.
- Grant MKO, Seelig DM, Sharkey LC, et al. Sexual dimorphism of acute doxorubicin-induced nephrotoxicity in C57Bl/6 mice. PLoS One. 2019;14(2):e0212486.
- Prasanna PL, Renu K, Valsala Gopalakrishnan A. New molecular and biochemical insights of doxorubicin-induced hepatotoxicity. Life Sci. 2020;250:117599.
- Songbo M, Lang H, Xinyong C, et al. Oxidative stress injury in doxorubicin-induced cardiotoxicity. Toxicol Lett. 2019;307:41–48.
- Raja J, Ludwig JM, Gettinger SN, et al. Oncolytic virus immunotherapy: future prospects for oncology. J. Immunother. Cancer. 2018;6:140.
- Liu W, Liu Y, Hu C, et al. Cytotoxic T lymphocyte-associated protein 4 antibody aggrandizes antitumor immune response of oncolytic virus M1 via targeting regulatory T cells. Int J Cancer. 2021;149(6):1369–1384.
- Jiang Y, Chen M, Nie H, et al. PD-1 and PD-L1 in cancer immunotherapy: clinical implications and future considerations. Hum Vaccin Immunother. 2019;15(5):1111–1122.
- Kwon D, Kim S, Kim PJ, et al. Clinicopathological analysis of programmed cell death 1 and programmed cell death ligand 1 expression in the tumour microenvironments of diffuse large B cell lymphomas. Histopathology. 2016;68(7):1079–1089.
- Kim S, Nam SJ, Park C, et al. High tumoral PD-L1 expression and low PD-1(+) or CD8(+) tumor-infiltrating lymphocytes are predictive of a poor prognosis in primary diffuse large B-cell lymphoma of the central nervous system. Oncoimmunology. 2019;8(9):e1626653.
- Woo Y, Zhang Z, Yang A, et al. Novel chimeric immuno-oncolytic virus CF33-hNIS-antiPDL1 for the treatment of pancreatic cancer. J Am Coll Surg. 2020;230(4):709–717.
- Storey KM, Lawler SE, Jackson TL. Modeling oncolytic viral therapy, immune checkpoint inhibition, and the complex dynamics of innate and adaptive immunity in glioblastoma treatment. Front Physiol. 2020;11:151.