
Abstract
Most investigations on the immune cell-activating potency of IgA used purified total IgA and/or specific isolated cell populations. As IgA2 has been reported to be more pro-inflammatory than IgA1, we aimed to employ a fast and convenient whole blood-based assay to individually probe the capacity of the two IgA subclasses to activate immune cells in close physiological conditions. To this end, whole blood from healthy donors (n = 10) was stimulated with immobilized IgA1, IgA2m1 or IgA2m2 (the two main allotypic variants of IgA2). Activation of major leukocyte subsets was measured using a 10-color flow cytometry panel providing access to the expression of 5 activation markers on 6 different immune cell subsets. While capturing some heterogeneity of responses among donors, IgA2m1 and IgA2m2 systematically showed a stronger activation profile compared to IgA1 in a variety of dimensions. For example, both IgA2 allotypes led to stronger modulations of CD54, CD11b, CD62L, CD66b or CD69, on both or either monocytes or neutrophils, indicating a more pronounced pro-inflammatory effect for this subclass than IgA1. By taking into account donor-specific soluble and cellular components this whole blood-based functional approach provides new perspectives to further investigate IgA effector functions in mechanistic studies and/or translational research.
1. Introduction
Despite that IgA consists of two subclasses, with 90% IgA1 and 10% IgA2 in human serum, most studies have focused on total IgA effector functions. Moreover, IgA2 is found in the human population as two main allotypes: the IgA2m1 allotype is more prominent in Europeans and the IgA2m2 in Africans [Citation1]. Few publications have addressed the implication of IgA subclasses in immune cell activation, however pointing towards IgA2 as the most potent subclass [Citation2–4]. Most of these studies considered isolated cells only, thereby disregarding their physiological environment. Dechant et al. considered both isolated cells and whole blood to show that IgA2 better triggered neutrophils than IgA1. They however only focused on the antibody dependent cell cytotoxicity function of IgA and could not provide information on the engagement of specific mononuclear cell populations such as monocytes and NK cells [Citation5].
Here, we used a whole blood-based functional assay to characterize IgA effector functions under close physiological conditions and assess whether there is any significant heterogeneity in donor response. Whole blood from healthy donors was stimulated with immobilized IgA1, IgA2m1 or IgA2m2 monoclonals. Using a 10-color flow cytometry panel, we assessed the expression of 5 different activation markers, mainly adhesion and rolling molecules, on major leukocyte subsets.
2. Methods
2.1. Recombinant monoclonal antibody production
All monoclonal antibodies contained identical variable domains of the anti-citrullinated protein antibody (ACPA) clone 1C11 which was obtained by single cell sorting from cyclic citrullinated protein 2 (CCP2) reactive B-cells from an ACPA + patient and sequencing of the heavy chain (HC) and light chain (LC) variable domains of the B-cell receptor, as described previously [Citation6]. Sequences of the lambda constant domain, and the constant domains of the IgA1 and IgA2m2 HC were obtained from UniProt (IGLC1, IGHA1 and IGHA2). The IgA2m1 HC sequence was obtained by reverting S93P, R102P, Y279F, E296D, I326V and A335V from IgA2m2. The ACPA 1C11 IgA variable gene sequences coupled to the constant domain, the leader peptide MELGLSWVFLVVILEGVQC (for HC) or MAWIPLFLGVLAYCTDIWA (for LC), the Kozak sequence, BamHI and XhoI restriction sites, were codon optimized in GeneArt (Life Technologies) and ordered via IDT. 1C11 IgA HC and LC constructs were cloned into pcDNA3.1(+) expression vector and co-transfected into FreestyleTM 293-F cells (Gibco) as previously described [Citation7]. Supernatant of transfected or non-transfected cells (negative control) was harvested and 0.45 µM filtered 5–6 days later. The supernatants were diluted to get an IgA concentration of 1 µg/mL, as determined by ELISA.
2.2. Samples
Blood from volunteers visiting St. Joseph Hospital (Marseille, France) was used with previous consent and according to Helsinki declaration. Under the French law, ethics committee approval and donor consent were not required for this type of non-interventional study, provided the donors had received information and retained the right to oppose the use of excess sample and anonymized medical data (Loi n°2012–300 du 5 mars, 2012). Blood was collected in heparin-coated (spray dried) Vacutainer tubes (BD Biosciences, San Jose) to avoid metal ion sequestration. Furthermore, samples were tested double negative for CD169 viral and CD64 bacterial markers and thus donors were considered as infection-free [Citation8].
2.3. Flow cytometry functional assay
96-well streptavidin microplates (Microcoat, Baviera) were coated at room temperature with bio-tinylated CCP2 antigen for 1 h at a final concentration of 1 µg/mL. After 3 washes with PBS/Tween 0.05%, IgAs coating at a final concentration of 1 µg/mL was performed for 1 h at 37 °C followed by 3 final washes with PBS/Tween 0.05%. Whole blood was added to the plate and incubated alone, with IgA1, IgA2m1 or IgA2m2 for 4 h at 37 °C, with each condition tested in triplicate. After incubation, cells were stained for 30 min in the dark at room temperature with the following staining mix: CD3-APC-AF750 (UCHT1), CD11b-PE (Bear1), CD14-PacBlue (RMO52), CD16-ECD (3G8), CD19-AF700 (J3-119), CD45-KrO (J33), CD54-FITC (84H10), CD56-PC5.5 (N901), CD62L-APC (DREG56), CD66b-APC-AF750 (80H3), CD69-PC7 (TP1.55.3) (all from Beckman Coulter Life Sciences, Marseille). After staining, red blood cells were lysed with OptiLyse C (Beckman Coulter Life Sciences, Marseille) following the instructions for use (IFU) and a no-wash strategy was adopted to simplify the experimental workflow. Within 3 h, surface marker expression was measured with a 3-laser 13-color CytoFLEX flow cytometer (Beckman Coulter Life Sciences, Miami). See Figure S1 for a schematic overview of the workflow. Gating strategy is displayed in Figure S2.
2.4. Statistical analysis
Analysis of flow cytometry data was performed with Kaluza Analysis 2.1. (Beck-man Coulter, Inc.). JMP 14.2 (SAS Institute, Inc.) was used for statistical analysis. Raw or normalized (stimulation indexes) and Arithmetic Mean Fluorescent Intensity (MFI) were considered. Unsupervised analysis using JMP’s response screening platform was used to identify most discriminative parameters based on t-student or ANOVA test results and false discovery rate (FDR) corrected p-values. Principal component analyses (PCA) were carried out considering most discriminative features. To further study divergences between conditions, box plot representations and heatmaps were used. Differences were evaluated by a non-parametric Wilcoxon test, and statistical significance was established with p-values: *p < 0.05.
3. Results
We performed a principal component analysis (PCA) () using the most discriminant markers identified with an unsupervised response screen (Figure S3). For most donors, a significant translation was observed between conditions, with IgA2 activations inducing the larger shifts from the initial negative positions. A modest but still remarkable separation was visible between negative and IgA conditions with both IgA2m1 and IgA2m2 related conditions mostly overlapping. In contrast, both negative and IgA1 samples were spread wider, likely as a result of basal differences existing among donors.
Figure 1. IgA subclasses show different activation profiles upon whole blood incubation. (a) Principal component analysis after selection of most discriminative parameters identified in Figure S3. (b) Box plots of the best discriminants for granulocytes (b), monocytes (c) and NK cells (d). Each shape represents a different donor (n = 10). Triplicate MFI average are represented excluding the conditions in which we obtained CVs > 30%. Triplicates with CVs between 20 and 30% are represented in yellow. Statistical significance was determined by a nonparametric Wilcoxon test with multiple comparisons, with *p < 0.05.
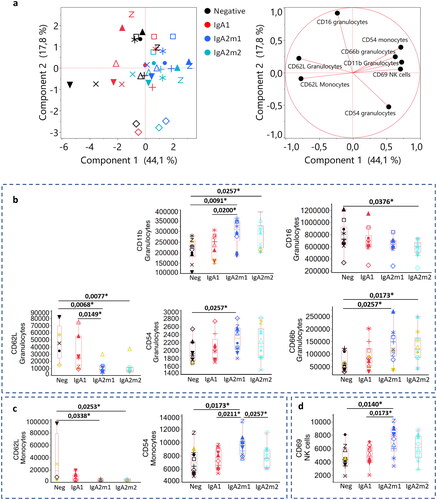
Box plots were subsequently used to clarify the specific modulation of each marker upon stimulation. Granulocytes were activated in several dimensions (). While no significant effect was visible for IgA1 on CD62L expression, this marker was strongly downregulated by stimulation with IgA2m1 or IgA2m2. Similarly, both IgA2s but not IgA1 upregulated CD11b and CD66b expression. Influence on CD16 and CD54 expression was weaker with only one allotype (IgA2m2 and IgA2m1 respectively) provoking a significant regulation. Differences between IgA1 and IgA2 (at least one allotype) were also observed for CD62L and CD11b.
These results correlate with the stronger pro-inflammatory effect of IgA2 de-scribed by Dechant et al. and Steffen et al. Considering that granulocyte activation was visible here through modulation of numerous adhesion molecules such as CD62L, CD11b, CD66b or CD54, this could translate into a higher potential to interact or migrate towards the inflammatory site. Moreover, CD66b and CD16 regulation could indicate cell activation by phagocytosis through CD16 engagement [Citation9] and degranulation as well as ROS production through CD66b [Citation10].
Besides granulocytes, monocytes were activated with both IgA2s as visualized by downregulation of CD62L, suggesting higher migration capabilities (). A significant upregulation of CD54 was only obtained upon activation with IgA2m1, suggesting slightly different mechanisms of action between the two allotypes. IgA1 stimulation did not yield significant differences. Moreover, NK cells were activated by IgA2m1 but not IgA2m2 through upregulation of CD69 (). Two possible pathways could potentially lead to NK cell activation: indirect downstream activation via cell-cell communication with monocytes and/or granulocytes, or direct activation through a different FcαR expressed on NK cell surface [Citation11]. However, the latter pathway is considered less likely, as only one study suggested FcαR expression by NK cells and has yet to be confirmed.
We next combined the results obtained for the 10 donors into a heatmap to not only assess general trends but also apprehend donor heterogeneity of response (Figure S4). For instance, CD66b on granulocytes was strongly upregulated in most donors (i.e. donors 3, 4, 5, 6, and 7) by both IgA2m1 and m2. However, little effects were observed for donor 1, 2, or 10. Donors 8 and 9 showed an intermediate response. This donor heterogeneity, also observed for other markers, suggests that the proposed methodology isn’t only interesting for understanding fundamental mechanisms but also for translational research for which patient stratification could be sought as a function of a possible disease condition or a hypothetical response to a given molecule, either anti- or pro-inflammatory.
Finally, we confirmed that our observations were not the result of a batch-to-batch effect related to the monoclonal antibody production by testing four additional donors (D11-D14) with a newly produced lot of IgAs (Figure S5).
High IgA levels have been related to pathological conditions such as rheumatoid arthritis (RA) [Citation3,Citation12], for which the presence of ACPAs is highly specific. Previous publications investigated the correlation between disease activity and pro-inflammatory markers with the level of IgA2 ACPAs in serum of RA patients [Citation3,Citation13]. In our work, we used surface-immobilized monoclonal ACPA IgAs to stimulate whole blood cells. Although immune complexes, e.g. ACPA immune complexes, in physiological conditions typically consist of a mixture of both subclasses, with IgA1 being more prominent than IgA2 in serum, our observations indicate a more pro-inflammatory effect of IgA2, especially on granulocytes. This would potentially support a role for ACPA IgAs in RA, providing new perspectives for translational research.
IgA1 and IgA2 subclasses, both present in serum, are structurally different with very distinctive glycosylation profiles (Figure S1) [Citation3]. IgG glycosylation appears to be a crucial factor for IgG affinity to its receptor and further effector functions [Citation14]. Controversial literature is found regarding the implication of glycosylation in IgA binding and associated function [Citation4,Citation15,Citation16]. Whether the observed difference in IgA subclasses effector functions is related to their overall structural differences, including differences in glycosylation remains to be further investigated.
In conclusion, whole blood-based functional assays bring new insights in the role of IgA subclass effector functions, supporting pro-inflammatory effects of IgA2. They potentially bring a more complete picture of cell activation by mimicking the physiological context by considering all immune cell populations, blood components and both direct and indirect cell triggering. While capturing donor heterogeneity, they provide new perspectives for preclinical research and potential patient stratification. After this first proof-of-concept study, larger cohorts, together with additional activation markers, antibody clones and antigens should be considered. RA or other patients suffering from chronic inflammatory autoimmune diseases may be considered to further assess this assay and evaluate its potential for pathophysiological understanding.
Author contributions
Conceptualization, A.B., C.C.G., R.E.M.T., and J.M.B.; Methodology, A.B., and C.C.G.; Formal Analysis, A.B., C.C.G., J.M.B.; Writing – Original Draft Preparation, A.B., C.C.G., J.M.B.; Writing – Review & Editing, R.E.M.T., K.A.v.S., J.M.B.
Supplemental Material
Download MS Word (6.8 MB)Conflicts of interest
C.C.G. and J.M.B. are current employees of Beckman Coulter Life Sciences. All other authors declare no conflict of interest.
Data availability statement
Raw data can be shared upon reasonable request.
Additional information
Funding
References
- Soua Z, Ghanem N, Salem MB, et al. Frequencies of the human immunoglobulin IGHA2*M1 and IGHA2*M2 alleles corresponding to the A2m(1) and A2m(2) allotypes in the French, Lebanese, Tunisian and Black African populations. Nucleic Acids Res. 1989;17(9):1–5.
- Gayet R, Michaud E, Nicoli F, et al. Impact of IgA isoforms on their ability to activate dendritic cells and to prime T cells. Eur J Immunol. 2020;50(9):1295–1306.
- Steffen U, Koeleman CA, Sokolova MV, et al. IgA subclasses have different effector functions associated with distinct glycosylation profiles. Nat Commun. 2020;11(1):120.
- Mes L, Steffen U, Chen H-J, et al. IgA2 immune complexes selectively promote inflammation by human CD103+ dendritic cells. Front Immunol. 2023;14:1116435.
- Dechant M, Beyer T, Schneider-Merck T, et al. Effector mechanisms of recombinant IgA antibodies against epidermal growth factor receptor. J Immunol. 2007;179(5):2936–2943.
- Kissel T, Reijm S, Slot LM, et al. Antibodies and B cells recognising citrullinated proteins display a broad cross-reactivity towards other post-translational modifications. Ann Rheum Dis. 2020;79(4):472–480.
- Vink T, Oudshoorn-Dickmann M, Roza M, et al. A simple, robust and highly efficient transient expression system for producing antibodies. Methods. 2014;65(1):5–10.
- Belkacem IA, Bourgoin P, Busnel JM, et al. One-step white blood cell extracellular staining method for flow cytometry. Bio Protoc. 2021;11(16):e4135–e4135.
- Wang Y, Jönsson F. Expression, role, and regulation of neutrophil fcγ receptors. Front Immunol. 2019;10:1958.
- Opasawatchai A, Amornsupawat P, Jiravejchakul N, et al. Neutrophil activation and early features of net formation are associated with dengue virus infection in human. Front Immunol. 2018;9:3007.
- Mota G, Manciulea M, Cosma E, et al. Human NK cells express Fc receptors for IgA which mediate signal transduction and target cell killing. Eur J Immunol. 2003;33(8):2197–2205.
- Breedveld A, Van Egmond M. IgA and FcαRI: pathological roles and therapeutic opportunities. Front Immunol. 2019;10:553.
- Veerle FAMD, et al. In rheumatoid arthritis patients, total IgA1 and IgA2 levels are elevated: implications for the mucosal origin hypothesis. Rheumatology. 2023;62:407–416.
- Larsen MD, de Graaf EL, Sonneveld ME, et al. Afucosylated IgG characterizes enveloped viral responses and correlates with COVID-19 severity. Science. 2021;371(6532):6532.
- Oortwijn BD, Roos A, van der Boog PJM, et al. Monomeric and polymeric IgA show a similar association with the myeloid FcalphaRI/CD89. Mol Immunol. 2007;44(5):966–973.
- Göritzer K, Turupcu A, Maresch D, et al. Distinct fcα receptor N-glycans modulate the binding affinity to immunoglobulin A (IgA) antibodies. J Biol Chem. 2019;294(38):13995–14008.