
Abstract
Rheumatoid arthritis (RA) is the predominant manifestation of inflammatory arthritis, distinguished by an increasing burden of morbidity and mortality. The intricate interplay of genes and signalling pathways involved in synovial inflammation in patients with RA remains inadequately comprehended. This study aimed to ascertain the role of necroptosis in RA, as along with their associations with immune cell infiltration. Differential expression analysis and weighted gene co-expression network analysis (WGCNA) were employed to identify central genes for RA. In this study, identified total of 28 differentially expressed genes (DEGs) were identified in RA. Utilising WGCNA, two co-expression modules were generated, with one module demonstrating the strongest correlation with RA. Through the integration of differential gene expression analysis, a total of 5 intersecting genes were discovered. These 5 hub genes, namely fused in sarcoma (FUS), transformer 2 beta homolog (TRA2B), eukaryotic translation elongation factor 2 (EEF2), cleavage and polyadenylation specific factor 6 (CPSF6) and signal transducer and activator of transcription 3 (STAT3) were found to possess significant diagnostic value as determined by receiver operating characteristic (ROC) curve analysis. The close association between the concentrations of various immune cells is anticipated to contribute to the diagnosis and treatment of RA. Furthermore, the infiltration of immune cells mentioned earlier is likely to exert a substantial influence on the initiation of this disease.
Introduction
Rheumatoid arthritis (RA) is a chronic autoimmune disorder characterised primarily by aggressive arthritis, resulting in progressive synovial and joint degeneration, ultimately leading to disability and premature death [Citation1]. The incidence of RA is estimated at 1%, with a notably higher incidence in females compared to males [Citation2]. The causative factors and underlying mechanisms of RA remain incompletely understood. Throughout the course of RA, immune cells release a diverse array of cytokines, initiating chronic inflammation of the synovial membrane and subsequent bones and joints. Targeted immunotherapies and various kinase inhibitors have made substantial progress in the clinical treatment of RA, leading to significantly improved clinical outcomes for patients [Citation3]. These therapies specifically target important molecular and cellular components involved in the complex mechanisms of disease. However, the occurrence of treatment failure in certain patients undergoing immunotherapy indicates that the need to explore alternative pathways, such as cell death, as potential targets for intervention.
The consequences of cell death in disease can serve either destructive or protective roles. For instance, host cells employ the release of inflammatory cytokines as means to safeguard themselves against detrimental or substandard cells. Additionally, auto-reactive T cells are eliminated through induced cell death, facilitated by kinase IP3 receptor-dependent Ca2+ mobilisation and actin cytoskeleton rearrangement, promote CD44 mediated FasL expression on T cell surface and induce activation induced cell death (AICD) [Citation4], thereby impeding the progression of RA. Notably, the failure of fibroblast-like synoviocytes (FLS) to undergo cell death during the progression of RA results in excessive FLS proliferation, ultimately leading to synovitis [Citation5]. Concurrently, the dysregulation of cell death in autoimmune T and B cells amplifies autoimmune and inflammatory responses, while the dysregulation of cell death in monocyte-macrophages and neutrophils elicits various pathological reactions associated with RA [Citation6,Citation7]. Conversely, increased apoptosis in osteoblasts, chondrocytes, and osteoclasts has been associated with the destruction of bone in RA [Citation8–10]. Consequently, the combined effect of dysregulated cell death across multiple cell types exacerbates RA.
Necroptosis, a recently discovered form of programmed cell death, is mediated by death receptors, and is characterised by its inflammatory properties. This process is tightly regulated by the complex formed by receptor-interacting protein kinase 1 (RIPK1)/receptor-interacting protein kinase 3 (RIPK3)/mixed lineage kinase domain-like (MLKL). Necroptosis often leads to various manifestations of osteoarthritis, including pain, extracellular matrix damage, and cartilage destruction [Citation11]. Researches have demonstrated that inhibiting RIPK1 can effectively mitigate inflammatory responses and reduce necrotic cell death both in vitro and in vivo [Citation12,Citation13]. It has been found that inhibition of necroptosis in RA rats resulted in a reduction in joint injury and inflammation [Citation14]. Similarly, the inhibition of necroptosis in collagen II-induced arthritis (CIA) mice led to a decrease in the expression of necrotic molecules such as RIPK1, RIPK3, and MLKL. This decrease in necrotic molecule expression was associated with a reduction in osteoclasts growth, type 1 T helper (Th1) and interleukin-17-producing T helper (Th17) cells, and an increase in the population of type 2 T helper (Th2) and regulatory T (Treg) cells [Citation15]. However, the specific molecular mechanism underlying these effects remains unknown.
In recent years, bioinformatics analysis of microarray data has been applied to probe the mechanisms of RA, revealing some novel insights. Thus, integrated bioinformatics analysis of these gene expression data in multiple platforms will be conducive to discovering the potential mechanism of RA. This study conducted a comprehensive bioinformatics analysis using the Gene Expression Integrated Database (GEO) to outline the immune infiltration of RA synovium and determine the possible relationship between necroptosis and RA. In addition, we also investigated the relationship between necroptosis and infiltrating immune cells, providing reference and direction for further analysis of the pathogenesis of RA and targeted development of innovative therapies for clinical applications.
Methods and materials
Microarray data analysis
The disease under study is rheumatoid arthritis, which affects the synovial membrane in homo sapiens. To obtain the gene expression data and corresponding sample information for analysis, the GEO database (https://www.ncbi.nlm.nih.gov/geo) was utilised to download GSE12021, GSE55457, and GSE153015 as datasets representing RA and normal (healthy). GSE12021 consisted of 37 samples, with 24 RA patients and 13 normal control samples, which used for subsequent analysis [Citation16–19]. The details of the patients were shown in Table S1. GSE55457 and GSE153015 comprised a total of 43 samples, with 33 RA patient samples and 10 normal control samples, serving as independent external validation sets for the diagnostic model. Figure S1 is the technical circuit diagram of this paper.
Using the keyword “Necroptosis” to search GeneCards database (https://www.genecards.org/), 639 genes were obtained [Citation20]. The MSigDB database was searched to obtain the “GOBP_NECROPTOTIC_SIGNALLING_PATHWAY” pathway and extracted a list of 8 corresponding genes, and a total of 639 coding genes related to necrotic apoptosis were obtained [Citation21]. The necrotic apoptosis-related genes from the above two sources were combined and intersected with the genes measured by GSE12021 expression profile.
Analysis of necroptosis-related gene expression
Based on the data set GSE12021, the R-package heat map was employed to generate an expression heat map depicting the genes in both normal samples and samples from RA patients was drawn using. Additionally, the R-package limma was utilised to conduct a differential expression analysis of genes associated with necrotic apoptosis in RA patients samples compared to normal samples. |Fold change (FC)| > 1.2 and P value < 0.05 were set as the threshold of differential genes. Genes with FC > 1.2 and P value < 0.05 were differentially expressed genes whose expression was up-regulated. FC <0.83 and P value < 0.05 genes were differentially expressed genes with down-regulated expression, and the volcano map was visualised with R package ggplot2 [Citation22–25]. Meanwhile, the Pearson correlation between two genes related to necrotic apoptosis was calculated, and the expression correlation heat map was drawn using R-package corrplot, and the software Cytoscape was used to demonstrate it [Citation26,Citation27].
Construction of necroptosis-related gene model
Based on data set GSE12021, a univariate regression analysis was initially employed to identify necrotic apoptosis-related genes that were differentially expressed. Genes with a P value < 0.05 were considered as potential feature genes, and forest plots were generated using the R-package forest plot for display [Citation28]. Subsequently, Lasso (Least absolute shrinkage and selection operator) regression method is used to screen candidate feature genes, and R-package glmnet is used to implement this method and select the best lambda value [Citation29]. After regression, only the genes whose coefficient is not 0 are retained as characteristic genes, and the diagnostic model is constructed. Based on the data sets GSE55457 and GSE153015, R package ggpubr was used to visualise the predicted scores between the two groups [Citation30]. In order to verify the predictive efficiency of the diagnostic model, based on the data sets GSE55457 and GSE153015, the receiver operating characteristic (ROC) curve of the model was drawn using the R package ROCR and the area under the curve was calculated [Citation31].
Functional enrichment analysis of DEGs
R package clusterProfiler was used to perform gene ontology (GO) functional annotation and kyoto encyclopaedia of genes and genomes (KEGG) pathway enrichment for significantly differentially expressed necrotic apoptosis-related genes in dataset GSE12021 to identify the significantly enriched biological processes. The enrichment results were visualised in the form of bubble maps. The significance threshold of enrichment analysis was set as p < 0.05 [Citation32–35].
In order to study the differences in the biological processes related to necrotic apoptosis between patient samples and normal samples, based on the necrotic apoptosis-related gene expression profile dataset of dataset GSE12021, the GSE, method included in cluster Profiler was used for enrichment analysis and visualisation of the dataset [Citation32,Citation33,Citation36]. The corrected P value <0.05 was considered statistically significant. According to reference gene set "c5.go.v7.4.entrez_input" downloaded from MSigDB database and data set GSE12021, enrichment analysis was performed using R package gene set variation analysis (GSVA) and difference analysis was performed using R package limma. P values less than 0.05 and log2FC absolute values greater than 0.2 were considered to be significantly different pathways, and R-package pheatmap was used for heatmap visualization [Citation21–23,Citation37,Citation38].
WGCNA based on necroptosis-related genes
Based on the expression profile of necrotic apoptosis-related genes in dataset GSE12021, R-package weighted gene co-expression network analysis (WGCNA) was used to construct a co-expression network, and R-square = 0.8 was used as the standard to select an appropriate soft threshold for clustering [Citation39]. As necroptosis related genes play an important role in rheumatoid arthritis, necroptosis related genes were retrieved from GeneCards database using the keyword “necroptosis” respectively. Furthermore, the apoptosis-related genes were characterised by module analysis and mining to obtain the modules (r > 0.3 & p < 0.05) that were significantly related to apoptosis-related genes for further analysis [Citation20,Citation40].
PPI network construction and hub genes acquisition
STRING database (https://cn.string-db.org/) was used to construct protein-protein interaction networks (PPI) with differential necrotic apoptosis-related genes that intersected with necrotic apoptosis-related modules as input, and the confidence threshold was set as the default value 0.4 [Citation41]. After that, PPI was exported, Cytoscape software was used for further analysis, network attributes of each node were calculated, and the plug-in cytoHubba was used to mine hub nodes based on node degrees, and the 5 nodes with top5 degrees were defined as hub nodes, namely key necrotic apoptosis-related differentially expressed genes.
Unsupervised clustering of patient samples and principal component analysis
Based on data set GSE12021, the R package ConsensusClusterPlus was first used to conduct unsupervised clustering for all RA patients by using the aggregation hierarchical clustering algorithm [Citation42]. To verify the unsupervised clustering results, Principal Component Analysis (PCA) was performed and visualised using R package ggfortify [Citation43]. Subsequently, multi-group comparison based on unsupervised clustering of patients was performed by R-packet stats and non-parametric test – Kruskal-Wallis was used for testing. p < 0.05 was considered to be statistically significant, and R-packet ggpubr was used to draw grouping box diagram for visualization [Citation30].
Correlation of differentially expressed genes related to necroptosis
Pearson correlations of different-expressed necrotic apoptosis-related genes in the above patient subtypes were calculated based on data set GSE12021, and the correlation was considered to be relevant if the absolute value of the correlation coefficient was greater than 0.3 and the P-value was less than 0.05. R package ggplot2 was used to draw the correlation scatter plot between the gene pairs that met the requirements and fit the correlation curve. R package ggExtra was used to draw the histogram of the graph edge [Citation25,Citation44].
Immuno-infiltration correlation analysis
In order to further explore the immune-infiltration correlation of key genes related to necrotic apoptosis in rheumatoid arthritis, we used CIBERSORT to evaluate the infiltration level of immune cells. Based on the LM22 background gene set and data set GSE12021 provided by CIBERSORT, the content of 22 kinds of immune cells in each sample was calculated to reflect the infiltration level, and the R-package ggpubr was used to draw the grouping box diagram of RA patient samples [Citation30,Citation45]. In addition, in order to directly examine the correlation between key genes related to rheumatoid arthritis necrotic apoptosis and the level of immune cell infiltration, we also used R-package ggpubr to draw a grouping diagram of the expression level of key genes related to rheumatoid arthritis necrotic apoptosis based on 22 types of immune cells. Wilcoxon rank sum test was used for statistical significance test between groups, and P value < 0.05 was considered statistically significant, so as to observe the correlation between prognostic risk genes and immune cell infiltration level [Citation30].
Statistical analysis statistical analysis
All data calculations and statistical analysis were performed using R (version 4.0.2). For the comparison of two groups of continuous variables, the statistical significance of normally distributed variables was estimated by independent t test, and for the comparison of two groups of independent variables, the difference between non-normally distributed variables was analysed by Wilcoxon rank sum test. The R package ROCR was used to plot the ROC Curve and calculate the area under curve (AUC) to evaluate the accuracy of the diagnostic model [Citation31]. All statistical P values were bilateral, and p < 0.05 was considered statistically significant [Citation27,Citation46].
Results
Microarray data normalisation and identification of DEGs in RA
In order to generate an expression profile of necroptosis genes across all samples, we amalgamated the expression data from two platforms within the GSE12021. However, as datasets originating from diverse sources often exhibit batch effects, we conducted batch effect correction on the merged data. Upon comparing the outcomes prior to batch correction () and subsequent to batch correction (), it is evident that the expression distribution of all samples demonstrates a tendency towards consistency following batch correction. This adjustment is advantageous in enhancing the precision of subsequent analyses.
Figure 1. Data preprocessing and expression of necroptosis genes. (A and B) normalisation of the GSE12021 datasets. (C) Cluster heat map of differential expressionof necroptosis genes in normal and RA samples. Red indicates relative upregulation of gene expression; blue indicates the relative downregulation of geneexpression; white indicates no significant change in gene expression. (D) Volcano plot of differential expression of necroptosis genes in normal and RA samples.(E) Correlation heat map of differential expression of necroptosis genes in normal and RA samples. (F) Correlation interaction network Diagram of necroptosisgenes in normal and RA samples. RA: rheumatoid arthritis.
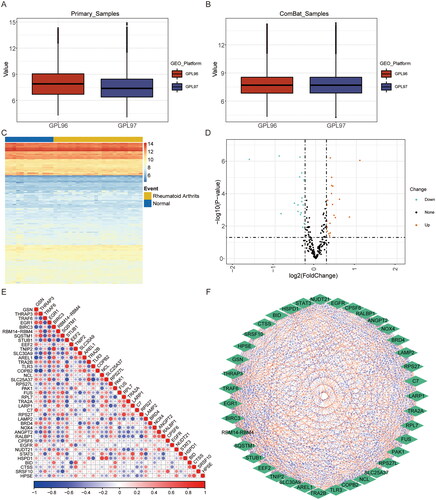
Subsequently, the expression patterns of necroptosis genes in the dataset GSE12021 were visually represented through the utilisation of heat maps and grouped box plots (), thereby highlighting the similarities and differences between normal and RA samples. The findings indicate distinct expression profiles of these necroptosis regulatory genes in the two groups, but there are some similar expression patterns, necessitating further investigation.
In order to explore the relationship between necroptosis genes and rheumatoid arthritis, and to ascertain the differentially expression of necroptosis genes between normal and RA samples in the dataset GSE12021, we established a threshold of p < 0.05 and |FC| > 1.2. A comprehensive analysis revealed total of 39 necroptosis genes that exhibited significant differentially expression in rheumatoid arthritis, comprising 20 up-regulated and 19 down-regulated necroptosis genes (). Simultaneously, the Pearson correlations were computed between two genes associated with necroptosis genes, and these correlations were visually represented through a correlation heat map () and a correlation interaction network map (). The results showed a significant correlation between necroptosis genes, such as TNFAIP3 interacting protein 2 (TNIP2) and baculoviral IAP repeat containing 3 (BIRC3) (r = 0.816, p = 7.835e-10), as well as solute carrier family 25 member 37 (SLC25A37) and toll–like receptor 3 (TLR3) (r = −0.774, p = 1.877e-08). The results indicate that the presence of both positive and negative correlations among necroptosis genes, thereby influencing intergene regulation. Consequently, in can be inferred that necroptosis genes potentially engage in interactions through positive or negative regulation to modulate the occurrence of RA.
Models of necroptosis genes
Given the considerable biological significance of necroptosis genes expression and its association with RA, a model based was developed using differentially expressed necroptosis genes. Specifically, the dataset GSE12021, was utilised to identify these differentially expressed necroptosis genes. There were 36 candidate trait genes with p < 0.05 (; ). After that, these candidate genes were regressively screened by Lasso regression and the optimal lambda value was 0.002999. The results showed that 11 characteristic genes were eventually retained, namely EGFR, NOX4, C7, FUS, PAK1, EEF2, STUB1, RBM14-RBM4, TRAF6, THRAP3 and GSN. The corresponding coefficients in Lasso regression were used to construct the diagnostic model.
Figure 2. Construction of necroptosis-related differential expression gene diagnostic model based on dataset GSE12021. (A) Differential expression of necroptosisfeature gene. (B) Box plot of model prediction scoring between RA samples and normal samples in diagnostic models. (C) the dataset was used to validate thediagnostic effectiveness for RA by ROC analysis. RA: rheumatoid arthritis; ROC: receiver operating characteristic.
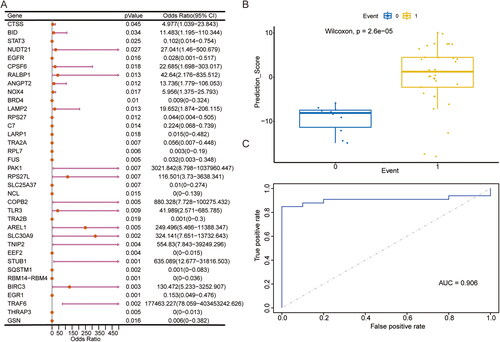
Table 1. 36 candidate trait genes with p < 0.05.
To verify the accuracy of the model, we initially employed a diagnostic model comprised of characteristic genes to forecast and evaluate the external independent validation datasets GSE55457 and GSE153015. Box plots were then used to visualise the model prediction scores between RA and normal samples in the diagnostic model (). The results indicate that there exists a discernible distinction in the prediction scores of the model between the two groups. Furthermore, the subsequent ROC curve verifies the predictive performance of the model (). The ROC curve shows that the overall AUC of the model is 0.906, which has good prediction performance and stability.
GSEA and GSVA of RA samples and normal samples
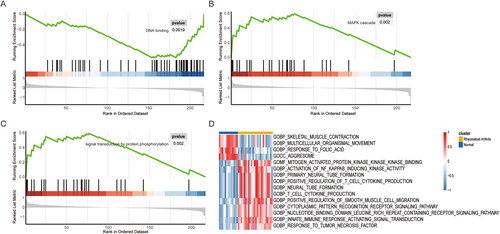
We next performed gene set enrichment analysis (GSEA) of RA and normal samples in the dataset GSE12021, in conjunction with the results of necroptosis-related difference analysis, to elucidated the functional annotations of the identified genes. A total of 97 noteworthy GO terms were observed to be enriched, encompassing DNA binding (), mitogen-activated protein kinase (MAPK) cascade (), and signal transduction by protein phosphorylation (). These results also validate and complement our previous GO and KEGG analyses. Furthermore, a GSEA was performed, yielding an enrichment score for each pathway, thereby identifying 918 pathways that exhibited significant differences between the RA and the normal samples. These include: response to tumour necrosis factor, innate immune response activating signal transduction, nucleotide binding domain leucine rich repeat containing receptor signalling pathway, and the positive regulation of smooth muscle cell migration. This also complements our previous analysis regarding the regulation of cell cycle ().
Figure 3. GSEA and GSVA analysis of differentially expressed genes related to necroptosis between RA patient samples and normal samples based on thedataset GSE12021. (A-C) GSEA analysis of RA tissues and healthy controls. (D) GSVA analysis of RA tissues and healthy controls. GSEA: gene set enrich-ment analysis; GSVA: gene set variation analysis; RA: rheumatoid arthritis.
WGCNA analysis of RA samples and normal samples
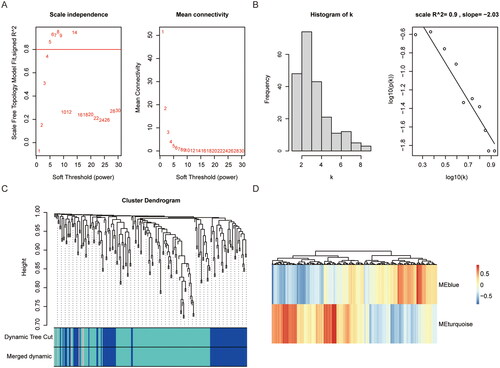
In order to investigate the association between RA and necroptosis, R-packed WGCNA was employed to cluster the samples. Based on the dataset GSE12021, the pick Soft Threshold function was initially utilised to determine an appropriate soft threshold. In this study, a soft threshold of 5 was selected (). In this study, β = 5, where the correlation coefficient between log (k) and log(p(k)) was close to 0.8, was selected to construct the gene network (). The dynamic mixed cutting method was utilised to construct a hierarchical clustering tree, wherein each leaf denoted a gene. Genes exhibiting similar expression data were grouped in close proximity, forming a branch representing a gene module. A total of two modules were generated (). Among these modules, the turquoise module displayed a significant associated with necroptosis genes (| r | > 0.3, p < 0.05), and exhibited a stronger correlation with necroptosis (). Therefore, the genes within the turquoise module were selected for further analysis.
Figure 4. WGCNA analysis of necroptosis related genes based on dataset GSE12021. (A) Scale independence of eigengenes. the red line represents the correlationcoefficient square (r2) and mean connectivity of eigengenes under a soft threshold power of 5. the mean connectivity of eigengenes. (B) Gene network, thecorrelation coefficient between log (k) and log (p (k)) is close to 0.8, β=5. (C) Gene interactions in coexpression modules. (D) module correlations with RA patientsand controls. WGCNA: weighted gene co-expression network analysis; RA: rheumatoid arthritis.
PPI network and hub gene screening
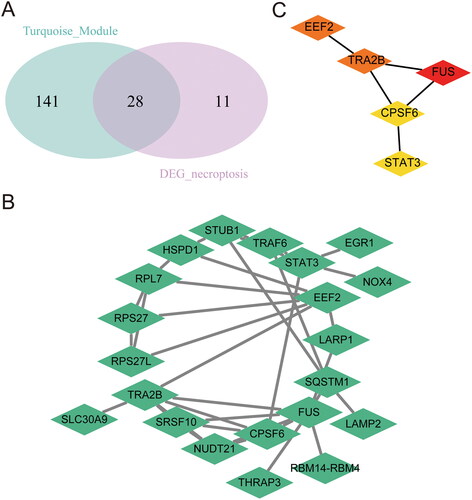
In order to provide further clarification on the necroptosis-related differentially expressed genes within the necroptosis module, an intersection was conducted between the necroptosis module gene and the differentially expressed gene in the GSE12021 dataset, resulting in identification of 28 necroptosis module-related differentially expressed genes, included ANGPT2, RALBP1, STUB1, SQSTM1, EGR1, C7, NOX4, PAK1, STAT3, LAMP2, CTSS, EEF2, HSPD1, HPSE, TRAF6, COPB2, FUS, SLC30A9, RPS27, RPL7, LARP1, TRA2B, CPSF6, THRAP3, NUDT21, RPS27L. SRSF10 and RBM14-RBM4 (). Subsequently, a PPI network was constructed using the STRING database, consisting of 21 genes and 35 interactions. The PPI network exhibited an average node degree of 3.3, an enrichment p-value of 3.88e-06, a clustering coefficient of 0.369, a density of 0.167, and a centralisation of 0.258. Cytoscape software was then used for visualisation (). In the network, a few nodes have a closer connection with the rest of the nodes, in order to mine such genes in the network, so we applied the cytoHubba in the software Cytoscape to extract the top 5 genes of the network nodes as hub genes, namely FUS, TRA2B, EEF2, CPSF6 and STAT3, for further analysis ().
Figure 5. PPI network and Hub Gene Screening. (A) Venn diagram showing the overlap of genes between DEGs in GSE12021 and necroptosis-related genes. (B) the hub genes were extracted from the PPi network through Cytoscape software, average node degree 3.3, enrichment p-value 3.88e-06, clustering coefficient 0.369, density 0.167, centralisation 0.258. (C) the hub gene of top 5 in the network through Degree algorithms of cytoHubba. PPi: protein-protein interaction networks; DEGs: differentially expressed genes.
Unsupervised clustering of necroptosis genes in RA
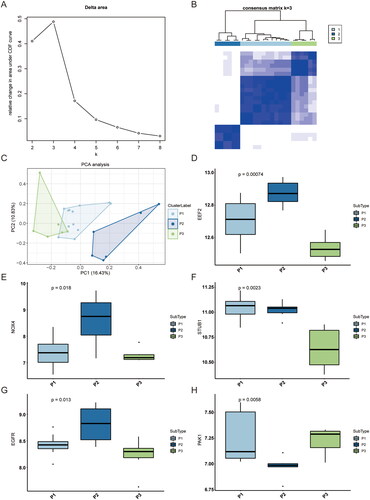
Given the established association between necroptosis genes and RA, we employed a set of 39 differentially expressed necroptosis gene to construct unsupervised clustering on all RA patient samples using the aggregation hierarchical clustering algorithm. Our analysis was based on the dataset GSE12021. Initially, we sought to determine the most appropriate number of clusters (). The results indicate that the clustering efficacy is maximised when the number of clusters is set to 3. Consequently, we chose k = 3 as the optimal number of clusters for unsupervised clustering, thereby categorising all samples into three distinct groups. Subsequently, we visualised the clustering heat map to illustrate the clustering outcomes (). Principal component analysis was performed on the spectrum of necrotic apoptotic genes to validate the unsupervised clustering outcomes (). The analysis demonstrated the effective differentiation of the three subtypes, thereby confirming the accuracy of the clustering results. Finally, a Kruskal Wallis test, a non-parametric test for multi group comparison, was employed to examine the expression levels of diagnostic model characteristic genes in the three subtypes of RA samples. As depicted in , 5 genes exhibited noteworthy variations across the three sample groups, suggesting their association with typing.
Figure 6. Unsupervised clustering of RA patient samples based on dataset GSE12021. (A, B) Unsupervised Clustering analysis. (C) PCA analysis results.(D-H) Expression pattern of feature genes. RA: rheumatoid arthritis; PCA: Principal Component Analysis.
Immuno-infiltration analysis of key necroptosis genes
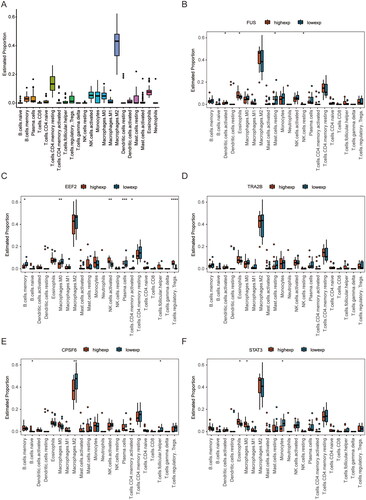
The intricate pathogenesis of RA is greatly influenced by the immune system. To investigate this relationship, we examined the association between the expression levels of hub genes and infiltrating immune cells using the CIBERSORT algorithm on the GSE12021 dataset, which encompassed 22 immune cells in the sample (). Similarly, we calculated the correlation between all identified necroptosis hub genes and the infiltration level of all immune cells, revealing a significant association between the expression levels of necroptosis hub genes and multiple immune cells. FUS is associated with activated dendritic cells (p = 0.041), eosinophil (p = 0.046), testing mast cells (p = 0.035), and resetting NK cells (p = 0.045) (). EEF2 is associated with memory B cells (p = 0.011), macrophages M0 (p = 0.0071), activated NK cells (p = 0.0015), plasma cells (p = 0.00011), activated CD4 memory T cells (p = 0.016), and regulatory T cells (p = 2.3e-05) (). CPSF6 is related to naive B cells (p = 0.023), macrophages M2 (p = 0.01), and follicular helper T cells (p = 0.01) (). STAT3 is related to eosinophils (p = 0.013), macrophages M0 (p = 0.016), monocytes (p = 0.011) (), it also has a significant correlation with various immune cells. While TRA2B is not significantly correlated with immune cells (). Based on the above results, it can be demonstrated from multiple perspectives that necroptosis hub genes are related to the immune microenvironment.
Figure 7. Immune infiltration analysis of key necroptosis genes based on the dataset GSE12021. (A) Implementation of the CIBERSORT algorithm toexplore immune microenvironment in RA patients. (B-F) Graph of top5 hub genes and immune cell correlation analysis. RA: rheumatoid arthritis.
Discussion
RA is a chronic autoimmune disorder characterised by progressive polyarthritis marked by significant bone loss and aberrant infiltration of immune cell into the synovial membrane. The abnormal proliferation of synovial fibroblasts and invasion of the synovial inner layer are recognised as significant contributors to the progression of RA [Citation47]. Although the involvement of necrotic apoptosis in the progression of RA has been suggested in recent studies, the underlying mechanism remains unclear [Citation48]. Necroptosis is a newly discovered programmed cell death, exhibits characteristics of both necrosis and apoptosis. This process mediated by RIPK1, RIPK3, and MLKL, can elicit significant inflammation and has emerged as a regulatory mechanism in various inflammatory diseases. Lee et al. found elevated levels of RIPK1, RIPK3, and MLKL in the synovial membrane of the CIA model [Citation49]. It has been reported in the literature that within the inflammatory response environment of RA, tumour necrosis factor (TNF)-α stimulates granulocytic-macrophages and phosphorylates downstream RIPK1, RIPK3 and MLKL proteins, triggers cell necrotic apoptosis, releases inflammatory factors and other cell contents, and continuously aggravates the RA process [Citation50]. This is consistent with the results of this study. Studies have found that NST-1s (an inhibitor of necrotic apoptosis) has the potential to decrease the progression of CIA by suppressing the generation of osteoclasts and the differentiation of Th17 cells [Citation15]. Consequently, targeting the inhibition of necrotic apoptosis nay present a novel therapeutic approach for RA. Additionally, in a CIA mouse model, geldamycin exhibited notable enhancements in clinical outcomes and a reduction in synovial hyperplasia [Citation51]. However, a multicentre, randomised, double-blind, placebo-controlled clinical trial was conducted to assess the efficacy of the RIPK1 inhibitor GSK2982772 in RA. The findings revealed that there were no significant differences observed in various commonly used clinical markers and disease severity between the group receiving the inhibitor and the placebo. Notable examples include DAS28-CRP and ACR20/50/70 (NCT02858492). Therefore, we need to further explore the mechanism of necrotic apoptosis in the aetiology and progression of RA.
In this study, a total of 39 necrotic apoptosis-related genes exhibited differential expressed patterns between RA patients and healthy controls. Among these genes, 20 were found to be up-regulated, while 19 were down-regulated. The observed correlation between these necrotic apoptosis-related genes suggests that the necrotic apoptotic phase may play a regulatory role in the initiation and progression RA through positive or negative interactions. Moreover, the diagnostic model constructed using these characteristic genes was validated using a ROC curve analysis, yielding an overall AUC value of 0.906, which further confirmed the important role of necrotic apoptosis in RA. To further investigate the relationship between RA and necrotic apoptosis. Using R software package WGCNA and GSE12021 dataset, the findings identified the blue-green modules most associated with necrotic apoptosis. Through PPI network construction and hub gene screening, the top 5 hub genes were identified, namely FUS, TRA2B, EEF2, CPSF6 and STAT3. In fact, the transfection of STAT3 siRNA effectively impeded the differentiation process of CD4+ T cells into Th17 cells while concurrently augmenting the proportion of Treg cells. Given the close association between STAT3 and joint inflammation as well as lymphocyte differentiation, it is plausible to consider STAT3 as a promising target for RA treatment. The results of this study provide evidence of the crucial role played by FUS, TRA2B, EEF2 and CPSF6 in both necrotic apoptosis and the pathogenesis of RA, but the specific mechanism needs to be further studied.
Through an intersection analysis, we obtained a total of 39 necrotic apoptosis genes that are associated with RA. Furthermore, the GO enrichment analysis revealed that the DEGs primarily participate in cell cycle related biological processes, particularly multiple mRNA splicing processes. Additionally, the KEGG pathway enrichment analysis identified 8 pathways, including Necroptosis, which further supports the findings from the GO enrichment results. Collectively, these results provide substantial evidence that these genes are intricately involved in biological processes and functions related to cell cycle regulation. TNF-α is responsible for the occurrence of necrotising apoptosis, a form of programmed cell death that triggers noticeable inflammation [Citation52]. Inflammatory cell death, which encompasses both pathological and physiological states, is known to contribute to the development of inflammatory diseases [Citation53,Citation54]. Research has confirmed that there is a significant increase in necrotic apoptosis within the synovium of animal with experimental autoimmune arthritis [Citation49]. Necrotising apoptosis can elicit extensive inflammatory reactions, with the regulation of inflammatory cell death being governed by RIPK1 [Citation52,Citation55]. Multiple lines of evidence support that the inhibiting of RIPK1 improves inflammatory response in vitro and in vivo, reducing necrotic cell death [Citation12,Citation13]. The levels of inflammatory cytokines interleukin-17 (IL-17) and TNF in the serum and synovium of RA patients are significantly increased [Citation56,Citation57].Patients with RA exhibit increased osteoclast production compared to healthy people [Citation58]. At present, the inhibition of osteoclast production is a crucial objective in the treatment of RA due to the destructive effects of osteoclast on bone and cartilage. In addition, pro-inflammatory cytokines such as IL-17 and TNF-α have been found to promote osteoclast production [Citation59,Citation60]. Research has demonstrated that the use of RIPK1 inhibitors effectively reduces CIA by suppressing osteoclast production and mitigating arthritis is symptoms [Citation15]. Therefore, we speculate that necrotic apoptosis increases the activity of osteoclast by inducing inflammation, and ultimately leads to the occurrence and development of RA.
In this study, we found a strong correlation between the expressions of necroptosis hub genes and the presence of at least one immune cell in RA, indicating that these hub genes may have significant contributions to the immune microenvironment in RA. Based on these bioinformatic analysis, it is postulated that the identified hub genes may serve as mediators in immune pathways associated with RA and exert an influence on functionality of immune cells during the progression of this condition. Overall, our study employed a combination of diverse bioinformatics tools to examine the transcriptomic variations between normal and RA synovial tissue, leading to the identification of five pivotal hub genes implicated in the progression of RA. Nevertheless, additional research is warranted to elucidate the precise functions and molecular mechanisms underlying the involvement of these hub genes in RA.
This study is subject to certain limitations. Firstly, despite the rigorous bioinformatics analysis conducted in this study, it is imperative to exercise caution when interpreting the results, as they lack of confirmation from our own experiments and clinical trials, and this article lacks detailed information about the participants, such as age, sex, disease duration, serology (RF ACPA), TJC/SJC/CRP or DAS28, drug naïve or on treatment. Secondly, the utilisation of the RA gene chip from the GEO database, which contains a limited number of relevant gene chip samples, may have introduced bias in the data analysis due to the small sample size. Thirdly, immune infiltration analysis was solely based on transcriptomic data. Hence, the determination of whether necroptosis induces immune cell infiltration or if immune cells are actively in the necroptosis process remains inconclusive. Therefore, this study has significant implications for future studies.
Authors’ contributions
Feige Nian, Mingfeng Yang, Bin Zhang: conceptualisation, methodology, writing original draft, writing review & editing, visualisation. Yiwen Wang: methodology, validation, data curation, formal analysis, investigation. Feige Nian: validation, data curation, formal analysis.
Supplemental Material
Download TIFF Image (1.3 MB)Availability of data and materials
The dataset used and/or analysed in this study is available from the corresponding author on reasonable request.
Disclosure statement
The authors declare no competing interests.
Additional information
Funding
References
- Aletaha D, Neogi T, Silman AJ, et al. 2010 Rheumatoid arthritis classification criteria: an American college of rheumatology/European league against rheumatism collaborative initiative. Ann Rheum Dis. 2010;69(9):1–14.
- Alamanos Y, Voulgari PV, Drosos AA, et al. Incidence and prevalence of rheumatoid arthritis, based on the 1987 American college of rheumatology criteria: a systematic review. Semin Arthritis Rheum. 2006;36(3):182–188.
- McInnes IB, Schett G. Pathogenetic insights from the treatment of rheumatoid arthritis. Lancet. 2017;389(10086):2328–2337.
- Nakano K, Saito K, Mine S, et al. Engagement of CD44 up-regulates Fas ligand expression on T cells leading to activation-induced cell death. Apoptosis. 2007;12(1):45–54.
- Fujikawa K, Kawakami A, Tanaka F, et al. Calcium/calmodulin-dependent protein kinase II (CaMKII) regulates tumour necrosis factor-related apoptosis inducing ligand (TRAIL)-mediated apoptosis of fibroblast-like synovial cells (FLS) by phosphorylation of AKT. Clin Exp Rheumatol. 2009;27:952–957.
- Roberts CA, Dickinson AK, Taams LS, et al. The interplay between monocytes/macrophages and CD4(+) T cell subsets in rheumatoid arthritis. Front Immunol. 2015;6:571.
- Cheng L, Wang Y, Wu R, et al. New insights from single-cell sequencing data: synovial fibroblasts and synovial macrophages in rheumatoid arthritis. Front Immunol. 2021;12:709178.
- Schett G. Cells of the synovium in rheumatoid arthritis. Osteoclasts. Arthritis Res Ther. 2007;9(1):203.
- Sato K, Takayanagi H. Osteoclasts, rheumatoid arthritis, and osteoimmunology. Curr Opin Rheumatol. 2006;18(4):419–426.
- Krumbholz G. Response of human rheumatoid arthritis osteoblasts and osteoclasts to adiponectin. Clin Exp Rheumatol. 2017;35:406–414.
- Cheng J, Duan X, Fu X, et al. RIP1 perturbation induces chondrocyte necroptosis and promotes osteoarthritis pathogenesis via targeting BMP7. Front Cell Dev Biol. 2021;9:638382.
- Zhang S, Wang Y, Li D, et al. Necrostatin-1 attenuates inflammatory response and improves cognitive function in chronic ischemic stroke mice. Medicines (Basel). 2016;3(3):16.
- Liu ZY, Wu B, Guo YS, et al. Necrostatin-1 reduces intestinal inflammation and colitis-associated tumorigenesis in mice. Am J Cancer Res. 2015;5:3174–3185.
- Chen Y, Zhu C-J, Zhu F, et al. Necrostatin-1 ameliorates adjuvant arthritis rat articular chondrocyte injury via inhibiting ASIC1a-mediated necroptosis. Biochem Biophys Res Commun. 2018;504(4):843–850.
- Jhun J, Lee SH, Kim S-Y, et al. RIPK1 inhibition attenuates experimental autoimmune arthritis via suppression of osteoclastogenesis. J Transl Med. 2019;17(1):84.
- Barrett T, Wilhite SE, Ledoux P, et al. NCBI GEO: archive for functional genomics data sets–update. Nucleic Acids Res. 2013;41(Database issue):D991–995.
- Huber R, Hummert C, Gausmann U, et al. Identification of intra-group, inter-individual, and gene-specific variances in mRNA expression profiles in the rheumatoid arthritis synovial membrane. Arthritis Res Ther. 2008;10(4):R98.
- Woetzel D, Huber R, Kupfer P, et al. Identification of rheumatoid arthritis and osteoarthritis patients by transcriptome-based rule set generation. Arthritis Res Ther. 2014;16(2):R84.
- Triaille C, Vansteenkiste L, Constant M, et al. Paired rheumatoid arthritis synovial biopsies from small and large joints show similar global transcriptomic patterns with enrichment of private specificity TCRB and TCR signaling pathways. Front Immunol. 2020;11:593083.
- Stelzer G, Rosen N, Plaschkes I, et al. The GeneCards suite: from gene data mining to disease genome sequence analyses. Curr Protoc Bioinformat. 2016;54(1):1.30.1–1.30.33.
- Liberzon A, Birger C, Thorvaldsdóttir H, et al. The molecular signatures database (MSigDB) hallmark gene set collection. Cell Syst. 2015;1(6):417–425.
- Kolde R, Kolde MR. Package ‘pheatmap’. R Package. 2015;1:790.
- Ritchie ME, Phipson B, Wu D, et al. Limma powers differential expression analyses for RNA-sequencing and microarray studies. Nucleic Acids Res. 2015;43(7):e47–e47.
- Zhang L, Chen S, Zeng X, et al. Revealing the pathogenic changes of PAH based on multiomics characteristics. J Transl Med. 2019;17(1):231.
- Wickham H. ggplot2. Wiley Interdis Rev Comput Stat. 2011;3:180–185.
- Wei T. Package ‘corrplot’. Statistician. 2017;56:e24.
- Shannon P, Markiel A, Ozier O, et al. Cytoscape: a software environment for integrated models of biomolecular interaction networks. Genome Res. 2003;13(11):2498–2504.
- Gordon M, Lumley T, Gordon MM, et al. Package ‘Forestplot’. Adv Forest Plot Using ‘Grid’ Graph. Compre R Arch Netw, Vienna. 2019, https://cran.r-project.org/web//packages//forestplot/forestplot.pdf.
- Friedman J, Hastie T, Tibshirani R, et al. Package ‘Glmnet’. J Stat Softw. 2021;33.
- Kassambara A, Kassambara MA. Package ‘ggpubr’. R Package Version 0.1. 2020;6.
- Sing T, Sander O, Beerenwinkel N, et al. The ROCR package. R Vignette. 2007.
- Yu G, Wang L-G, Han Y, et al. clusterProfiler: an R package for comparing biological themes among gene clusters. OMICS. 2012;16(5):284–287.
- Wu T, Hu E, Xu S, et al. clusterProfiler 4.0: a universal enrichment tool for interpreting omics data. Innovation (NY). 2021;2:100141.
- Ashburner M, Ball CA, Blake JA, et al. Gene ontology: tool for the unification of biology. The gene ontology consortium. Nat Genet. 2000;25(1):25–29.
- Kanehisa M, Goto S. KEGG: kyoto encyclopedia of genes and genomes. Nucleic Acids Res. 2000;28(1):27–30.
- Subramanian A, Tamayo P, Mootha VK, et al. Gene set enrichment analysis: a knowledge-based approach for interpreting genome-wide expression profiles. Proc Natl Acad Sci USA. 2005;102(43):15545–15550.
- Hanzelmann S, Castelo R, Guinney J, et al. GSVA: gene set variation analysis for microarray and RNA-seq data. BMC Bioinformat. 2013;14(1):7.
- Li Z, Liu Y, Jia A, et al. Cerebrospinal fluid cells immune landscape in multiple sclerosis. J Transl Med. 2021;19(1):125.
- Langfelder P, Horvath S. WGCNA: an R package for weighted correlation network analysis. BMC Bioinformat. 2008;9(1):559.
- Zhao J, Jiang P, Guo S, et al. Apoptosis, autophagy, NETosis, necroptosis, and pyroptosis mediated programmed cell death as targets for innovative therapy in rheumatoid arthritis. Front Immunol. 2021;12:809806.
- von Mering C. V. STRING: a database of predicted functional associations between proteins. Nucleic Acids Res. 2003;31(1):258–261.
- Wilkerson MD, Hayes DN. ConsensusClusterPlus: a class discovery tool with confidence assessments and item tracking. Bioinformatics. 2010;26(12):1572–1573.
- Tang Y, Horikoshi M, Li, W. Ggfortify: unified interface to visualize statistical results of popular R packages. R J. 2016;8:474.
- Attali D, Baker C. ggExtra: add marginal histograms to ‘ggplot2’, and more ‘ggplot2’enhancements. R Package Version. 2019.
- Chen B, Khodadoust MS, Liu CL, et al. Profiling tumor infiltrating immune cells with CIBERSORT. Methods Mol Biol. 2018;1711:243–259.
- Chin C-H, Chen S-H, Wu H-H, et al. cytoHubba: identifying hub objects and sub-networks from complex interactome. BMC Syst Biol. 2014;8 Suppl 4(Suppl 4):S11.
- Cai P, Lu Z, Jiang T, et al. Syndecan-4 involves in the pathogenesis of rheumatoid arthritis by regulating the inflammatory response and apoptosis of fibroblast-like synoviocytes. J Cellular Physiol. 2020;235(2):1746–1758.
- Gutierrez KD, Davis MA, Daniels BP, et al. MLKL activation triggers NLRP3-mediated processing and release of IL-1beta independently of Gasdermin-D. J Immunol. 2017;198(5):2156–2164.
- Lee SH, Kwon JY, Kim S-Y, et al. Interferon-gamma regulates inflammatory cell death by targeting necroptosis in experimental autoimmune arthritis. Sci Rep. 2017;7(1):10133.
- Cho Y, Challa S, Moquin D, et al. Phosphorylation-driven assembly of the RIP1-RIP3 complex regulates programmed necrosis and virus-induced inflammation. Cell. 2009;137(6):1112–1123.
- Saeki Y, Okita Y, Igashira-Oguro E, et al. Modulation of TNFR 1-triggered two opposing signals for inflammation and apoptosis via RIPK 1 disruption by geldanamycin in rheumatoid arthritis. Clin Rheumatol. 2021;40(6):2395–2405.
- Pasparakis M, Vandenabeele P. Necroptosis and its role in inflammation. Nature. 2015;517(7534):311–320.
- Linkermann A, Green DR. Necroptosis. N Engl J Med. 2014;370(5):455–465.
- Vanden Berghe T, Linkermann A, Jouan-Lanhouet S, et al. Regulated necrosis: the expanding network of non-apoptotic cell death pathways. Nature reviews. Molecular Cell Biol. 2014;15:135–147.
- Newton K. RIPK1 and RIPK3: critical regulators of inflammation and cell death. Trends Cell Bio. 2015;25(6):347–353.
- Ziolkowska M, Koc A, Luszczykiewicz G, et al. High levels of IL-17 in rheumatoid arthritis patients: IL-15 triggers in vitro IL-17 production via cyclosporin A-sensitive mechanism. J Immunol. 2000;164(5):2832–2838.
- Brennan FM, McInnes IB. Evidence that cytokines play a role in rheumatoid arthritis. J Clin Invest. 2008;118(11):3537–3545.
- Durand M, Boire G, Komarova SV, et al. The increased in vitro osteoclastogenesis in patients with rheumatoid arthritis is due to increased percentage of precursors and decreased apoptosis – the in vitro osteoclast differentiation in arthritis (IODA) study. Bone. 2011;48(3):588–596.
- Yago T, Nanke Y ,Ichikawa N, et al. IL-17 induces osteoclastogenesis from human monocytes alone in the absence of osteoblasts, which is potently inhibited by anti-TNF-alpha antibody: a novel mechanism of osteoclastogenesis by IL-17. J Cell Biochem. 2009;108:947–955.
- Lam J, Takeshita S, Barker JE, et al. TNF-alpha induces osteoclastogenesis by direct stimulation of macrophages exposed to permissive levels of RANK ligand. J Clin Invest. 2000;106:1481–1488.