
Abstract
Systemic Lupus Erythematosus (SLE) is an autoimmune disorder that causes a breakdown of immune tolerance. Current treatments mainly involve general immunosuppression, increasing the risk of infections. On the other hand, Bacillus Calmette-Guérin (BCG) has been investigated as a potential therapy for autoimmune diseases in recent years, prompting an ongoing investigation. This study aimed to evaluate the effect of BCG vaccination on early and late clinical presentation of SLE in a murine disease model. MRL/MPJ-Faslpr mice were immunized with BCG or treated with PBS as a control. The progress of the disease was evaluated at 27 days post-immunization (dpi) (early) and 56 dpi (late). Clinical parameters and proteinuria were monitored. Blood samples were collected for measurement of antinuclear antibodies (ANAs), anti-double-stranded DNA (anti-dsDNA), and cytokine determination was performed using ELISA. Samples collected from mice were analyzed by flow cytometry and histopathology. We observed a clinical improvement in BCG-treated mice, reduced proteinuria in the latter stages of the disease, and decreased TNF-α. However, BCG did not elicit significant changes in ANAs, anti-dsDNA, histopathological scores, or immune cell infiltration. BCG was only partially beneficial in an SLE mouse model, and further research is needed to determine whether the immunity induced by this vaccine can counteract lupus’s autoimmune response.
Introduction
Systemic Lupus Erythematosus (SLE) is a multifactorial autoimmune disease associated with the loss of immune tolerance and the presence of autoantibodies [Citation1–5]. The disease leads to cumulative organ damage over time with a wide range of clinical manifestations, mainly involving the kidneys, lungs, skin, gastrointestinal tract, musculoskeletal, cardiovascular, and central nervous systems [Citation2,Citation4]. One of the main manifestations of SLE is kidney damage, known as lupus nephritis (LN), caused by a type 3 hypersensitivity reaction that results in the deposition of circulating immunocomplexes in the renal glomeruli, where anti-dsDNA autoantibodies would be the main responsible [Citation6]. SLE can affect people of any age and sex but primarily women of childbearing age, especially those around the ages of 15 and 24 years old [Citation2,Citation7]. SLE shows a female-to-male ratio of about 9:1, being one of the leading causes of death in young women [Citation8]. This autoimmune disease also shows a higher incidence in African-American, Hispanic, and Asian populations as compared to the Caucasian population [Citation2,Citation7].
The autoimmune response generated by SLE involves the exposure to nuclear autoantigens caused by an impairment of apoptotic cell clearance and the neutrophils forming extracellular traps (NETs) [Citation9,Citation10], stimulating plasmacytoid dendritic cells (pDCs) to produce type I interferon (IFN) [Citation10,Citation11]. IFN promotes the differentiation of monocytes, impairing regulatory T cells and activating B cells to produce autoantibodies against nucleic acids [Citation1,Citation12]. Additionally, DCs play a crucial role in the pathogenesis of SLE because they activate or initiate the adaptive immune response [Citation13,Citation14]. Studies in SLE patients and murine models have reported alterations in the expression of co-stimulatory molecules such as CD40, CD80, and CD86 by DCs [Citation11,Citation15]. The increased expression of co-stimulatory molecules enhances DC capacity to activate autoreactive T cells, to increase the expansion of follicular helper T cells, and improve the germinal center response [Citation11,Citation15]. During SLE, DCs also show alterations in inhibitory surface molecules such as FcɣRIIb and PD-L1, which can decrease their regulatory capacity [Citation11,Citation15].
The clinical presentation of SLE patients can be heterogeneous, underscoring the need for personalized treatment approaches [Citation16]. Despite this, the most used treatments are antimalarials, glucocorticoids, and immunosuppressants [Citation17,Citation18]. Hydroxychloroquine (an antimalarial) is recommended for mild cases, while prednisone or cyclophosphamide are suggested for organ or life-threatening conditions [Citation18]. However, these treatments can cause adverse effects ranging from weight loss or muscle pain to retinal damage [Citation5,Citation19] and severe infection [Citation14,Citation20]. Biologic agents such as belimumab or rituximab are options for patients who do not respond to other treatments, but their high-cost limits access to these drugs [Citation21–23]. In addition, anti-CD19 CAR-T cell therapy has shown promising results in achieving remission in refractory patients, although more data are needed for widespread use [Citation24]. Currently, new experimental therapies have also been proposed, such as tolerogenic DCs (tolDCs), a promising approach given the role of DCs in the pathogenesis of the disease, as mentioned above [Citation25–27].
Along the lines of alternative treatments, Bacillus Calmette Guérin (BCG) has been used as a treatment for multiple autoimmune diseases due to its characteristics and the immune response elicited by this vaccine [Citation28,Citation29]. BCG is an attenuated Mycobacterium bovis strain and the current vaccine administered against Mycobacterium tuberculosis (M.tb) in most countries [Citation29,Citation30]. This vaccine is well known for its ability to potentiate the immune response induced by other vaccines [Citation28,Citation30,Citation31] but has also been evaluated as an immunomodulatory agent, promoting nonspecific immunomodulatory effects [Citation30,Citation32,Citation33].
Thus, there are clinical trials that propose the use of BCG as a treatment for autoimmune diseases, with encouraging outcomes in Multiple Sclerosis (MS) and Type 1 Diabetes (T1D) [Citation33–35]. In the case of MS, the frequency of active demyelinated lesions was reduced by BCG vaccination [Citation33,Citation36,Citation37]. On the other hand, for T1D, BCG was shown to control blood sugar, reduce glycated hemoglobin levels, and increase the death of autoreactive T cells that recognized insulin [Citation28,Citation34,Citation38,Citation39]. Interestingly, studies carried out in non-obese diabetic (NOD) mice showed that even though BCG administration diminished T1D symptoms, it induced in mice a disease similar to SLE [Citation40,Citation41]. However, these studies suggested that certain genomic regions caused this shift after exposure to 2.6 x10⁷ CFU of heat-killed BCG [Citation40,Citation41]. Considering that NOD-mice are predisposed to an exacerbated immune response, unrelated to SLE, it remains important to evaluate the effect of BCG in more frequently employed SLE mouse models, such as MRL/MPJ-Faslpr and NZB/NZW F1 hybrid mice [Citation5,Citation42–44]. Studies conducted on MRL/MPJ-Faslpr mice have shown that administration of 1 x 10⁵ CFU BCG Montréal at 16 weeks increased longevity and survival while delaying the development of DNA-specific IgG antibodies [Citation42]. Along these lines, administration of 1 x 10⁶ CFU of BCG D2PB 302 improved the concentration of complement C4 protein in MRL/MPJ-Faslpr mice serum and reduced kidney damage [Citation43]. On the contrary, another study conducted on 5- and 7-month-old NZB/NZW F1 hybrid mice showed that administration of approximately 1 x 10⁷ CFU BCG Pasteur led to an early death compared to their saline controls, however, it did not alter anti-DNA levels when compared to control animals [Citation45]. The apparent disagreement between these studies could be due to the strain of BCG used and the age of the animals because older mice show a more severe disease [Citation42,Citation43,Citation45].
To address the variance of previous results, it is important to consider that SLE is a chronic and heterogeneous autoimmune disease with a wide range of clinical and immune characteristics, that shows significant variability in human patients and murine models, being the age one of the parameters contributing to variance [Citation46]. To approach these questions, we compared early and late manifestations of SLE after the administration of a lower dose of BCG Danish strain (1 x 10⁴) to 6–8-week-old MRL/MPJ-Faslpr mice. The Danish strain is an ancestor of the D2PB 302 strain [Citation47], which has shown favorable results in the SLE model [Citation43], but has the advantage of being widely used as a vaccine, and treatment of bladder cancer, presenting a high immunogenicity and safety profile [Citation47,Citation48]. This study evaluates whether BCG immunization could reduce symptoms and disease parameters in MRL/MPJ-Faslpr mice, a spontaneous murine model for SLE. Using this model, we assessed whether a lower dose of the BCG vaccine could modify the outcome of this chronic autoimmune disease at different times post-immunization. Our results showed that BCG immunization promotes a clinical improvement in MRL/MPJ-Faslpr mice, alongside a decrease in TNF-α and proteinuria levels, reducing the progression of renal damage. However, no significant changes were seen in ANAs, anti-dsDNA levels, histopathological analyses, or the evaluation of immune cell populations. These data suggest a partially beneficial role of BCG in SLE.
2. Materials and methods
2.1. Animals
Initial colonies of male and female MRL/MPJ-Faslpr/J mice were purchased from Jackson Laboratory and kept under pathogen-free conditions at Pontificia Universidad Católica de Chile. Animals were provided with food and water ad libitum. Animals between six and eight weeks old were immunized with BCG or treated with PBS. Further on, these animals were distributed into early stage (n = 18) (n = 9 per experimental condition), denominated group A, in which an early euthanasia was carried out and late stage (n = 18) (n = 8 PBS and n = 10 BCG), denominated group B with a late euthanasia. All animals were manipulated under the supervision of a veterinarian and according to the guidelines provided by the institution and the American Association of Laboratory Animal Science.
2.2. Ethics statement
Animals were supervised under the approval of the Scientific Ethics Committee for the Care of Animals and the Environment of the Pontificia Universidad Católica de Chile, protocol number 220921007.
2.3. BCG culture, doses, and characterization
BCG doses (Danish 1331 strain) were generated by growing the mycobacteria in 7H9 media, with fungizone (250 ug/mL), PBS-Tween 80 5%, and supplemented with 10% OADC. Bacteria were grown until an optical density (OD) equal to 0.8. For the DNA extraction, mycobacteria were centrifuged and resuspended in nuclease-free H2O. The sample was heated at 100 °C, centrifuged again, and the supernatant was collected. The BCG strain was characterized using the Polymerase Chain Reaction (PCR) for the 16s and is6110 genes. The remainder of mycobacteria was washed twice with 1X PBS-Tween 80 0,05% and once with PBS 1X for doses. Lastly, the mycobacteria were resuspended in 1X PBS-glycerol 50% at a final concentration of 1 x 10⁸ CFU per vial and frozen at −80 °C until use. For immunization, dose vials were centrifuged and resuspended in PBS 1X to reach a concentration of 1 x 10⁴ CFU in a final volume of 100 μl per dose.
2.4. Immunization schedule and blood and tissue sample collection
Mice were immunized subcutaneously with 1 x 10⁴ CFU BCG strain previously characterized or administered sterile PBS as vehicle control, both at a final volume of 100 μL. After immunization, mice were monitored daily for 3 days and every other day after that until the endpoint of the experiment. Mice were divided into two experiments, early stage (group A) (n = 9 per experimental condition, total n = 18) and late stage (group B) (n = 8 PBS and n = 10 BCG, total n = 18), according to the day of euthanasia, which was 28 and 56 days after immunization, respectively. At the end of the experiment, mice were intraperitoneally anesthetized with a lethal dose of ketamine/xylazine (100 mg/kg and 20 mg/kg, respectively). Kidney samples were collected for histopathological analyses. Blood, kidney, and spleen samples were collected for flow cytometry analyses. Data were only acquired and analyzed from mice that reached the endpoint of the experiments. Only two mice (from the PBS-treated group) died before completion and were not included in the analyses.
2.5. Assessment of clinical score and urinary protein determination
Animals were monitored at day 0, before BCG immunization, during the first three days after vaccination, and every other day throughout the experiment. The clinical score assessment was carried out according to the following parameters, which were carefully revised by a veterinarian: Body weight loss (0= less than 2%; 1 = 2–10%; 2 = 11–15%; 3 = 16–20%), appearance (0 = normal; 1 = neglected hair; 2 = neglected hair, secretions; 3 = abnormal posture), behavior (0 = normal; 1 = small change in behavior or mobility; 2 = light hyperactivity, isolation, uneasiness; 3 = aggression, self-mutilation, vocalizations, lethargy, stereotypies), skin lesions (0 = normal; 1 = one < 0.5 cm2; 2 = more than one 0.5 cm2 − 1 cm2; 3 = more than one > 1 cm2, ear necrosis), lymph nodes (0 = normal; 1 = palpable small lymph nodes < 1 cm in two or more bilateral sites; 2 = big lymph nodes > 1 cm in one site, or 2 small lymph nodes in two bilateral sites; 3 = big lymph nodes in two or more bilateral sites), breathing (0 = normal, synchronic; 1 = partial changes, increased respiratory rate; 2 = tachypnea with abdominal respiration; 3 = cyanosis, gasps), dehydration (0 = normal, return of the skin fold in less than 2 s; 1 = delay (2–4 s) in the return of the skin fold, light dehydration (5%); 2 = delay (4–6 s) in the return of the skin fold, moderate dehydration, slight sunken eyes (8%); 3 = skin fold takes longer than 6 s to return to its normal position, very sunken eyes, dry mucosa, severe dehydration (>10%)) and proteinuria were measured from fresh urine with CentriVet urine reagent strips (Insuvets #U031-108) using the same scale as before (0 = negative; 1 = 30 mg/dL albumin; 2 = 100 mg/dL albumin; 3 = 300 mg/dL albumin). The color change of the strip was visually categorized from 0 to 3 according to a reference table provided by the supplier. Thus, the maximum possible score value to achieve would be 24.
2.6. Measurement of antinuclear antibodies
Antinuclear antibodies were measured using the ORG 870 Anti-Nuclear Antibodies Hep-2 (ANA-Hep2) (ORGENTEC Diagnostika GmbH; #ORG870), according to the instructions provided by the manufacturer. Briefly, sera were collected from blood samples taken throughout the experiment. Diluted samples (1:80) were incubated in the HEp-2 slides in a humid chamber for 30 min at room temperature. Human serum containing 0.09% sodium azide, was used as a negative control, and human serum containing homogeneous standard ANA, 0.09% sodium azide, was used as a positive control. The kit provided these positive and negative control samples. After incubation, the slides were removed and rinsed briefly with wash buffer (PBS 1X) using a squeeze wash bottle. After the washing procedure, the slides were incubated with a 1:300 dilution of Alexa Fluor 488 (FITC) Goat Anti-Mouse IgG (minimal x-reactivity, clone: poly4053, Cat: 405319, Lot: 3235844) for 30 min at room temperature in the dark. Controls were incubated with anti-human IgG conjugated with FITC provided by the kit. The slides were rewashed, and ProLongTMGlass Antifade Mountant media (#2157950) was added. Pictures were taken at 10X using the OLYMPUS BX51 fluorescence microscope and Infinity Capture software to capture images taken with the INFINITY 2 camera. The following configuration was used to capture the cells: WB Gain Adjustment (R: 1.77; B: 1.25), exposure in an extended range (0:3.1 ms). The following configuration was used to observe fluorescence: exposure in an extended range (3:790 ms). Pictures were analyzed with Image J software. Mean fluorescence intensity (MFI) was measured from every picture to determine positive cells for ANA. First, a binary mask was generated, a Gaussian filter was applied, and the background fluorescence was removed if necessary. From this, the cells were selected by area, and a threshold was established to capture their fluorescence. Finally, the MFI was measured, and these values were averaged per group, thus obtaining the MFI value per mouse per group.
2.7. Measurement of anti-dsDNA
Indirect ELISA determined IgG antibodies against double-stranded DNA (anti-dsDNA) present in serum samples. Briefly, plates were coated overnight at 4 °C with 100 ng of Calf Thymus DNA (Invitrogen #15633019) and blocked with PBS-FBS 10%. Plates were washed with PBS-Tween 0.05%, and diluted sera samples (1:600) obtained at the beginning and the end of each experiment were added. After incubation, plates were washed, and a detection antibody (Invitrogen #626520) conjugated with horseradish peroxidase (HRP) (1:4000) was added. Lastly, plates were washed, and 3′,3′,5′,5′-tetramethylbenzidine (TMB) and the stop solution (H2SO4 2 N) was added. OD was read at 450 nm.
2.8. Enzyme-linked immunosorbent assays: sandwich ELISA
Cytokine determination from sera samples was carried out by sandwich ELISAs according to the manufacturer’s instructions. The cytokines evaluated were IFN-γ and TNF-α (BD OptEIA). Briefly, plates were coated overnight at 4 °C with the capture antibody (1:250) for each cytokine and blocked with PBS-FBS 10%. Plates were washed with PBS-Tween 0.05%, and sera samples obtained at the end of each experiment were added. After incubation, plates were rewashed, and a detection antibody conjugated with horseradish peroxidase (HRP) (1:250) was added. Lastly, plates were washed, and 3′,3′,5′,5′-tetramethylbenzidine (TMB) and the stop solution (H2SO4 2 N) was added. Absorbance was read at OD450nm.
2.9. Histopathology
Kidney samples were harvested and fixated in 4% paraformaldehyde at 4 °C for 24 h. Formalin-fixed tissue was embedded in paraffin and cut into 3 μm sections. The tissue was stained with Periodic Acid-Schiff stain (Bio-Optica Kit). The obtained slides were scanned with Grundium Ocus®40, analyzed with QuPath software (version 0.4.3), and classified from class I to IV based on the current classification of LN of the International Society of Nephrology/Renal Pathology Society 2003. Class I: Mesangial lupus-like glomerulonephritis. The proliferation of mesangial cells and immune complex deposits does not affect the glomerular capillary. Null or light increase of the mesangial matrix and the number of mesangial cells. Presence of mesangial deposits of immunoglobulins and complement. Class II. Mesangial lupus-like glomerulonephritis. The proliferation of mesangial cells and immune complex deposition without affecting glomerular capillary. There is a slight increase in the mesangial matrix and the number of mesangial cells. Presence of mesangial deposits of immunoglobulins and complement. Class III. Focal proliferative glomerulonephritis. Less than 50% of affected glomeruli. It can present the formation of wire loops, fibrinoid necrosis, endothelial and mesangial cell proliferation, leukocyte infiltration, eosinophil deposits, or intracapillary thrombosis. Class IV. Diffuse proliferative glomerulonephritis. More than 50% of glomeruli are affected. Anatomopathological glomeruli changes can be identical to Class III.
2.10. Flow cytometry
Leukocytes isolation
Blood samples were centrifuged, and plasma was discarded. ACK buffer was added to the cells and incubated at room temperature to lyse the red blood cells, FACS buffer (PBS buffer, 0.5% BSA, and 2 mM EDTA) was added, centrifuged, and the supernatant was discarded.
The kidney and spleen samples were ground by passing through a 70 μm cell strainer, the cell suspension was centrifuged, the supernatant was discarded, and ACK buffer was added to the cells, and they were incubated at room temperature. FACS buffer was added and centrifuged for 5 min, discarding the supernatants.
2.11. Antibody staining
The suspended cells were stained with viability dye (BD Horizon™ Fixable Viability Stain 700 or BD Horizon™ Fixable Viability Stain 780) in PBS at 4 °C. Then, the cells were washed twice in PBS. Subsequently, the cells were stained overnight at 4 °C with the antibodies using a mix in FACS buffer with the two following panels: For lymphoid cells: anti-CD45 (30-F11, BV510, BD Biosciences), anti-TCR-β (H57-597, PerCP-Cy 5.5, BD Biosciences), anti-CD4 (RM4-5, BV650 or FITC, BD Biosciences or FITC, Biolegend), anti-CD8a (53–6.7, APC-Cy 7 or PE, BD Biosciences), anti-CD19 (1D3, PE-Cy7, BD Biosciences) and anti-CD69 (H1.2F3, BV785, Biolegend). On the other hand, for the myeloid cells, the following panel was used: anti-CD45 (30-F11, BV510, BD Biosciences), anti-CD11b (M1/70, APC-Cy 7 or FITC, BD Biosciences) and anti-CD11c (HL3, PE-Cy 7, BD Biosciences). After staining, cells were washed twice and resuspended in FACS buffer. Data was collected using LSRFortessa X20 Analyzer (BD Bioscience) and analyzed with FlowJo software.
2.12. Statistical analyses
All statistical analyses were performed using Prism version 8 software (Graphpad, San Diego, CA). The normality of the data was assessed using a residual analysis for each set of results. Thus, in cases where normality was met, a two-way ANOVA test was used, while in cases where the normality of the data was not met, the Mann-Whitney test was used. Additionally, Pearson correlation was performed using RStudio using the cor() and corrplot() functions to calculate the correlation parameter (R) that quantifies the correlation between two independent variables.
3. Results
3.1. Clinical changes in BCG-immunized lupus-prone mice
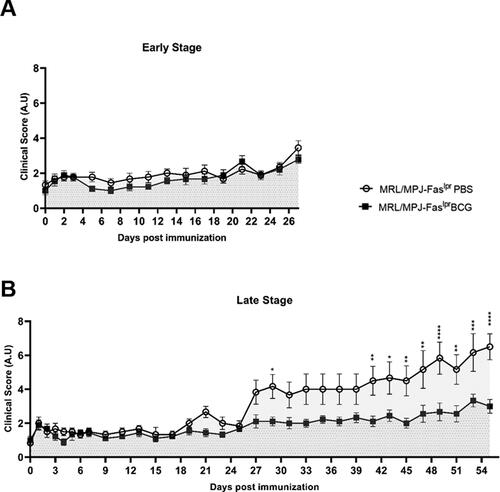
To determine changes in the overall clinical score, animals were evaluated every other day throughout the experiment. The parameters assessed were classified from 0–3 in arbitrary units. In group A (early stage), changes were only noticed toward the end of the experiment, where the clinical score for all mice tended to increase; however, no statistical differences were seen between groups (). Around 27 days post-immunization (dpi), this increase showed differences between each mice group, as could be noted for group B (late stage). The MRL/MPJ-Faslpr mice treated with PBS showed a constant increase in the clinical score, whereas BCG-immunized MRL/MPJ-Faslpr mice present a steady clinical score value, as could be noted by statistical differences (). The main differences were noticeable from day 41 and continued to increase until the day of euthanasia.
Figure 1. Reduction of clinical scores in BCG-immunized group at late-stage of disease in SLE-prone mice. The clinical score of MRL/MPJ-Faslpr mice was determined following the parameters indicated in the previous section. The Y-axis indicates the clinical score, and the X-axis shows the days after vaccination. (A) Early stage (group A) n = 18 (n = 9 PBS, n = 9 BCG). (B) Late stage (group B) n = 18 (n = 8 PBS, n = 10 BCG). ○: MRL/MPJ-Faslpr mice treated with PBS with an area under the curve (AUC) of 51.78 (95% confidence interval; 42.97-60.59) in group A, and 177.3 (95% confidence interval; 153.30-201.30) in group B. ■: MRL/MPJ-Faslpr mice immunized with BCG with an AUC of 45.61 (95% confidence interval; 38.22-53.00) in group A, and 103.4 (95% confidence interval; 90.82-116.10) in group B. The AUC difference in group B was statistically significant (p < 0.05). A two-way ANOVA with tukey post-test analyzed statistical differences (≥ 0.05 (ns), 0.01 - 0.05(*), 0.001 - 0.01 (**), 0.0001 - 0.001 (***), < 0.0001 (****)). bars indicate mean ± SEM.
3.2. Reduced progression of renal damage in BCG-immunized lupus-prone mice
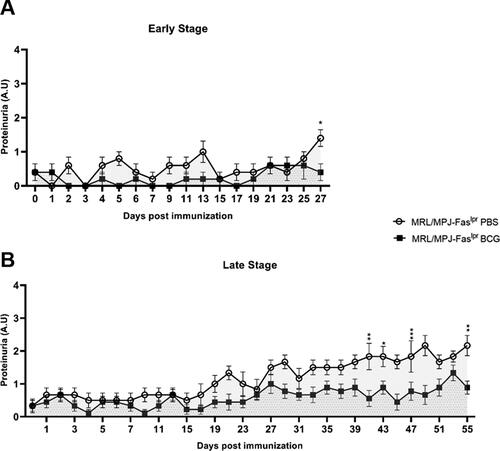
Proteinuria levels were determined on a scale of 0-3 to elucidate further changes elicited by BCG. In group A (early stage), proteinuria levels from both groups did not follow an apparent tendency, and the values remained under two (). However, on the day of euthanasia, an increase in proteinuria levels was observed in the MRL/MPJ-Faslpr PBS group, with a significative difference compared to the BCG-immunized group (). On the other hand, group B (late stage) showed similar behavior in the first 27 days post-immunization, with an increment of proteinuria levels in the PBS-treated group since then. However, this increase in proteinuria levels started to be significant from day 41 up to the end point of euthanasia ().
Figure 2. Proteinuria levels are reduced in BCG-immunized mice at a late-stage of disease. The proteinuria levels of MRL/MPJ-Faslpr were determined following the proteinuria parameter indicated previously. Y axis indicates proteinuria values according to albumin concentration (0 = negative; 1 = 30 mg/dL albumin; 2 = 100 mg/dL albumin; 3 = 300 mg/dL albumin). The x-axis indicates the days after immunization. (A) Early stage (group A) n = 18 (n = 9 PBS, n = 9 BCG). (B) Late stage (group B) n = 18 (n = 8 PBS, n = 10 BCG). ○: MRL/MPJ-Faslpr mice treated with PBS with an AUC of 8.50 (95% confidence interval; 5.63-11.37) in group A, and 35.92 (95% confidence interval; 30.98-40.85) in group B. ■: MRL/MPJ-Faslpr mice immunized with BCG with an AUC of 3.80 (95% confidence interval; 1.32-6.28) in group A, and 18.17 (95% confidence interval; 13.43-22.90) in group B. The AUC difference in group B was statistically significant (p < 0.05). A two-way ANOVA with tukey post-test analyzed statistical differences (≥ 0.05 (ns), 0.01–0.05(*), 0.001 - 0.01 (**), 0.0001–0.001 (***), < 0.0001 (****)). bars indicate mean ± SEM.
3.3. BCG immunization does not significantly alter antinuclear MFI or anti-dsDNA antibodies in lupus-prone mice
Based on the observed changes in the clinical score and proteinuria levels of BCG-immunized mice, ANAs, an entry criterion for SLE diagnosis in patients, were measured.
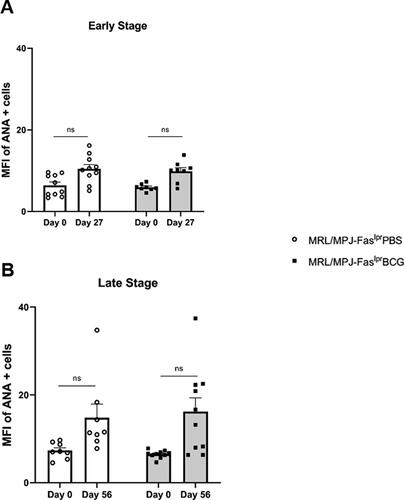
In group A (early stage), MFI of HEp-2 staining started at a basal level on day 0 (pre-immune) with a low dispersion of the data. After 27 days, a non-statistically significant increase in MFI was observed, with no differences between the immunized and PBS-treated groups (; Supplementary Figure 1). Similarly, the determinations derived from the late-stage assays showed a low basal level of MFI at day 0 that increases at day 56 with no statistically significant differences. These data suggest that there are also no apparent differences between the groups immunized with BCG and treated with PBS and evaluated at a later disease stage (; Supplementary Figure 1). When the pattern of nuclear fluorescence was evaluated, both groups showed similar nuclear rim, nucleolar, and diffuse (homogeneous) staining (Supplementary Figure 1).
Figure 3. BCG immunization does not alter ANAs of lupus-prone mice. The Y-axis indicates the mean fluorescence intensity (MFI) of ANA-positive cells. The X-axis shows the days after immunization. (A) Early stage (group A) n = 18 (n = 9 PBS, n = 9 BCG). (B) Late stage (group B) n = 18 (n = 8 PBS, n = 10 BCG). ○: MRL/MPJ-Faslpr mice treated with PBS. ■: MRL/MPJ-Faslpr mice immunized with BCG. A two-way ANOVA with tukey post-test analyzed statistical differences (≥ 0.05 (ns), 0.01–0.05(*), 0.001–0.01 (**), 0.0001–0.001 (***), < 0.0001 (****)). bars indicate mean ± SEM.
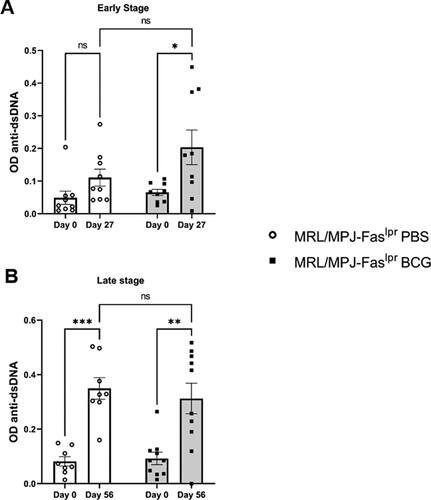
To further characterize and specify ANAs results, we quantified anti-dsDNA antibodies in sera samples by ELISA [Citation11,Citation49,Citation50]. In group A, we observed that BCG-immunized mice showed an earlier elevation of anti-dsDNA compared to the PBS group (). On the other hand, in the late-stage analysis, when comparing day 0 to day 56, we observed a non-statistical trend for a higher elevation of anti-dsDNA in the PBS group compared to the BCG-immunized group ().
Figure 4. BCG immunization does not alter anti-dsDNA antibodies. The Y-axis indicates OD450. The X-axis shows the days after immunization. (A) Early stage (group A) n = 18 (n = 9 PBS, n = 9 BCG). (B) Late stage (group B) n = 18 (n = 8 PBS, n = 10 BCG). ○: MRL/MPJ-Faslpr mice treated with PBS. ■: MRL/MPJ-Faslpr mice immunized with BCG. A two-way ANOVA analyzed statistical differences (≥ 0.05 (ns), 0.01 - 0.05(*), 0.001 - 0.01 (**), 0.0001 - 0.001 (***)). Bars indicate mean ± SEM.
3.4. Positive correlation between antinuclear antibodies and clinical scores
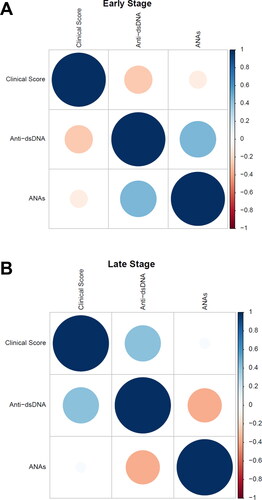
Based on the previous results, a similar trend can be observed between ANAs and anti-dsDNA levels. Considering the importance of these immunoassays in SLE, the question arises as to whether these variables correlate to the clinical parameters associated with the disease, and to the clinical score that was measured throughout BCG immunization or PBS treatment. Therefore, a measurement of the correlation of these variables was carried out using RStudio (; Supplementary Figure 2A–B). These analyses show that in the case of the early group, a positive correlation (R = 0.45) was observed between ANAs and anti-dsDNA. However, no correlation was observed between these variables and the clinical score (; Supplementary Figure 2D). On the other hand, in the case of the late-stage group, a positive correlation between ANAs and anti-dsDNA with the clinical score (R = 0.037 and R = 0.41 respectively) was observed (; Supplementary Figure 2D–E), which suggests an association between these variables.
Figure 5. Positive correlation between antinuclear antibodies and clinical scores. The figures show the Pearson correlation matrix for the clinical score, anti-dsDNA, and ANAs variables for early (A) and late (B) times. The correlation is represented by circles, where the area of the circle is directly proportional to the correlation between the variables, and this value is quantified by a heat map located on the right side of the matrix, ranging from -1 to 1, representing negative and positive correlation, respectively. (A: n = 18, B: n = 18).
3.5. BCG does not cause significant changes in renal histopathology in lupus-prone mice
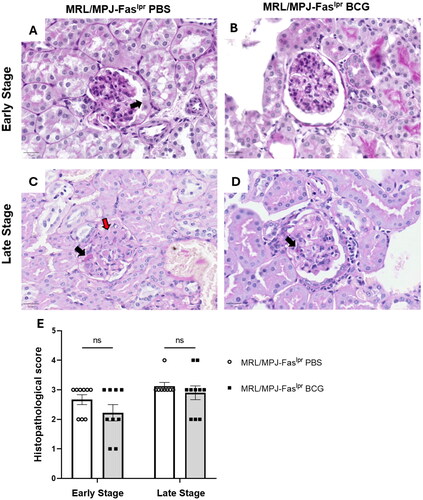
The histopathological scoring was obtained for each group of mice (). In group A, kidney damage decreased slightly in BCG-treated mice, while in group B of late-stage euthanasia, kidney damage was equivalent for both groups (PBS and BCG) (). Also, although kidney damage tends to increase over time, no significant differences were observed between early and late stages of the disease ().
Figure 6. BCG immunization does not generate significant changes in renal histopathological damage. Kidney samples stained with Periodic Acid schiff (PAS) stain were evaluated by light microscopy at 40X magnification to determine the histopathological score for grading active lesions based on the current classification of lupus nephritis of the international society of nephrology/renal pathology society 2003. (A) Histopathological score. The y-axis shows the histopathological score, and the X-axis shows the experimental scheme. Early stage (group A) n = 18 (n = 9 PBS, n = 9 BCG). and late stage (group B) n = 18 (n = 8 PBS, n = 10 BCG). ○: MRL/MPJ-Faslpr mice treated with PBS. ■: MRL/MPJ-Faslpr mice immunized with BCG. Representative images for each treatment on early and late stages of the disease (B-E), (B) MRL/MPJ-Faslpr PBS on early euthanasia, arrow points to fibrocellular crescents. (C) MRL/MPJ-Faslpr BCG on early euthanasia shows an endothelial and proliferation of mesangial cells. (D) MRL/MPJ-Faslpr PBS on late euthanasia, the black arrow points to eosinophil deposits, and the red arrow indicates fibrinoid necrosis. (E) MRL/MPJ-Faslpr BCG on late euthanasia, black arrow points to eosinophil deposits. A two-way ANOVA with tukey post-test analyzed statistical differences (≥ 0.05 (ns), 0.01 - 0.05(*), 0.001 - 0.01 (**), 0.0001 - 0.001 (***), < 0.0001 (****)). bars indicate mean ± SEM.
3.6. BCG immunization reduces serum TNF-α in lupus-prone mice
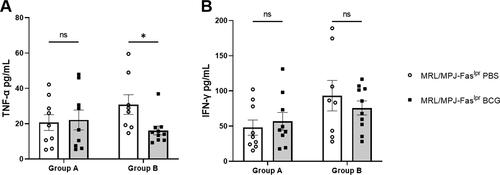
To further characterize the immune profile after BCG immunization, the secretion of IFN-γ and TNF-α was measured in serum samples. Secretion of both cytokines tended to increase in BCG-vaccinated MRL/MPJ-Faslpr mice at an early stage of evaluation; however, no significant differences were seen between PBS-treated or BCG-immunized MRL/MPJ-Faslpr mice (). In contrast, in the late-stage group, TNF-α secretion showed a significant decrease in the BCG-immunized group, while IFN-γ did not show significant changes ().
Figure 7. BCG immunization reduces serum TNF-α in lupus-prone mice. Cytokine concentrations were evaluated by sandwich ELISA. The y-axis shows the concentration in pg/mL, and the X-axis shows the weeks after immunization (group A: Early stage; n = 18 (n = 9 PBS, n = 9 BCG).) and (group B: Late stage; n = 18 (n = 8 PBS, n = 10 BCG)). (A) TNF-α. (B) IFN-γ. ○: MRL/MPJ-Faslpr mice treated with PBS. ■: MRL/MPJ-Faslpr mice immunized with BCG. A Mann-Whitney test with a two-tailed p-value, α = 0.05, analyzed statistical differences (p ≥ 0.05 (ns), 0.01 - 0.05(*), 0.001 - 0.01 (**), 0.0001 - 0.001 (***), < 0.0001 (****)). bars indicate mean ± SEM.
3.7. BCG increases the frequency of activated CD4+ and CD8+ T cells
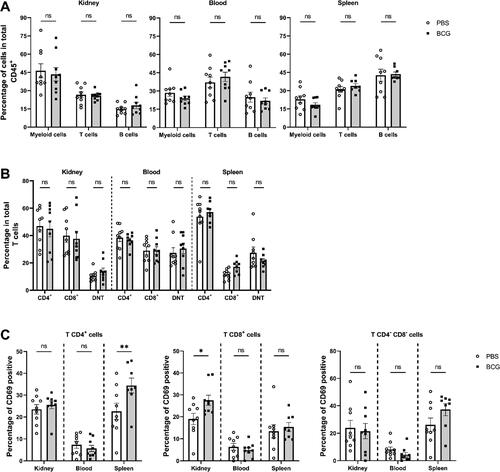
As part of the evaluation of the autoimmunity profile, flow cytometry assays were performed in the early-stage group to evaluate the changes produced in the leukocyte subpopulations in peripheral blood, spleen, and kidney. In addition to assessing the central populations, T-cell activation was evaluated using the CD69 marker. No significant changes were observed in terms of T, B, or myeloid cells (CD11c+ CD11b+) between the BCG-treated group and the PBS-treated control group (). A significant increase was observed for the activation of T lymphocyte subsets in the BCG-immunized group, such as CD4+CD69+cells in the spleen, and CD8+CD69+ cells in the kidney. In contrast, no significant differences were observed in double negative T cells (DNT) activation ().
Figure 8. BCG increases the frequency of activated CD4+ and CD8+ T cells. (A) The Y axis shows the percentage of cells compared to the total CD45+ cells, and the X axis shows the leukocyte populations myeloid cells (CD11b+/CD11c+), T cells (TCR-β+) and B cells (CD19+). (B) The Y axis shows the percentage of cells from T cells, and the X axis shows the CD4+, CD8+, and CD4-CD8- (double negative T cells (DNT)) subpopulations, also indicating the organs analyzed. (C) The percentage of CD69+ (early activation marker) cells is shown on the Y axis, and the organs analyzed are shown on the X axis. ○: MRL/MPJ-Faslpr mice treated with PBS. ■: MRL/MPJ-Faslpr mice immunized with BCG. A two-way ANOVA analyzed statistical differences (≥ 0.05 (ns), 0.01 - 0.05(*), 0.001 - 0.01 (**), 0.0001 - 0.001 (***), < 0.0001 (****)). Bars indicate mean ± SEM. n = 18 (n = 9 PBS, n = 9 BCG).
4. Discussion
SLE is an autoimmune disorder associated with loss of immune tolerance, which causes immune complex deposition and autoantibody production [Citation51–53]. Current treatments are based on antimalarial, glucocorticoids, and immunosuppressive drugs [Citation8,Citation54]. However, these treatments are only partially effective, and prolonged exposure can cause considerable damage [Citation55]. This promotes the search for new possible therapies for SLE [Citation2,Citation55].
BCG is the vaccine commonly administered against tuberculosis [Citation30,Citation31,Citation56–58]. However, its therapeutic role has also been studied in cancer and autoimmune diseases, showing positive results in MS and T1D [Citation28,Citation39,Citation59]. In those studies, researchers have proposed that BCG induces an effect through the death of autoreactive T cells and the expansion of regulatory T cells [Citation39]. However, although BCG has shown promising results in other autoimmune diseases such as multiple sclerosis and type 1 diabetes [Citation33–35], the impact of this vaccine on SLE remains unclear [Citation46].
In the present study, we evaluated whether BCG immunization could work as a treatment for SLE in a murine MRL/MPJ-Faslpr model. By using a specific strain of BCG in a well-established SLE murine model, our work contributes new data about the effectiveness and safety of low-dose BCG immunization to reduce SLE-associated parameters.
The emphasis on administering a low dose of BCG is especially relevant, as previous studies have shown conflicting results when using higher doses [Citation40–45]. The research presented here examines for the first time the effects of a significantly lower dose (1 x 10⁴ CFU) of BCG Danish strain in MRL/MPJ-Faslpr mice. In addition, our study is novel by comparing immunization regimens at two stages of the disease. Furthermore, we evaluated clinical and immunological parameters, making our approach different in its detailed stratification and timing of treatment administration.
A significant finding was that a clinical improvement was shown in the continuously monitored parameters (). This result was observed in the late stage of the disease (), which could imply that the SLE phenotype is less severe in mice of early age, and significant differences are only detected at a higher severity, in the late stage. Similar results have been shown in clinical trials with BCG as a treatment for patients with T1D, in which improvements were not observed in a short time, but they were observed in the long term [Citation38,Citation59].
In our study, the clinical improvement was accompanied by a reduction in proteinuria compared to untreated mice () similar to previously reported results [Citation60] but using a lower mycobacterium dose. In this aspect, we found discordances when evaluating renal histology since we did not find significant differences between the immunized and PBS-treated groups at the evaluated times (). Nevertheless, this discordance also occurs in human LN patients, making it possible to obtain clinical improvements (proteinuria decrease) before a histological improvement is observed [Citation61]. Accordingly, in another study, the correlation between clinical and histological analysis was also not found [Citation62]. This may suggest that the damage to the glomerulus structure reaches an irreversible point in the advanced stages of the disease [Citation61]. Nevertheless, although there are no favorable changes in the structure, the clinical parameters indicate that there would be an improvement in renal function.
Furthermore, we measured changes in the MFI of antinuclear antibodies in immunized mice ( and ). The formation and accumulation of immune complexes formed by anti-dsDNA (a type of ANA) and ds-DNA is the leading cause of kidney damage in lupus patients [Citation63,Citation64]. In concordance with the histological damage, we observed a trend toward an increase in ANAs along the time in PBS-treated and BCG-immunized animals, () according to the disease progression (). However, no significant differences were found for ANAs MFI between BCG-immunized and PBS-treated mice ( and Supplementary Figure 2). Consistently, anti-dsDNA antibodies did not show significant differences in either group, early- or late-stage, with a slight trend to decrease at a slower rate in BCG-immunized mice at the late stage (). This suggests that greater effects of BCG treatment may be observed over longer periods, as reported previously for T1D [Citation38].
The finding of a positive correlation between ANAs and anti-dsDNA with clinical score in the late-stage group, but not in the early group, suggests a temporal progression in the pathogenesis of SLE. In early stages, the lack of correlation with the clinical score could indicate that other immunologic or inflammatory factors play a more prominent role in the early disease manifestations (). On the other hand, in more advanced disease stages, the positive correlation observed (R = 0.45 for ANA and R = 0.41 for anti-dsDNA) may indicate that the clinical improvement promoted by BCG could have an impact on the production of autoantibodies and thus on SLE pathogenesis ().
However, fluorescent HEp-2 cells displayed similar staining patterns between PBS-treated and BCG-immunized groups, suggesting that the nature of autoantibodies remained unchanged. These results agree with our histopathological findings where glomeruli lesions, the most important outcome of anti-DNA IgG displayed similar severity in both, BCG treatment and PBS group (). This also suggests that the benefits of BCG administration on clinical score and proteinuria could be associated with other humoral, or cellular, processes. Unfortunately, the precise mechanism by which BCG administration improved renal function, or delayed renal deterioration remains elusive.
Finally, to determine if BCG administration caused changes associated with an immune response, we evaluated immune parameters, where we observed differences in the immune profiles between the immunized and PBS-treated groups, considering both measurements of proinflammatory cytokines () and the flow cytometry analysis of leukocyte subpopulations ().
We also observed a decrease in TNF-α in the late stage (). It is important to highlight that high serum TNF-α has been indicated as a risk factor for renal involvement and has been proposed as a biomarker for disease activity in SLE patients [Citation65]. Therefore, the fact that BCG reduced this cytokine supports its immunomodulatory potential on SLE. Although BCG is generally used as a TNF-α inducer, it has shown immunoregulatory characteristics in pro-inflammatory diseases, reducing TNF-α [Citation66].
Although the implications of the observed early activation of CD4+ and CD8+ T lymphocytes through the CD69 marker in the spleens and kidneys in the BCG treatment remain elusive (), this CD69 expression has been associated with a CD4+ subpopulation of regulatory T cells both in SLE patients and mouse models [Citation67–69]. Specially, in B6.MRL-Faslpr lupus-prone mice, CD69 has been associated with suppressor markers, such as PD-1, CTLA-4, and IL-10 [Citation70]. Besides, it has been reported that CD4+ CD69+ cells from (NZB × NZW) F1 mice secrete less proinflammatory cytokines, such as IL-2, IL-3, IL-4 and IFN-γ [Citation71], which could lead to an improved clinical outcome after BCG treatment. Consistently with this notion, it has been reported that BCG sensitization induces T cells to express the CD69 activation marker [Citation72].
This study stands out as the first to evaluate the long-term effects (56 days) of BCG vaccination in SLE prone mice and to investigate the impact of a single-dose low dose of BCG on this disease. Along these lines, BCG is known to induce trained immunity that exerts a long-term influence through epigenetic and metabolic reprogramming of immune cells [Citation30,Citation31,Citation56,Citation58]. Although we did not evaluate these changes, we do not rule out that the effect we observe is indirectly related to said property. It is noteworthy that BCG treatment can lead to clinical improvement in monitored parameters, decreased proteinuria, and reduced TNF-α levels. These results suggest a beneficial effect of BCG vaccination on disease progression, supporting the need for further research to evaluate its potential as SLE treatment. However, additional studies need to be conducted to assess whether BCG could diminish the general pro-inflammatory profile of clinical SLE. Trying new immunization schemes, different murine models, or a different BCG dose could be an alternative to be evaluated in future studies. Additionally, the comprehensive evaluation of multiple clinical, histological, and immunological aspects enhances the validity and relevance of the findings, offering insights into a novel therapeutic approach.
Author’s contributions
Conceptualization: V.P.M, A.M.K. Visualization: V.P.M, F.Q, T.T, A.M.K. Methodology: V.P.M, F.Q, T.T, C.O, P.P. Investigation: V.P.M, F.Q, T.T, A.M.K. Writing – original draft V.P.M, F.Q, T.T. Review and editing V.P.M, F.Q, T.T, C.O, J.P.M, S.F, J.A.S, K.B and A.M.K. All authors contributed to the article and approved the submitted version.
Supplementary_Material_Mora _et_al_2024_Submitted.docx
Download MS Word (4.3 MB)Acknowledgments
The authors are grateful to students and researchers at the Biomedical Molecular Immunology Laboratory of the Millennium Institute on Immunology and Immunotherapy for providing guidance and suggesting additional references to incorporate into this article.
Disclosure statement
No potential conflict of interest was reported by the author(s).
Fondo Nacional de Desarrollo Científico y Tecnológico; Instituto Milenio en Inmunología e Inmunoterapia;
Additional information
Funding
References
- Pan L, Lu MP, Wang JH, et al. Immunological pathogenesis and treatment of systemic lupus erythematosus. World J Pediatr. 2020;16(1):19–30. doi: 10.1007/s12519-019-00229-3
- Fortuna G, Brennan MT. Systemic lupus erythematosus. Dent Clin North Am. 2013;57(4):631–655. doi: 10.1016/j.cden.2013.06.003
- Ahmad HI, Jabbar A, Mushtaq N, et al. Immune tolerance vs. immune resistance: the Interaction between host and pathogens in infectious diseases. Front Vet Sci. 2022;9:827407. doi: 10.3389/fvets.2022.827407
- Di Bartolomeo S, Alunno A, Carubbi F. Respiratory manifestations in systemic lupus erythematosus. Pharmaceuticals. 2021;14(3):276. doi: 10.3390/ph14030276
- Mora VP, Loaiza RA, Soto JA, et al. Involvement of trained immunity during autoimmune responses. J Autoimmun. 2023;137:102956. https://linkinghub.elsevier.com/retrieve/pii/S0896841122001640. doi: 10.1016/j.jaut.2022.102956
- Tamirou F, Houssiau FA. Management of lupus nephritis. J Clin Med. 2021;10(4):670. doi: 10.3390/jcm10040670
- Tsokos GC, Lo MS, Reis PC, et al. New insights into the immunopathogenesis of systemic lupus erythematosus. Nat Rev Rheumatol. 2016;12(12):716–730. doi: 10.1038/nrrheum.2016.186
- Barber MRW, Drenkard C, Falasinnu T, et al. Global epidemiology of systemic lupus erythematosus. Nat Rev Rheumatol. 2021;17(9):515–532. doi: 10.1038/s41584-021-00668-1
- Mahajan A, Herrmann M, Muñoz LE. Clearance deficiency and cell death pathways: a model for the pathogenesis of SLE. Front Immunol. 2016;7:35. doi: 10.3389/fimmu.2016.00035
- Tsokos GC. Autoimmunity and organ damage in systemic lupus erythematosus. Nat Immunol. 2020;21(6):605–614. doi: 10.1038/s41590-020-0677-6
- Mackern‐Oberti JP, Llanos C, Riedel CA, et al. Contribution of dendritic cells to the autoimmune pathology of systemic lupus erythematosus. Immunology. 2015;146(4):497–507. doi: 10.1111/imm.12504
- Yu Y, Su K. Neutrophil extracellular traps and systemic lupus erythematosus. J Clin Cell Immunol. 2013;4(02):1–13. doi: 10.4172/2155-9899.1000139
- Mackern-Oberti JP, Jara EL, Riedel CA, et al. Hormonal modulation of dendritic cells differentiation, maturation and function: implications for the initiation and progress of systemic autoimmunity. Arch Immunol Ther Exp. 2017;65(2):123–136. doi: 10.1007/s00005-016-0418-6
- Mackern-Oberti JP, Llanos C, Vega F, et al. Role of dendritic cells in the initiation, progress and modulation of systemic autoimmune diseases. Autoimmun Rev. 2015;14(2):127–139. doi: 10.1016/j.autrev.2014.10.010
- Carreño LJ, Pacheco R, Gutierrez MA, et al. Disease activity in systemic lupus erythematosus is associated with an altered expression of low‐affinity Fcγ receptors and costimulatory molecules on dendritic cells. Immunology. 2009;128(3):334–341. doi: 10.1111/j.1365-2567.2009.03138.x
- Alarcón-Riquelme ME. The heterogeneity of systemic lupus erythematosus: looking for a molecular answer. Revista Colombiana de Reumatología. 2021;28:31–38. doi: 10.1016/j.rcreu.2021.02.006
- Fanouriakis A, Kostopoulou M, Andersen J, et al. EULAR recommendations for the management of systemic lupus erythematosus: 2023 update. Ann Rheum Dis. 2024;83(1):15–29. doi: 10.1136/ard-2023-224762
- Hahn BH, McMahon MA, Wilkinson A, et al. American College of Rheumatology guidelines for screening, treatment, and management of lupus nephritis. Arthritis Care Res . 2012;64(6):797–808. doi: 10.1002/acr.21664
- Melles RB, Marmor MF. The risk of toxic retinopathy in patients on long-term hydroxychloroquine therapy. JAMA Ophthalmol. 2014;132(12):1453–1460. doi: 10.1001/jamaophthalmol.2014.3459
- Suzuki K, Tanaka Y. Infections associated with systemic lupus erythematosus: tackling two devils in the Deep Blue Sea. Indian J Rheumatol. 2023;18(Suppl 1):S3–S11. doi: 10.4103/injr.injr_78_22
- Singh JA, Shah NP, Mudano AS, . Belimumab for systemic lupus erythematosus. Cochrane Database Syst Rev. 2021;2021(2):1–39. doi: 10.1002/14651858.CD010668.pub2
- Atisha‐Fregoso Y, Malkiel S, Harris KM, et al. Phase II randomized trial of rituximab Plus cyclophosphamide followed by belimumab for the treatment of lupus nephritis. Arthritis Rheumatol. 2021;73(1):121–131. doi: 10.1002/art.41466
- Mendoza-Pinto C, Etchegaray-Morales I, Ugarte-Gil MF. Improving access to SLE therapies in low and middle-income countries. Rheumatology . 2023;62(Suppl 1):i30–i35. doi: 10.1093/rheumatology/keac530
- Mackensen A, Müller F, Mougiakakos D, et al. Anti-CD19 CAR T cell therapy for refractory systemic lupus erythematosus. Nat Med. 2022;28(10):2124–2132. doi: 10.1038/s41591-022-02017-5
- Obreque J, Vega F, Torres A, et al. Autologous tolerogenic dendritic cells derived from monocytes of systemic lupus erythematosus patients and healthy donors show a stable and immunosuppressive phenotype. Immunology. 2017;152(4):648–659. doi: 10.1111/imm.12806
- Funes SC, Ríos M, Gómez‐Santander F, et al. Tolerogenic dendritic cell transfer ameliorates systemic lupus erythematosus in mice. Immunology. 2019;158(4):322–339. doi: 10.1111/imm.13119
- Llanos C, Mackern-Oberti JP, Vega F, et al. Tolerogenic dendritic cells as a therapy for treating lupus. Clin Immunol. 2013;148(2):237–245. doi: 10.1016/j.clim.2013.04.017
- Covián C, Fernández-Fierro A, Retamal-Díaz A, et al. BCG-induced cross-protection and development of trained immunity: implication for vaccine design. Front Immunol. 2019;10:2806. doi: 10.3389/fimmu.2019.02806
- Funes SC, Rios M, Fernández-Fierro A, et al. Trained immunity contribution to autoimmune and inflammatory disorders. Front Immunol. 2022;13:868343. doi: 10.3389/fimmu.2022.868343
- Soto JA, Gálvez NMS, Andrade CA, et al. BCG vaccination induces cross-protective immunity against pathogenic microorganisms. Trends Immunol. 2022;43(4):322–335. doi: 10.1016/j.it.2021.12.006
- Covián C, Ríos M, Berríos-Rojas RV, et al. Induction of trained immunity by recombinant vaccines. Front Immunol. 2020;11:611946. doi: 10.3389/fimmu.2020.611946
- Hsu T, Hingley-Wilson SM, Chen B, et al. The primary mechanism of attenuation of bacillus Calmette–Guérin is a loss of secreted lytic function required for invasion of lung interstitial tissue. Proc Natl Acad Sci U S A. 2003;100(21):12420–12425. doi: 10.1073/pnas.1635213100
- Kalyn Eadie. The effect of Mycobacterium bovis-BCG infection on longevity and autoimmune disease in MRL/lpr mic. ; 2004 [Montreal]McGiII University;.
- Shpilsky GF, Takahashi H, Aristarkhova A, et al. Bacillus Calmette-Guerin ‘s beneficial impact on glucose metabolism: evidence for broad based applications. iScience. 2021;24(10):103150. doi: 10.1016/j.isci.2021.103150
- Mao C, Xu X, Ding Y, et al. Optimization of BCG therapy targeting neutrophil extracellular traps, autophagy, and mirnas in bladder cancer: implications for personalized medicine. Front Med . 2021;8:735590. doi: 10.3389/fmed.2021.735590
- Ristori G, Romano S, Cannoni S, et al. Effects of bacille Calmette-Guérin after the first demyelinating event in the CNS. Neurology. 2014;82(1):41–48. doi: 10.1212/01.wnl.0000438216.93319.ab
- Matsuzaki G, Teruya N, Kiyohara Kohama H, et al. Mycobacterium bovis BCG-mediated suppression of Th17 response in mouse experimental autoimmune encephalomyelitis. Immunopharmacol Immunotoxicol. 2021;43(2):203–211. doi: 10.1080/08923973.2021.1878215
- Kühtreiber WM, Tran L, Kim T, et al. Long-term reduction in hyperglycemia in advanced type 1 diabetes: the value of induced aerobic glycolysis with BCG vaccinations. Npj Vaccines. 2018;3(1):23. doi: 10.1038/s41541-018-0062-8
- Faustman DL. TNF, TNF inducers, and TNFR2 agonists: a new path to type 1 diabetes treatment. Diabetes Metab Res Rev. 2018;34(1):1–6. doi: 10.1002/dmrr.2941
- Baxter AG, Horsfall AC, Healey D, et al. Mycobacteria precipitate an SLE-like syndrome in diabetes-prone NOD mice. Immunology. 1994;83(2):227–231.
- Silveira PA, Baxter AG. The NOD mouse as a model of SLE. Autoimmunity. 2001;34(1):53–64. doi: 10.3109/08916930108994126
- Eadie K. The effect of Mycobacterium bovis-BCG infection on longevity and autoimmune disease in MRL/lpr mice. ; 2004 [Montreal]: mcGiII University;.
- Biao YUC, Jiang R, Niu Y y, et al. Therapeutic action research of bacille calmette guerin (BCG) on a systemic lupus erythematosus mouse model. J Immunol Tech Infect Dis. 2016;05(04):4–7. doi: 10.4172/2329-9541.1000150
- Richard ML, Gilkeson G. Mouse models of lupus: what they tell us and what they don’t. Lupus Sci Med. 2018;5(1):e000199. doi: 10.1136/lupus-2016-000199
- Engleman EG, Sonnenfeld G, Dauphinee M, et al. Treatment of NZB/NZW F 1 hybrid mice with Mycobacterium Bovis strain BCG or Type II interferon preparations accelerates autoimmune disease. Arthritis Rheum. 1981;24(11):1396–1402. doi: 10.1002/art.1780241110
- Hart DA, Krause G, Martin L, et al. Influence of biological response modifiers of bacterial origin on disease progression in the MRL-lpr model of systemic lupus erythematosus. Clin Invest Med. 1991;14(1):55–62.
- Li J, Lu J, Wang G, et al. Past, present and future of bacillus calmette-Guérin vaccine use in China. Vaccines . 2022;10(7):1157. doi: 10.3390/vaccines10071157
- Asadian M, Hassanzadeh SM, Safarchi A, et al. Genomic characteristics of two most widely used BCG vaccine strains: Danish 1331 and Pasteur 1173P2. BMC Genomics. 2022;23(1):609. doi: 10.1186/s12864-022-08826-9
- Kalergis AM, Iruretagoyena MI, Barrientos MJ, et al. Modulation of nuclear factor‐κB activity can influence the susceptibility to systemic lupus erythematosus. Immunology. 2009;128(1 Suppl):e306–e314. doi: 10.1111/j.1365-2567.2008.02964.x
- Soto JA, Melo-González F, Riedel CA, et al. Modulation of immune cells as a therapy for cutaneous lupus erythematosus. Int J Mol Sci. 2022;23(18):10706. doi: 10.3390/ijms231810706
- Sawada T, Fujimori D, Yamamoto Y. Systemic lupus erythematosus and immunodeficiency. Immunol Med. 2019;42(1):1–9. doi: 10.1080/25785826.2019.1628466
- Pieterse E, Van der Vlag J. Breaking immunological tolerance in systemic lupus erythematosus. Front Immunol. 2014;5:164. doi: 10.3389/fimmu.2014.00164
- Sterner RM, Hartono SP, Grande JP. The pathogenesis of lupus nephritis. J Clin Cell Immunol. 2014;5(2):1–8. doi: 10.4172/2155-9899.1000205
- Corapi KM, Dooley MA, Pendergraft WF. Comparison and evaluation of lupus nephritis response criteria in lupus activity indices and clinical trials. Arthritis Res Ther. 2015;17(1):110. doi: 10.1186/s13075-015-0621-6
- Ruiz-Irastorza G, Bertsias G. Treating systemic lupus erythematosus in the 21st century: new drugs and new perspectives on old drugs. Rheumatology . 2020;59(Suppl5):v69–v81. doi: 10.1093/rheumatology/keaa403
- Soto JA, Díaz FE, Retamal-Díaz A, et al. BCG-based vaccines elicit antigen-specific adaptive and trained immunity against SARS-CoV-2 and andes orthohantavirus. Vaccines. 2022;10(5):721. doi: 10.3390/vaccines10050721
- Canedo-Marroquín G, Soto JA, Andrade CA, et al. Increased heme oxygenase 1 expression upon a primary exposure to the respiratory syncytial virus and a secondary mycobacterium bovis infection. Antioxidants. 2022;11(8):1453. doi: 10.3390/antiox11081453
- Pacheco GA, Andrade CA, Gálvez NMS, et al. Characterization of the humoral and cellular immunity induced by a recombinant BCG vaccine for the respiratory syncytial virus in healthy adults. Front Immunol. 2023;14:1215893. doi: 10.3389/fimmu.2023.1215893
- Allen HF, Klingensmith GJ, Jensen P, et al. Effect of bacillus Calmette-Guerin vaccination on new-onset type 1 diabetes. A randomized clinical study. Diabetes Care. 1999;22(10):1703–1707. doi: 10.2337/diacare.22.10.1703
- Castro AP, Esaguy N, Aguas AP. Effect of mycobacterial infection in the lupus-prone MRL/lpr Mice: enhancement of life span of autoimmune mice, amelioration of kidney disease and transient decrease in host resistance. Autoimmunity. 1993;16(3):159–166. doi: 10.3109/08916939308993323
- Malvar A, Pirruccio P, Alberton V, et al. Histologic versus clinical remission in proliferative lupus nephritis. Nephrol Dial Transplant. 2017;32(8):1338–1344. doi: 10.1093/ndt/gfv296
- Zickert A, Sundelin B, Svenungsson E, et al. Role of early repeated renal biopsies in lupus nephritis. Lupus Sci Med. 2014;1(1):e000018. doi: 10.1136/lupus-2014-000018
- Aranow C, Zhou D, Diamond B. Anti-DNA antibodies: structure, regulation and pathogenicity. Editor: Robert G. Lahita, Systemic Lupus Erythematosus. Elsevier; 2011.235–258. doi: 10.1016/B978-0-12-374994-9.10014-2.
- Wener MH. Immune complexes in systemic lupus erythematosus. Editor: George C. Tsokos, Systemic Lupus Erythematosus. Elsevier. 2016;:223–229. doi: 10.1016/B978-0-12-801917-7.00026-7.
- Liu X, Qi Y, Zhao Y, et al. Plasma soluble tumor necrosis factor receptor I as a biomarker of lupus nephritis and disease activity in systemic lupus erythematosus patients. Ren Fail. 2023;1:45.
- Pavan Kumar N, Padmapriyadarsini C, Rajamanickam A, et al. Effect of BCG vaccination on proinflammatory responses in elderly individuals. Sci Adv. 2021;7(32):1–9. doi: 10.1126/sciadv.abg7181
- Vitales-Noyola M, Oceguera-Maldonado B, Niño-Moreno P, et al. Patients with systemic lupus erythematosus show increased levels and defective function of CD69 + T regulatory cells. Mediators Inflamm. 2017;2017:2513829–2513829. doi: 10.1155/2017/2513829
- Peixoto TV, Carrasco S, Botte DAC, et al. CD4 + CD69+ T cells and CD4 + CD25 + FoxP3+ Treg cells imbalance in peripheral blood, spleen and peritoneal lavage from pristane-induced systemic lupus erythematosus (SLE) mice. Adv Rheumatol. 2019;59(1):30. doi: 10.1186/s42358-019-0072-x
- Crispin JC, Martínez A, de Pablo P, et al. Participation of the CD69 antigen in the T‐cell activation process of Patients with systemic lupus erythematosus. Scand J Immunol. 1998;48(2):196–200. doi: 10.1046/j.1365-3083.1998.00366.x
- Pérez-Lara JC, Espinosa E, Santos-Argumedo L, et al. CD38 Correlates with an immunosuppressive Treg phenotype in lupus-prone mice. Int J Mol Sci. 2021;22(21):11977. doi: 10.3390/ijms222111977
- Ishikawa S, Akakura S, Abe M, et al. A subset of CD4+ t cells expressing early activation antigen CD69 in murine lupus: possible abnormal regulatory role for cytokine imbalance. J Immunol. 1998;161(3):1267–1273. doi: 10.4049/jimmunol.161.3.1267
- Gupta N, Garg S, Vedi S, et al. Future path toward TB vaccine development: boosting BCG or re-educating by a new subunit vaccine. Front Immunol. 2018;9:2371. doi: 10.3389/fimmu.2018.02371