
Abstract
Developing a comprehensive portfolio of theoretically sound indicators is fundamental to effective place-based management of coastal ecosystems at a wide range of scales. We reviewed indicator development case studies from seven different social-ecological systems over the first 10 years of the NOAA integrated ecosystem assessment (IEA) program, with the goals of identifying effective strategies and highlighting general principles that would inform future efforts. The IEA framework provided a versatile approach to developing indicators across a diverse range of differently scaled systems and partnerships, guided by organizing principles of screening transparency, iterative review, and an adaptive balance between quantitative evaluation methods and qualitative stakeholder guidance. Information exchange across the broad community of EBM practitioners facilitated progress between systems, chronologically tracking a path that reflected improvements in indicator development methods (especially for social indicators) and a growing focus on multisector EBM in smaller coastal communities. Most projects adopted innovative visual imagery to engage partners and stakeholders, which built trust and communication while enhancing the spectrum of indicators. Using guidance from the lessons above, future indicator development efforts will be better prepared to confront the recurring, transdisciplinary challenges of managing integrated social-ecological systems.
Introduction
Meeting societal objectives and confronting management challenges in coastal ecosystems requires a balanced understanding of the system as well as the management questions. Developing indicators of biophysical, economic, and sociocultural components and processes can be a tool for progressing toward this understanding, particularly when scientists and information-users collaboratively develop portfolios of indicators that relate to a range of management needs (Rice and Rochet Citation2005). Ecosystem indicators are quantitative measurements that serve as proxies for the condition of broad ecosystem attributes that are valued by society, such as habitat quality, biodiversity, or community composition (Landres, Verner, and Thomas Citation1988, Noss Citation1990). Indicators thus provide a practical means of tracking ecosystem change in relation to management objectives, and properly designed indicator monitoring programs can track such changes across a range of spatial and temporal scales (Jennings and Dulvy Citation2005). Considerable literature has been devoted to techniques for selecting, analyzing and applying representative portfolios of indicators (e.g., Breslow et al. Citation2017, Fulton, Smith, and Punt Citation2005, Kershner et al. Citation2011).
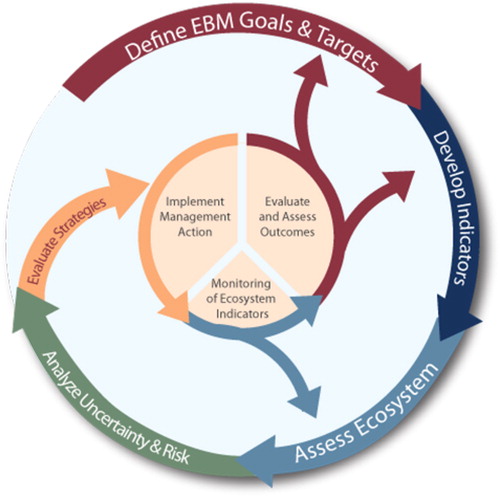
Scientists and resource managers facing environmental challenges in coastal ecosystems see potential benefits to an ecosystem-based management (EBM) approach because it explicitly considers the interconnectedness of social-ecological systems (Arkema, Abramson, and Dewsbury Citation2006, Link and Browman Citation2014). As a steward of U.S. coastal and marine ecosystems, including coastal communities and their economies, the National Oceanic and Atmospheric Administration (NOAA) manages marine resources at a variety of spatial and temporal scales and has increasingly embraced the benefits of an EBM approach (Levin et al. Citation2009, NOAA Citation2016). Integrated ecosystem assessments (IEA) have been identified as one potential guiding framework for implementing EBM to meet NOAA mandates (Levin et al. Citation2009, Samhouri et al. Citation2014, Harvey, Kelble, and Schwing Citation2017). The IEA framework () is a collaborative management process that, ideally, begins with scoping out EBM goals with managers and stakeholders. These goals can then be linked to key indicators capable of identifying the status and trends of important attributes of the social-ecological system. Using these indicators, target levels and threshold responses can be quantified and used to identify and understand risk, uncertainty, and potential outcomes and tradeoffs of various management strategies (Levin et al. Citation2009). This process loops iteratively and adaptively, and relies on monitoring of relevant indicators to determine if goals have been achieved and/or whether new management strategies are necessary.
Figure 1. Conceptual schematic describing the cyclical, iterative nature of IEAs at NOAA. Indicator development. Adapted from Samhouri et al. (Citation2014).
Clearly, developing a comprehensive portfolio of theoretically sound, management-ready indicators is fundamental to effective EBM of coastal systems. However, EBM approaches need to address place-based management problems at a wide range of scales, from local coastal communities to large marine ecosystems (LMEs). As such, there is likely no one single indicator development process that suits the goals, scale, and information available for all systems. Rather, the process is best undertaken in the context of the specific biophysical and socioeconomic conditions, governance structure, and resources available to researchers in a given social-ecological system. Even so, some general principles exist that can inform indicator development processes, regardless of scale, such as developing indicator portfolios that are small but serve a broad range of users (Rice and Rochet Citation2005); identifying indicators that effectively track ecosystem state across different types of ecosystem perturbation (Fulton, Smith, and Punt Citation2005); and explicitly linking indicators to ecosystem goals (Kershner et al. Citation2011).
In this paper, we add to the literature on effective practices for ecosystem indicator portfolio development by describing a series of indicator development strategies from the first ten years of the NOAA IEA program. The program has used a variety of robust and transferable approaches to produce tractable portfolios of ecosystem indicators at a variety of scales. Here we consider case studies from seven social-ecological systems where the IEA approach is being applied for place-based management, ranging from large marine ecosystems to coastal fishing communities (). We compare how the scale of management, level of stakeholder engagement, and methods of indicator selection vary across these systems, document specific successes, challenges, and lessons learned, and finally draw out meaningful lessons and advice for other practitioners.
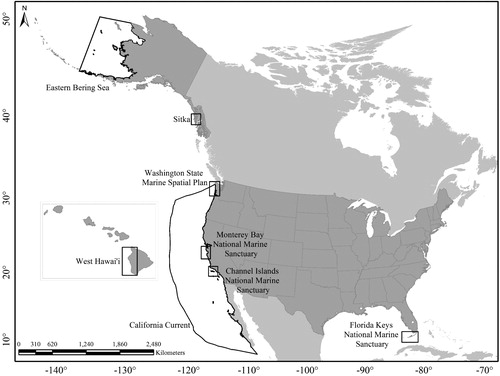
Figure 2. Map showing the location and approximate spatial extent of social-ecological systems included in review of indicator development case studies.
Methods
We analyze seven case studies that used IEA-based indicator screening and evaluation frameworks to derive their indicator portfolios. In particular, we describe how each of these efforts was influenced by the scale of the natural (biophysical) and human (social) communities associated with these systems ().
For each case study, we first document the scope of the EBM effort, including the geographic scale of the marine domain, primary management partners involved, and connections of human communities to the ocean (). We also note the maturity of the EBM effort based on its start date (year), deadline or timelines, and any associated products. Second, we provide an overview of each case study’s process for developing indicators by identifying key attributes of the system, the balance (or imbalance) between biophysical and human well-being attributes, as well as logistical details of the indicator evaluation and screening process, such as stakeholder review, portfolio size, and resources allocated (). Where applicable, we also documented influential methods, literature sources or other indicator selection processes, and successful strategies and lessons learned.
Table 1. Scope of ecosystem-based management effort for each IEA case study.
Table 2. Details of the indicator evaluation process associated with each IEA case study.
Case studies
California current
The California Current Ecosystem (CCE) is a large, dynamic, spatially heterogeneous system in the northeastern Pacific Ocean (; ). The California Current Integrated Ecosystem Assessment (CCIEA) was originally conceived as a broad framework for synthesizing scientific knowledge to inform management decisions and link ecosystem condition to human well-being throughout this region. Initially, the CCIEA framework focused on a subset of EBM attributes that represented wild fisheries, protected resources, and overall ecosystem health. Developing indicators capable of defining the current status and trends of these attributes was a major effort of 12-15 scientists over a 6-9 month period (Levin and Schwing Citation2011). Subsequent assessments (Harvey et al. Citation2014) expanded to cover a broader suite of CCE components and pressures, developing appropriately-scaled indicators to evaluate status and trends, conduct risk analyses, and test management scenarios. Additional expertise was recruited across NOAA and contract staff to develop conceptual models and the relevant indicators necessary to quantify the status and trends of these new components, swelling the ranks of engagement to more than 50 researchers. Over the last ten years, the CCIEA team has worked to align these indicators and related science tools with the management priorities of several partners, particularly the NOAA Fisheries West Coast Region, the NOAA Office of National Marine Sanctuaries, and the Pacific Fishery Management Council (PFMC) ().
In the initial CCIEA report (Levin and Schwing Citation2011), biophysical indicators were selected using a quantitative hierarchical framework involving a transparent, literature-based evaluation of each indicator with 18 weighted criteria (e.g., theoretical soundness, relevance to ecosystem attribute of interest, adequate spatial and temporal coverage of data; ) (Kershner et al. Citation2011). This process established a relatively large baseline portfolio of indicators, which expanded as the list of components grew in subsequent reports (Harvey et al. Citation2019; ). Most indicators of human well-being have focused on measuring levels of fishing reliance and socioeconomic vulnerability in coastal communities. However, despite work to conceptualize and develop systematic evaluation methods (Breslow et al. Citation2017), operationalizing properly scaled indicators of human well-being remains a challenge due to limited resources for collecting and analyzing data.
Since 2013, the CCIEA’s portfolio of indicators has been informed by providing annual ecosystem status reports to the PFMC, as requested in the PFMC’s Fishery Ecosystem Plan (PFMC Citation2013). The reports provide ecosystem context for decision-making processes under various PFMC mandates, with ongoing collaborations to better align report indicators with PFMC needs and objectives. Recent reports (e.g., Harvey et al. Citation2019) feature 30-40 indicators of biophysical and socioeconomic attributes of the current ecosystem state, and also characterize recent events such as marine heatwaves (Bond et al. Citation2015) and whale entanglements in fishing gear (Santora et al. Citation2020). The reports are complemented by a web-based data portalFootnote1 designed to disseminate information to an even broader audience. The CCIEA team is working to streamline the considerable effort required for indicator reporting so that sufficient resources are available for other aspects of the IEA framework ().
Eastern Bering Sea
The Eastern Bering Sea (EBS) is a large subarctic ecosystem located in the northern Pacific Ocean (; ). It is one of the most productive fishery ecosystems worldwide, including the walleye pollock (Gadus chalcogrammus) fishery, which is the second largest single-species fishery in the world by volume. The region also supports an abundance of seabirds and marine mammals, many of which seasonally migrate to the region to breed or feed. The subsistence harvest of marine mammals, seabirds, fish, and invertebrates provides a significant food source in coastal communities and is an important part of Alaska Native cultural identity (Renner and Huntington Citation2014).
NOAA’s Alaska Fisheries Science Center (AFSC) has produced ecosystem status reports (ESRs) for Alaska’s large marine ecosystems annually since 1995, well before the beginning of the NOAA IEA program in 2010. In accordance with NOAA Ecosystem Based Fisheries Management (EBFM) Policy (NOAA Citation2016) and the legal mandates cited therein, the primary purpose of the ESR is to provide the North Pacific Fishery Management Council (NPFMC) with contextual ecosystem information to inform their annual quota-setting process. Indicators included in the ESR prior to 2010 were selected using the drivers, pressures, status, indicators, response (DPSIR) approach (Livingston et al. Citation2005; ). The full ESR, which typically features more than 100 indicators, is included in the annual Stock Assessment and Fishery Evaluation (SAFE) report and is publicly presented along with traditional single-species stock assessments at regular NPFMC meetings (Siddon and Zador Citation2019).
In 2010, a team of AFSC experts selected a subset of 10 indicators from the full ESR to be included in a “Report Card” that provided a concise depiction of the status and trends of the most relevant indicators intended to capture current ecosystem status and trends (Zador, Gaichas, et al. Citation2017). Beginning in 2018, the AFSC produced a high-level summary (ESR Brief), in addition to the Report Card and detailed ESR. The primary audience for the ESR Brief is the NPFMC, the fisheries industry, Alaska Native communities, and other stakeholders. The Brief provides a concise, accessible synthesis of important themes and emergent issues in the current year’s full ESR, in a flexible format that allows indicators to change annually to communicate information most relevant to the current year.
In contrast to the pre-selected indicator portfolio in the report card, the Brief provides a synopsis of the major ecosystem storylines in the current year, as informed by a relevant subset of the full indicator portfolio from the ESR, along with customized graphics and short blocks of text (, Siddon and Zador Citation2019). In addition, the Brief documents how ecosystem information in the ESR was used in fisheries management decisions. This is possible because while the ESR is produced in tandem with stock assessments every August through November, the Briefs are completed during the December NPFMC meeting when fisheries quotas are set for the following year.
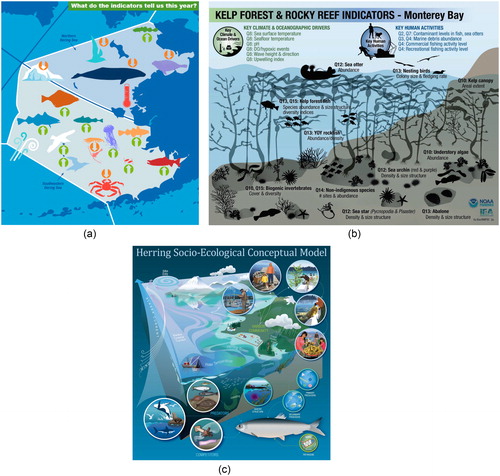
Figure 3. Examples of visual imagery used for communicating ecosystem indicator concepts to stakeholders. a.) Ecosystem Status Report Brief from the 2019 East Bering Sea (Siddon and Zador Citation2019; https://access.afsc.noaa.gov/REFM/REEM/ecoweb/pdf/EBS-2019_ESR-Brief.pdf), which uses arrows and visual icons to show the status and trends of various ecosystem components; b.) Conceptual model depicting the indicator portfolio of ecosystem components, climate and ocean drivers, and human pressures for kelp forest and rocky reef habitats in Monterey Bay National Marine Sanctuary (Brown et al. Citation2019); c.) Conceptual model illustrating the main biological and environmental factors driving the abundance of Pacific herring in Sitka, Alaska, and representing how interactions between Sitka residents and herring fisheries affect community well-being (Rosellon-Druker et al. Citation2019). Source: Graphic produced by R. White, Alaska Fisheries Science Center, NOAA Fisheries.
Washington State marine spatial plan
In 2010, Washington State enacted the “Marine Waters Planning and Management Act” (RCW 43.372), which called for a marine spatial plan to provide a framework for managing Washington State’s marine waters. This legislation sought to improve marine resource management by planning for new ocean uses, reducing user conflicts and ensuring “a resilient and healthy marine ecosystem that supports sustainable economic, recreational, and cultural opportunities for coastal communities, visitors, and future generations.” The resulting marine spatial plan (MSP; WADOE Citation2018) was written by the Washington State Ocean Caucus (WASOC), which also led stakeholder engagement and science support efforts related to the plan (see https://www.msp.wa.gov).
The Washington MSP Study Area consists of state and federal marine waters extending offshore from the shoreline to 1280 m depth (; ). A majority of these waters (67%) overlaps with the Usual and Accustomed Areas of five federally recognized tribes, and 32% overlaps with the Olympic Coast National Marine Sanctuary, making these communities and agencies integral management partners. Washington’s coastal communities are generally rural, with state and national parks, forests and wildlife refuges covering much of the land. The ocean economy (e.g., fishing, aquaculture, tourism, and shipping) represents a significant portion of the total economy for coastal communities (WADOE Citation2018). The region supports productive commercial, recreational, and subsistence fisheries for many fish and shellfish species.
The MSP legislation required the development of indicators for assessing the health and status of the ocean ecosystem, and for identifying threats to management goals, analyzing risk, and weighing tradeoffs among stakeholders. The WASOC and CCIEA scientists began the indicator development process by leading workshops with local managers, scientists and stakeholders to iteratively develop conceptual models of six major habitat types found within the MSP boundaries (). The conceptual models provided the guiding framework for identifying potential indicators of key physical drivers, habitat characteristics, ecological components and human activities in each habitat type (Andrews, Harvey, and Levin Citation2013). CCIEA scientists then evaluated, ranked and selected the best indicators for each component using the screening criteria of Kershner et al. (Citation2011). Data for highly-ranked indicators were gathered to quantify the status and trends for biophysical and human activity components (Andrews, Coyle, and Harvey Citation2015). Other methods were used to evaluate and select indicators for key social (Poe et al. Citation2015) and economic components (Decker Citation2015).
The majority of this work took 1.5 years with less than two full-time employees (). This was possible because indicator evaluation and selection processes had been established in the CCIEA case study (Levin and Schwing Citation2011). The conceptual models and indicator analyses formed the cornerstone of the ecological conditions section of the MSP (WADOE Citation2018). Data gaps were identified and a transparent, quantitative, updateable evaluation and ranking procedure for indicators was established. The final product concluded with >100 indicators across the six habitats. The WASOC is developing a process to narrow this list by establishing specific goals for each habitat so these indicators can be used for timely management decisions when the MSP is used to review future marine activity permits.
Monterey Bay National Marine Sanctuary
Monterey Bay National Marine Sanctuary (MBNMS), designated in 1992, incorporates ∼450 km of California’s central coast (; ). MBNMS includes a wide range of habitats, including the Elkhorn Slough estuary, kelp forests, deep underwater canyons, and the Davidson Seamount. These habitats support a rich diversity of flora and fauna, and attract a wide range of research activity (Brown et al. Citation2019, Guerrero and Kvitek Citation1996). There are several urban centers and over 3 million people living within 80 km of the shoreline. MBNMS draws large numbers of recreational visitors, and coastal tourism, agriculture, and commercial and recreational fisheries are all large contributors to the regional economy with direct links to MBNMS (NOAA Citation2008).
The scope of this case study was driven by the NOAA Office of National Marine Sanctuaries (ONMS), whose mission is to ensure the health and protection of essential marine resources while facilitating compatible human uses and education. ONMS condition reportsFootnote2 provide a summary of the current condition and recent trends of resources in a sanctuary, pressures on those resources, and management responses to the pressures that threaten the integrity of the marine environment (ONMS Citation2018). Condition reports are structured around a set of 16 questions that help document the status and trends of water quality, habitat, living resources, and maritime heritage resources in a given sanctuary, as well as human pressures and ecosystem services (). While earlier condition reports had largely relied on expert elicitation to answer these questions (Brown et al. Citation2019), the goal of this case study was to use a transparent and repeatable process for identifying quantitative indicators and incorporate these into future MBNMS condition reports. Using the WA MSP process (Andrews, Coyle, and Harvey Citation2015) as guidance, CCIEA and ONMS scientists identified numerous potential indicators across eight major habitat categories (e.g., kelp forest and rocky reefs, estuaries, deep seafloor). A core team of two report authors then screened and ranked these indicators based on six evaluation criteria adapted from Kershner et al. (Citation2011), and drafted habitat-specific indicator portfolios and conceptual models that were then reviewed and vetted by the MBNMS’s research activities panel and additional experts from the regional science and management community (Brown et al. Citation2019).
The indicator vetting process was a lengthy (>24 months) but rigorous and transparent method that reduced the potential for expert bias and clarified how particular habitats contribute to sanctuary assessments (). It also codified a streamlined, adaptable approach that can be led by a handful of personnel using fewer resources and incorporating conceptual diagrams that translate abstract concepts to a highly accessible visual format (Brown et al. Citation2019). This approach guided the 2015 MBNMS Condition Report update (ONMS Citation2015), was applied to other sanctuaries (ONMS Citation2019a), and will inform Sanctuary management plans by highlighting future research and monitoring needs. Social scientists from ONMS are now evaluating how human well-being indicators can be applied to this systematic evaluation framework in Olympic Coast National Marine Sanctuary using an ecosystem services approach (Brown et al. Citation2019).
Florida Keys National Marine Sanctuary
The Florida Keys National Marine Sanctuary (FKNMS), designated in 1990, surrounds the entirety of the Florida Keys archipelago of 1700 limestone islands (), and extends over 350 km, starting at the tip of the Florida peninsula and ending at the islands of Dry Tortugas National Park (). FKNMS attracts large numbers of tourists, who SCUBA dive and snorkel, boat, fish, bird-watch, and visit beaches and historic sites. Coastal tourism and commercial and recreational fisheries both are large drivers of the regional economy with direct links to the Sanctuary. Human well-being in the Keys is linked to mangrove, seagrass, hard-bottom, and coral reef habitats of FKNMS, and this connection is dependent on socioeconomic, ecological, and biophysical environmental conditions.
As with the MBNMS case study, the project goal was to select and assess indicators related to the status and trends of sanctuary ecosystem resources, according to needs identified by the FKNMS. A comprehensive indicator portfolio was designed to be useful for future FKNMS condition reports, guide proposed changes in future FKNMS management plans, and identify thresholds (e.g., Samhouri, Levin, and Ainsworth Citation2010) in relationships between key components and various ecosystem stressors.
IEA scientists from the Gulf of Mexico region and ONMS researchers, led by one staff member, worked together to design and implement a quantitative indicator selection process to the scale of FKNMS. The team developed and piloted a decision-making tool that incorporated expert opinion and a quantitative scoring process that resulted in a list of best-fit indicators of ecological condition in the FKNMS (). This quantitative and qualitative approach was planned in response to comments from stakeholders in other sanctuaries requesting a more transparent, quantitative, expert-reviewed process for selection of indicators in sanctuary condition reports. The process began with meetings between IEA scientists and FKNMS managers in May 2018, involving an expert workshop centered on qualitative indicator vetting, followed by quantitative individual scoring of proposed indicators across evaluation criteria, per Condition Report sections and questions (Montenero, Kelble, and Brogden in review). Experts provided recommendations and rationale for regional time series monitoring data, and reviewed the list of high-scoring indicators. Key indicators and their status and trends can be explored by managers and stakeholders via an interactive web tool (https://marinebon.org/fk-iea/). The process is ongoing, with future action items planned for specific dates correlated to management and assessment timelines of the FKNMS.
The selected indicators, relevant datasets, and status and trends were used in the draft environmental impact statement of the FKNMS management review for socioeconomic and biophysical consequences of changes to the management plan (ONMS Citation2019b). State, federal, and academic partners have also chosen to use this list of indicators in their forthcoming socioeconomic analysis of the FKNMS. We anticipate these indicators and the associated status and trends analysis will contribute substantially to the next FKNMS Condition Report.
West Hawai’i
West Hawai’i () is home to a highly productive and diverse marine ecosystem, supporting an abundance of tropical corals, reef fishes, sea turtles, and cetaceans (Gove et al. Citation2016). The marine resources in the region provide a multitude of ecosystem services valuable to people both locally and globally, such as food provisioning, protection from wave and storm impacts, nutrient cycling, and support for cultural practices and values. West Hawai’i also encompasses a complex social and cultural context, with communities featuring indigenous Native Hawaiians, families rooted in the plantation and labor histories from the late 19th century, Pacific Islanders from elsewhere in the region, relatively recently established families primarily from continental North America and Asia, and large numbers of transient tourists. The complexity of the social and ecological context, and the small spatial scale in West Hawai’i affords a unique opportunity to examine how to better integrate social-ecological information and support ecosystem-based management (EBM) in the region.
The goal of the ecosystem indicator development process in West Hawai’i was to track the status of the region’s social-ecological system and help assess the efficacy of management’s decision-making. West Hawai’i IEA (WHIEA) scientists employed a participatory process to gather expert and place-based knowledge from resource managers, scientists, and local community members (Ingram, Oleson, and Gove Citation2018). This process elicited local values, fostered diverse relationships, and increased community engagement in resource management. Using this collected knowledge and guided by the DPSIR framework (Breslow et al. Citation2016), conceptual ecosystem models were developed that identified and quantified the strength of socio-economic and ecological interactions (). The resulting conceptual models illustrated the complexity of system dynamics, highlighting connectivity between pressures and the ecosystem, with direct implications for ecosystem services. Importantly, the conceptual models identified numerous pressures that occur at the local scale, highlighting an opportunity for resource management to influence ecosystem status in West Hawai’i. In addition, many of the strongly impacted ecosystem services were the less tangible cultural ecosystem services, which are critical to human well-being but lack clear metrics and integration into resource management.
Combining current scientific understanding, the conceptual models (Ingram, Oleson, and Gove Citation2018), and input and feedback from local resource managers, a series of ecosystem indicators were developed for the West Hawai’i region (Gove et al. Citation2016). Indicators were selected qualitatively using expert opinion and community input across a wide range of social-ecological components, from climatic and oceanographic drivers, to the states of biological and human communities and associated activities. Local communities were highly engaged to help identify the core attributes of human well-being and the relationships between people and resources (Leong et al. Citation2019) that needed to be included in the West Hawai’i ESR (Gove et al. Citation2019). Indicators reflecting ecosystem function and services have also been used for performance evaluation of alternative management scenarios for coral reef ecosystems (Weijerman et al. Citation2018). Indicator development and identification of data gaps is an ongoing and iterative process for determining whether indicators are continued, removed, or added to ESRs produced by the WHIEA team.
Sitka Sound, Southeast Alaska
Sitka is located on Baranof Island, centrally located along the eastern Gulf of Alaska (). The community has thriving commercial, subsistence, and recreational fisheries, with the largest active commercial fishing fleet in the region, multiple charter fishing lodges, and deeply-rooted subsistence fishing traditions that provide for food security and the maintenance of cultural values (Himes-Cornell and Kasperski Citation2016, Wolfe Citation2004).
The goals of the Sitka IEA were to develop conceptual models and indicators of the social-ecological system capable of examining how it would respond to perturbations. This began with the development of four conceptual models centered on Pacific halibut (Hippoglossus stenolepis), Pacific herring (Clupea pallasii), Chinook salmon (Oncorhynchus tshawytscha), and sablefish (Anoplopoma fimbria) through a series of participatory focus groups with community members having knowledge and experience in local fisheries (). Focus group participants identified biophysical factors driving ecosystem productivity and the human well-being derived from commercial and subsistence fisheries. These key community-derived ecosystem components were combined with important oceanographic drivers and food web relationships identified in an extensive scientific literature review.
Final conceptual models were created from key environmental and biotic components (i.e., prey or predators) which affected the abundance of the focal species (Rosellon-Druker et al. Citation2019). The resulting co-produced conceptual models served as the foundation for selecting ecosystem and human well-being indicators for the system.
Potential indicators for biophysical components of the conceptual models were identified through scientific literature review from studies in the Gulf of Alaska and local ecological knowledge (LEK) gained from the focus group participants (). Locally relevant human well-being indicators were developed through an iterative process combining information from scientific literature review, participatory focus groups, and semi-structured interviews (Szymkowiak and Kasperski Citation2020). An initial list of human well-being indicators derived from the CCIEA team (Breslow et al. Citation2016) was filtered using a suite of evaluation criteria that have been applied in other contexts to rank human dimensions indicators (Loomis and Paterson Citation2014). These indicators were presented to stakeholders for discussion and ranking during a focus group. Indicators were weighted based on 1) the number of components each indicator was associated with, and 2) the overall indicator ranking. Finally, time-series data for the highest scoring indicators were presented to stakeholders and a prioritized list of final indicators was selected based on their relevance to fishery participation in Sitka (Szymkowiak and Kasperski Citation2020).
Discussion
The proliferation of indicator development efforts across a range of differently scaled systems or ‘places’ and partnerships highlights the versatility of its approach to implementing EBM, and is a testament to the original planners’ aims (Levin et al. Citation2009). Indeed, all of the case studies incorporate organizing principles that guide this indicator development framework, including a transparent screening and evaluation process (Samhouri et al. Citation2014), iterative review, and creative approaches to communicate concepts to partners and stakeholders. The diversity of these approaches is also an adaptation to the recurring challenge of integrating natural and human systems that operate at different scales, often with varying management goals and levels of information availability.
Most of the case studies balance the use of quantitative indicator evaluation methods with qualitative expert or stakeholder guidance to derive indicator portfolios. However, the chronology of NOAA indicator development case studies generally reveals a progression from an emphasis on larger marine systems driven by specific fisheries management goals, toward smaller coastal communities focused on goals of human well-being. In general, the most mature indicator portfolios were first developed for LMEs using quantitative scientific frameworks (e.g., DPSIR, Kershner et al. Citation2011) to articulate strong biophysical indicators that support fisheries management objectives. These indicator portfolios have necessarily evolved over time () to also incorporate qualitative assessments, especially as new management challenges or events (e.g., whale entanglements, marine heat waves) spurred the need for rapid inclusion of novel indicators (Zador, Holsman, et al. Citation2017, Santora et al. Citation2020, Harvey et al. Citation2019, Siddon and Zador Citation2019). More recent indicator development efforts have shifted to advancing community-based management approaches involving stakeholder guidance. In these case studies (West Hawai’i and Sitka), indicator development started as a bottom-up process emphasizing the co-equal treatment of human well-being and biophysical indicators. The paths of these case studies not only trace the effect of improvements in indicator development methods (especially for social indicators), but also the growing focus on multisector EBM in coastal regions, rather than single-sector ecosystem-based fisheries management.
A comparative review of the seven case studies underscores three major points related to indicator development:
Engagement tools: Developing conceptual models with stakeholders and local community members seems to be a consistent method used to satisfy the scoping step of the IEA framework and set the stage for a meaningful indicator development process.
Information transfer: Information exchange across the broad community of EBM practitioners advances and benefits the indicator-development process across other regions by leveraging limited resources to jump-start or facilitate progress.
Balancing scale and tradeoffs: The chronology of indicator development case studies tracks the progress of regional EBM efforts, moving from large fisheries-driven questions to smaller community-based priorities, and highlights some of the recurring challenges surrounding the integration of natural and human systems that often operate at different scales.
Below, we elaborate further on each of these three essential elements to place-based indicator development in support of EBM.
Engagement tools
Responsive engagement with managers and stakeholders is critical to a successful indicator development process (Wondolleck and Yaffee Citation2017) because it fosters the coproduction of knowledge that assimilates local dimensions of large ecosystems, and thereby identifies subtle ecosystem changes and multifaceted links between human well-being and marine ecosystems (Levin et al. Citation2009, Levin et al. Citation2016). Visual imagery can be an especially effective communication strategy for translating complex concepts, summarizing ideas, and fostering participation (Tufte Citation2006). Scientists and communications specialists from the AFSC have been leaders in developing and presenting ESRs to help inform sustainable fisheries management decisions (e.g., Siddon and Zador Citation2019). The ESR Brief provides a concise, four-page synthesis () that communicates key, fisheries-relevant, ecosystem storylines using indicators selected from the full ESR. The CCIEA team has followed a similar trajectory with their ESR, in the beginning reporting a large number of ecosystem indicators, to more recently creating a story-based narrative using a subset of indicators to communicate relevant ecosystem context to decision makers and stakeholders.
Conceptual models are a valuable means for stakeholders, managers, policymakers, and scientists to describe their perceptions of ecosystems and develop clear consensus around what components, linkages, and processes are most important to ecosystem function (Orians et al. Citation2012). It is thus not surprising that conceptual models were common to most of these indicator selection efforts, particularly when used to heighten engagement and feedback from a diverse pool of stakeholders. IEA practitioners with MBNMS and FKNMS are employing habitat-based conceptual models as tools for identifying ecosystem indicators for condition reports (). Borrowing from the examples created by Andrews, Harvey, and Levin (Citation2013) to support marine spatial management in Washington State, scientists from MBNMS created conceptual models to enhance reviewers’ abilities to map indicators to condition report questions and assess redundancies or gaps in the indicator portfolio for each habitat (Brown et al. Citation2019). The conceptual models both enhanced and complemented data matrices emerging from the Kershner et al. (Citation2011) indicator evaluation framework, and provided a clear, visually appealing, two-way communication tool for a range of audiences to discuss ecosystem structure and suggest additional ideas for improvement (Brown et al. Citation2019). These conceptual models are currently providing a template for web-based, interactive info-graphics designed in collaboration with the U.S. Marine Biodiversity Observation Network for science and education outreach at both MBNMS and FKNMSFootnote3.
Visual imagery has also been applied from the bottom-up to enhance stakeholder engagement and incorporate their holistic understanding of local ecosystems, and the use of “participatory focus groups” with community members was consistent among the smaller spatial scale case studies. In both Sitka, AK and West Hawai’i, local community members’ first-hand knowledge of their respective systems was used to create conceptual models () and to help rank and select the final indicators used to monitor the status and trends of biophysical and human well-being attributes of these communities. Perhaps most importantly, the co-creation of conceptual models and indicator selection strengthened trust and communication between stakeholders, managers, and policymakers, which may lead to continued participation by community members in the resource management process.
Information transfer – National IEA as a community of practice
NOAA’s national IEA program has served as an essential community of practice, allowing for the exchange of indicator development methods, tools, and approaches across regions. In many of the case studies, indicator development benefited from preceding efforts, almost regardless of scale, helping to leverage limited time and human resources. In fact, the flow of concepts and ideas may be drawn as a web of interactions that map how various methods and approaches have been adopted among the case studies ().
Figure 4. Transfer of methods, tools, and approaches between NOAA IEA teams working to develop indicator portfolios for each of the focal EBM case studies (dark blue ovals) described in this paper. The year the indicator development process was initially completed is noted under each project. Other EBM efforts (ongoing or planned) are shown as light blue ovals. Light blue rectangles provide key indicator development framework sources. Direction and types of interactions are shown by arrow orientation and component codes: C = conceptual models, I = potential indicators, E = evaluation methods, S = selection methods.
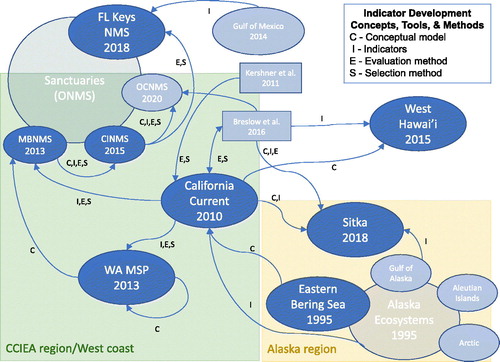
The evolution of the West Coast indicator development process was driven by an initial template established by the Alaska region, intensive innovations by the CCIEA team influenced by work in Puget Sound (Kershner et al. Citation2011, Biedenweg, Harguth, and Stiles Citation2017), and iterative improvements as it was adapted by collaborators for new places. AFSC scientists developed standardized time-series plotting formats that effectively presented indicator data to decision-makers and stakeholders associated with the NPFMCFootnote4 (Zador, Holsman, et al. Citation2017). CCIEA practitioners drew inspiration and advice from the Alaska experience as they developed their initial indicator portfolios and adopted similar plotting formats (). The indicator-selection framework used by the CCIEA team, in turn, was adapted to ongoing efforts for Washington MSP and ONMS. The Washington MSP work involved CCIEA team members, who leveraged supplemental resources to use similar methods to develop indicator portfolios for the Washington MSP process. A critical innovation in their work was the development of habitat-based conceptual models for partitioning and communicating the key environmental drivers, human activities, and ecological interactions in coastal habitats for Washington state. A parallel effort involving CCIEA and sanctuary scientists collaboration led MBNMS to adopt similar habitat-based models for their system (), but because of time and personnel limitations, they adapted their indicator considerations to a subset of possible evaluation criteria (6 out of 18). The MBNMS work satisfied ongoing calls for a more rigorous and transparent basis for assessing the status of National Marine Sanctuary resources, and has since been implemented as a preferred method to guide subsequent efforts across ONMS (e.g., Channel Islands, Olympic Coast, and Florida Keys NMS).
Annual meetings and workshops sponsored by the National IEA Program provided the mortar that brought EBM practitioners together to learn scoping and communication strategies, and the critical role of a transparent indicator development process (Samhouri et al. Citation2014). Among the many advantages to these gatherings was the role that they played in leveraging resources and expertise not available to smaller, poorly funded efforts, which ultimately reduced the time, effort, and technical expertise needed to develop indicator portfolios and innovative communication tools for these regions.
Scale and tradeoffs: finding the right balance
Place-based IEAs are defined by the goals of the IEA and the spatial scale at which human activities are managed, as covered in the scoping step of the IEA process (). However, one of the primary challenges of the indicator selection process mirrors that of EBM: how do we integrate natural and human systems when they often operate at seemingly different scales, with varying management goals, and often are interpreted through diverse professional disciplines and information streams? Our review of case studies shows that one size does not fit all situations, and indicator selection approaches should be adapted to the scale, goals, and resources available within the system.
While the biophysical and human dimensions of IEA indicator development have always been considered co-equal, the effort to conceptualize and codify human well-being indicators generally has lagged behind biophysical efforts, likely due to the inherent imbalance between NOAA’s strengths in oceanography and fisheries science, and associated gaps in social science expertise and staffing (NOAA Citation2013). In the CCIEA case study, the initial work on human dimensions focused on measuring and establishing baseline levels of fishing reliance and socioeconomic vulnerability for communities engaged in commercial fisheries on the US West Coast, based on readily available economic and demographic data that informed federal fishery policy at a large scale (Norman et al. Citation2007, Harvey et al. Citation2019). Since then, diverse teams working throughout other regional IEAs have made great strides to improve development and evaluation methods for indicators of human well-being. Some of these efforts have focused on capturing scientific expertise of human well-being (Zador, Holsman, et al. Citation2017, Breslow et al. Citation2016), while others have engaged specifically with commercial fisheries participants (Hollowed et al. Citation2020), or across broad stakeholder groups (Ingram, Oleson, and Gove Citation2018, Karnauskas et al. Citation2019, Poe, Donatuto, and Satterfield Citation2016) throughout the indicator development process. These studies continue to highlight gaps in intangible, cultural, and subjective dimensions of human well-being, as well as the need for more locally specific indicators that are meaningful to diverse communities (Poe, Norman, and Levin Citation2014, Leong et al. Citation2019, Breslow et al. Citation2017).
Our capacity for developing and representing meaningful indicators for social-ecological attributes remains challenging due to inherent mismatches in the scale of data availability and resources across these systems. At the scale of an LME, biophysical data on fisheries, habitat, and protected species resources is collected by design to manage for high biological complexity across multiple ecological subregions. By contrast, human well-being indicators are often not relevant at the LME scale due to the extreme diversity of human stakeholder composition and communities (e.g., population demographics, dependence upon marine natural resources, and stakeholder priority objectives). Social scientists in Alaska have tried to bridge this gap by including a community by community breakdown of human population, migration, and school enrollment indicators within an individual LME (Siddon and Zador Citation2019). Yet the complexity of social-ecological systems often provides rationale for partitioning an LME into smaller subregions and communities to better enable the integration of natural and social science disciplines that are similarly bounded in space and time.
Complicating this effort is the fact that biophysical data are often lacking at these finer scales, inhibiting the coupling with human dimensions indicators. The indicator development process, particularly the criteria used to select useful indicators, can help identify data or information gaps (Andrews, Williams et al. Citation2015, Rosellon-Druker et al. Citation2019), but these data gaps often remain unmet because biophysical research funding is generally targeted toward larger scale questions. Smaller-scale, place-based IEAs also suffer from reproducibility and scalability issues, because the indicator selection process at this scale is resource-intensive and may not easily be scaled up due to the diversity of human communities and their priority objectives for marine ecosystems (Biedenweg Citation2017).
Reflections and next steps
These case studies, developed across a range of scales and EBM objectives, demonstrated several common lessons that are consistent with the indicator development literature and should benefit future place-based IEA efforts. First, engaging stakeholders, managers and other partners builds trust, communication, and understanding of system structure, societal goals and values (Enquist et al. Citation2017). This engagement should promote mutual agreement on what attributes—and indicators—of the social-ecological system are most important to monitor. Second, transparency in the development and tracking of indicators, and their use in decision-making, is critical for the legitimacy of science as a partner in EBM (Orians et al. Citation2012). If indicators of system state or risk are the basis upon which management decisions or policies are made, then the people who will be affected will be more likely to trust the process if they are fully assured of the indicators’ validity. Third, developing and tracking indicators for EBM should be a transdisciplinary process (Biedenweg, Harguth, and Stiles Citation2017) if it is to identify and monitor the diverse attributes of a social-ecological system. Conceptual models feature arrays of biophysical and social components, linkages, and objectives (Levin et al. Citation2016); identifying the best indicators for these complex systems necessarily requires collaboration and balance across research specialties. Fourth, building on existing experience and expertise can help maximize the high time and human resources required to develop indicator portfolios de novo. The NOAA IEA program fostered a network of shared experience and expertise that can serve as a model for other practitioners and researchers. Finally, developing indicators requires persistence, patience, and long-term commitment because ecosystem management is necessarily adaptive in nature. The case studies above stretch from years to decades in practice, and indicator portfolios are more likely to evolve than not, as new issues emerge, research budgets change, and governance systems develop at local, regional, or ecosystem-level scales. The principles and practices identified here must be revisited regularly and collaboratively in order to sustain ongoing progress in identifying appropriate indicators for place-based management
These lessons are consistent with the NOAA IEA framework () under which the seven case studies were undertaken. An IEA approach (Levin et al. Citation2009, Samhouri et al. Citation2014, Harvey, Kelble, and Schwing Citation2017) emphasizes early-and-often engagement, interdisciplinary science, and the iterative, evolving nature of ecosystem management. Additionally, the IEA framework was intended to be scalable to issues and needs ranging from local to ecosystem-levels (Levin et al. Citation2009). Finally, the NOAA IEA program has facilitated progress in these case studies as a “community of practice” (), even as each case study is distinct and no single template was followed for the progress made to date. This illustrates two features that characterize collaborations in support of EBM, according to Wondolleck and Yaffee (Citation2017): first, collaborations have tangible structural elements (“bricks”), such as NOAA’s legal mandates, regional management plans, and science frameworks such as IEA. Second, collaborations have intangible elements (“mortar”), such as informal processes, relationships, social norms, information-sharing networks, and societal objectives. Intangible elements fundamentally influence the ability of tangible tools to address management issues. The engagement efforts that are occurring or evolving in the case studies above are intended to promote healthy, transparent scientist-manager-stakeholder partnerships that positively support the tangible elements of EBM at local, regional and ecosystem scales.
As indicator development and application continues in place-based applications, IEA practitioners who embrace the social-ecological nature of each case study may reap insights that emerge from a more holistic understanding of the system. Indicator selection and evaluation processes should ideally balance biophysical and social indicators, so that the full complexity of the system is acknowledged and comprehensive indicators are available to track management tradeoffs in both the biophysical and social domains. In addition, by more fully considering the continuum between quantitative and qualitative approaches to indicator selection, the portfolio may balance data-driven indicators with more responsive measures derived from oral histories or expert insight. Biophysical indicators largely reside at the quantitative end, and have dominated applications such as the CCIEA and EBS case studies. However, qualitative information, such as local and traditional ecological knowledge from indigenous cultures and residents, is an equally valuable perspective for understanding biophysical system state and increasingly incorporated into IEA efforts. Moreover, qualitative information about social and ecological conditions within coastal communities and institutions may help indicate how people will respond to external drivers such as management actions or extreme events. How people respond to change is part of the intangible “mortar” of an EBM collaboration (Wondolleck and Yaffee Citation2017), and is thus essential to the dynamics of place-based social-ecological systems of all scales.
Notes
References
- Andrews, K. S., J. M. Coyle, and C. J. Harvey. 2015. Ecological indicators for Washington State’s outer coastal waters. Final report to the Washington Department of Natural Resources.
- Andrews, K. S., G. D. Williams, J. F. Samhouri, K. N. Marshall, V. Gertseva, and P. S. Levin. 2015. The legacy of a crowded ocean: Indicators, status, and trends of anthropogenic pressures in the California Current ecosystem. Environmental Conservation 42 (2):139–51. doi: 10.1017/S0376892914000277.
- Andrews, K. S., C. J. Harvey, and P. S. Levin. 2013. Conceptual models and indicator selection process for Washington State’s marine spatial planning process. Summary report to the Washington Department of Natural Resources.
- Arkema, K. K., S. C. Abramson, and B. M. Dewsbury. 2006. Marine ecosystem-based management: From characterization to implementation. Frontiers in Ecology and the Environment 4 (10):525–32. doi: 10.1890/1540-9295(2006)4[525:MEMFCT]2.0.CO;2.
- Biedenweg, K. 2017. A comparative study of human well-being indicators across three Puget Sound regions. Society & Natural Resources 30 (3):362–76. doi: 10.1080/08941920.2016.1209606.
- Biedenweg, K., H. Harguth, and K. Stiles. 2017. The science and politics of human well-being: A case study in cocreating indicators for Puget Sound restoration. Ecology and Society 22 (3):11. doi: 10.5751/ES-09424-220311.
- Bond, N. A., M. F. Cronin, H. Freeland, and N. Mantua. 2015. Causes and impacts of the 2014 warm anomaly in the NE Pacific. Geophysical Research Letters 42 (9):3414–20. doi: 10.1002/2015GL063306.
- Breslow, S. J., M. Allen, D. Holstein, B. Sojka, R. Barnea, X. Basurto, C. Carothers, S. Charnley, S. Coulthard, N. Dolsak, et al. 2017. Evaluating indicators of human well-being for ecosystem-based management. Ecosystem Health and Sustainability 3 (12):1–18. doi: 10.1080/20964129.2017.1411767.
- Breslow, S. J., B. Sojka, R. Barnea, X. Basurto, C. Carothers, S. Charnley, S. Coulthard, N. Dolsak, J. Donatuto, C. Garcia-Quijano, et al. 2016. Conceptualizing and operationalizing human wellbeing for ecosystem assessment and management. Environmental Science & Policy 66:250–9. doi: 10.1016/j.envsci.2016.06.023.
- Brown, J., G. D. Williams, C. J. Harvey, A. D. DeVogelaere, and C. Caldow. 2019. Developing science-based indicator portfolios for national marine sanctuary condition reports. Silver Spring, MD. 66 pp.: Marine Sanctuaries Conservation Series. U.S. Department of Commerce, National Oceanic and Atmospheric Administration, Office of National Marine Sanctuaries.
- Decker, K. 2015. Economic Indicators Report. In A Report to Washington Department of Natural Resources. Washington Sea Grant.
- Enquist, C. A. F., S. T. Jackson, G. M. Garfin, F. W. Davis, L. R. Gerber, J. A. Littell, J. L. Tank, A. J. Terando, T. U. Wall, B. Halpern, et al. 2017. Foundations of translational ecology. Frontiers in Ecology and the Environment 15 (10):541–50. doi: 10.1002/fee.1733.
- Fulton, E. A., A. D. M. Smith, and A. E. Punt. 2005. Which ecological indicators can robustly detect effects of fishing? ICES Journal of Marine Science 62 (3):540–51. doi: 10.1016/j.icesjms.2004.12.012.
- Gove, J. M., J. Lecky, W. J. Walsh, R. J. Ingram, K. Leong, I. D. Williams, J. J. Polovina, J. A. Maynard, R. Whittier, L. Kramer, et al. 2019. West Hawai‘i Integrated Ecosystem Assessment Ecosystem Status Report. In PIFSC Special Publication. Pacific Islands Fisheries Science Center,.
- Gove, J. M., J. J. Polovina, W. J. Walsh, A. Heenan, I. D. Williams, L. M. Wedding, R. J. Ingram, J. Lecky, K. L. L. Oleson, and H. Walecka. 2016. West Hawaii Integrated Ecosystem Assessment: Ecosystem Trends and Status Report. Pacific Islands Fisheries Science Center.
- Guerrero, J., and R. G. Kvitek. 1996. Monterey Bay National Marine Sanctuary Site Characterization. edited by J. Guerrero and R. G. Kvitek.
- Harvey, C. J., N. Garfield, E. L. Hazen, and G. D. Williams. 2014. The California Current Integrated Ecosystem Assessment: Phase III Report. edited by C. J. Harvey, N. Garfield, E. L. Hazen and G. D. Williams. U.S. Department of Commerce.
- Harvey, C., N. Garfield, G. Williams, N. Tolimieri, and I. Schroeder. 2019. Ecosystem Status Report of the California Current for 2019: A summary of ecosystem indicators compiled by the California Current Integrated Ecosystem Assessment Team (CCEIA). edited by C. Harvey, N. Garfield, G. Williams, N. Tolimieri and I. Schroeder.
- Harvey, C. J., C. R. Kelble, and F. B. Schwing. 2017. Implementing "the IEA": Using integrated ecosystem assessment frameworks, programs, and applications in support of operationalizing ecosystem-based management. ICES Journal of Marine Science 74 (1):398–405. doi: 10.1093/icesjms/fsw201.
- Himes-Cornell, A., and S. Kasperski. 2016. Using socioeconomic and fisheries involvement indices to understand alaska fishing community well-being. Coastal Management 44 (1):36–70. doi: 10.1080/08920753.2016.1116671.
- Hollowed, A. B., K. K. Holsman, A. C. Haynie, A. J. Hermann, A. E. Punt, K. Aydin, J. N. Ianelli, S. Kasperski, W. Cheng, A. Faig, et al. 2020. Integrated modeling to evaluate climate change impacts on coupled social-ecological systems in Alaska. Frontiers in Marine Science 6: 775. doi: 10.3389/fmars.2019.00775.
- Ingram, R. J., K. L. L. Oleson, and J. M. Gove. 2018. Revealing complex social-ecological interactions through participatory modeling to support ecosystem-based management in Hawai'i. Marine Policy 94:180–8. doi: 10.1016/j.marpol.2018.05.002.
- Jennings, S., and N. K. Dulvy. 2005. Reference points and reference directions for size-based indicators of community structure. ICES Journal of Marine Science 62 (3):397–404. doi: 10.1016/j.icesjms.2004.07.030.
- Karnauskas, M., R. J. Allee, J. K. Craig, M. Jepson, C. R. Kelble, M. Kilgour, R. D. Methot, and S. D. Regan. 2019. Effective science-based fishery management is good for Gulf of Mexico's "bottom line" – But evolving challenges remain. Fisheries 44 (5):239–42. doi: 10.1002/fsh.10216.
- Kershner, J., J. F. Samhouri, C. A. James, and P. S. Levin. 2011. Selecting indicator portfolios for marine species and food webs: A Puget Sound case study. Plos One. 6 (10):e25248. doi: 10.1371/journal.pone.0025248.
- Landres, P. B., J. Verner, and J. W. Thomas. 1988. Ecological uses of vertebrate indicator Species—A critique. Conservation Biology 2 (4):316–28. doi: 10.1111/j.1523-1739.1988.tb00195.x.
- Leong, K. M., S. Wongbusarakum, R. J. Ingram, A. Mawyer, and M. R. Poe. 2019. Improving representation of human well-being and cultural importance in conceptualizing the West Hawai'i ecosystem. Frontiers in Marine Science 6: 231. doi: 10.3389/fmars.2019.00231.
- Levin, P. S., S. J. Breslow, C. J. Harvey, K. C. Norman, M. R. Poe, G. D. Williams, and M. L. Plummer. 2016. Conceptualization of social-ecological systems of the California current: An examination of interdisciplinary science supporting ecosystem-based management. Coastal Management 44 (5):397–408. doi: 10.1080/08920753.2016.1208036.
- Levin, P. S., M. J. Fogarty, S. A. Murawski, and D. Fluharty. 2009. Integrated ecosystem assessments: Developing the scientific basis for ecosystem-based management of the ocean. PLoS Biology 7 (1):e1000014. doi: 10.1371/journal.pbio.1000014.
- Levin, P. S., and F. B. Schwing. 2011. Technical background for an integrated ecosystem assessment of the California Current: Groundfish, salmon, green sturgeon, and ecosystem health. edited by P. S. Levin and F. B. Schwing. U.S. Department of Commerce.
- Link, J. S., and H. I. Browman. 2014. Integrating what? Levels of marine ecosystem-based assessment and management introduction. ICES Journal of Marine Science 71 (5):1170–3. doi: 10.1093/icesjms/fsu026.
- Livingston, P. A., K. Aydin, J. Boldt, J. Ianelli, and J. Jurado-Molina. 2005. A framework for ecosystem impacts assessment using an indicator approach. ICES Journal of Marine Science 62 (3):592–7. doi: 10.1016/j.icesjms.2004.12.016.
- Loomis, D. K., and S. K. Paterson. 2014. Human dimensions indicators of coastal ecosystem services: A hierarchical perspective. Ecological Indicators 44:63–8. doi: 10.1016/j.ecolind.2013.12.022.
- Montenero, K. A., C. Kelble, and K. Brogden. in review. A quantitative and qualitative decision-making process to select ecological indicators.
- NOAA, National Oceanic and Atmospheric Administration. 2008. Monterey Bay National Marine Sanctuary Final Management Plan. US Department of Commerce, National Ocean Service, National Marine Sanctuary Program.
- NOAA, National Oceanic and Atmospheric Administration. 2013. NOAA, Society and the Economy: An Assessment of NOAA's Social Science Capability and Needs. edited by National Oceanic and Atmospheric Administration NOAA. Silver Spring, MD.
- NOAA, National Oceanic and Atmospheric Administration. 2016. Ecosystem-based fisheries management policy. U.S. Department of Commerce, National Marine Fisheries Service Policy 01–120.
- Norman, K. C., J. A. Sepez, H. Lazrus, N. Milne, C. Package, S. Russell, K. Grant, R. Petersen Lewis, J. Primo, E. Springer, et al. 2007. Community profiles for West Coast and North Pacific fisheries - Washington, Oregon, California, and other U.S. states. U.S. Dept. of Commerce, NOAA Tech. Memo., NMFS-NWFSC-85, 602. p
- Noss, R. F. 1990. Indicators for monitoring biodiversity—A hierarchical approach. Conservation Biology 4 (4):355–64. doi: 10.1111/j.1523-1739.1990.tb00309.x.
- ONMS, Office of National Marine Sanctuaries. 2015. Monterey Bay National Marine Sanctuary Condition Report Partial Update: A New Assessment of the State of Sanctuary Resources 2015. Silver Spring, MD: U.S. Department of Commerce, National Oceanic and Atmospheric Administration.
- ONMS, Office of National Marine Sanctuaries. 2018. Guide for Developing National Marine Sanctuary Condition Reports. Silver Spring, Maryland: U.S. Department of Commerce, National Oceanic and Atmospheric Administration.
- ONMS, Office of National Marine Sanctuaries. 2019a. Channel Islands National Marine Sanctuary 2016 Condition Report. Silver Spring, MD: U.S. Department of Commerce, National Oceanic and Atmospheric Administration.
- ONMS, Office of National Marine Sanctuaries. 2019b. Draft environmental impact statement for Florida Keys National Marine Sanctuary: A Restoration Blueprint. Silver Spring, MD: U.S. Department of Commerce, National Oceanic and Atmospheric Administration.
- Orians, G., M. Dethier, C. Hirschman, A. Kohn, D. Patten, and T. Young. 2012. Sound indicators: A review for the Puget Sound partnership an assessment of the Puget Sound partnership’s progress in developing the scientific basis for monitoring and assessing progress toward achieving a vibrant Puget Sound.
- PFMC, Pacific Fishery Management Council. 2013. Pacific Coast Fishery Ecosystem Plan for the U.S. Portion of the California Current Large Marine Ecosystem. Pacific Fishery Management Council, 7700 NE Ambassador Place, Suite 101, Portland, Oregon 97220–1384.
- Poe, M. R., J. Donatuto, and T. Satterfield. 2016. “Sense of place”: Human wellbeing considerations for ecological restoration in Puget Sound. Coastal Management 44 (5):409–26. doi: 10.1080/08920753.2016.1208037.
- Poe, M. R., K. C. Norman, and P. S. Levin. 2014. Cultural dimensions of socioecological systems: Key connections and guiding principles for conservation in coastal environments. Conservation Letters 7 (3):166–75. doi: 10.1111/conl.12068.
- Poe, M. R., M. K. Watkinson, B. Trosin, and K. Decker. 2015. Social indicators for the Washington coast integrated ecosystem assessment. A Report to Washington Department of Natural Resources in fulfillment of Interagency agreement No. IAA 14-204. Washington Sea Grant WSG-TR 15–07.
- Renner, M., and H. P. Huntington. 2014. Connecting subsistence harvest and marine ecology: A cluster analysis of communities by fishing and hunting patterns. Deep Sea Research Part II: Topical Studies in Oceanography 109:293–9. doi: 10.1016/j.dsr2.2014.03.005.
- Rice, J. C., and M. J. Rochet. 2005. A framework for selecting a suite of indicators for fisheries management. ICES Journal of Marine Science 62 (3):516–27. doi: 10.1016/j.icesjms.2005.01.003.
- Rosellon-Druker, J., M. Szymkowiak, C. J. Cunningham, S. Kasperski, G. H. Kruse, J. H. Moss, and E. M. Yasumiishi. 2019. Development of social-ecological conceptual models as the basis for an integrated ecosystem assessment framework in Southeast Alaska. Ecology and Society 24 (3):18. doi: 10.5751/ES-11074-240330.
- Samhouri, J. F., A. J. Haupt, P. S. Levin, J. S. Link, and R. Shuford. 2014. Lessons learned from developing integrated ecosystem assessments to inform marine ecosystem-based management in the USA. ICES Journal of Marine Science 71 (5):1205–15. doi: 10.1093/icesjms/fst141.
- Samhouri, J. F., P. S. Levin, and C. H. Ainsworth. 2010. Identifying thresholds for ecosystem-based management. PLoS One 5 (1):e8907. doi: 10.1371/journal.pone.0008907.
- Santora, J. A., N. J. Mantua, I. D. Schroeder, J. C. Field, E. L. Hazen, S. J. Bograd, W. J. Sydeman, B. K. Wells, J. Calambokidis, L. Saez, et al. 2020. Habitat compression and ecosystem shifts as potential links between marine heatwave and record whale entanglements. Nature Communications 11 (1):536. doi: 10.1038/s41467-019-14215-w.
- Siddon, E., and S. Zador. 2019. Ecosystem status report 2019: Eastern Bering Sea, Stock Assessment and Fishery Evaluation Report. North Pacific Fishery Management Council, 605 W 4th Ave, Suite 306, Anchorage, AK 99501.
- Szymkowiak, M., and S. Kasperski. 2020. Sustaining an Alaska coastal community: Integrating place based well-being indicators and fisheries participation. Coastal Management 1–25.
- Tufte, E. R. 2006. Beautiful evidence. Cheshire, CT: Graphics Press LLC.
- WADOE, Washington Department of Ecology. 2018. Marine spatial plan for Washington’s Pacific Coast.
- Weijerman, M., J. M. Gove, I. D. Williams, W. J. Walsh, D. Minton, and J. J. Polovina. 2018. Evaluating management strategies to optimise coral reef ecosystem services. Journal of Applied Ecology 55 (4):1823–33. doi: 10.1111/1365-2664.13105.
- Wolfe, R. J. 2004. Local traditions and subsistence: A synopsis from twenty-five years of research by the State of Alaska. Juneau, AK: Alaska Department of Fish and Game, Division of Subsistence.
- Wondolleck, J. M., and S. L. Yaffee. 2017. Marine ecosystem-based management in practice: Different pathways, common lessons. Washington, D.C.: Island Press.
- Zador, S. G., S. K. Gaichas, S. Kasperski, C. L. Ward, R. E. Blake, N. C. Ban, A. Himes-Cornell, and J. Z. Koehn. 2017. Linking ecosystem processes to communities of practice through commercially fished species in the Gulf of Alaska. ICES Journal of Marine Science 74 (7):2024–33. doi: 10.1093/icesjms/fsx054.
- Zador, S. G., K. K. Holsman, K. Y. Aydin, and S. K. Gaichas. 2017. Ecosystem considerations in Alaska: The value of qualitative assessments. ICES Journal of Marine Science 74 (1):421–30. doi: 10.1093/icesjms/fsw144.