
Abstract
Integrated ecosystem assessments (IEAs) compile and use indicators, risk assessments, and other analyses to address regional policy needs at varying spatial scales. Although approaches to implementing IEAs are context-specific, challenges in data acquisition, management, processing, analysis, and communication are universal. By embracing open science, in which scientific data, methods, and products are made publicly accessible, along with the ever-expanding tools facilitating open science, IEA practitioners will be better equipped to address these challenges. Here, we provide a snapshot of the state of open science practices in IEAs on-going across the United States. We show that open science has improved the flexibility, reproducibility, and efficiency of the scientific workflows within the IEA framework. Although the initial time investment necessary for developing open science workflows may appear daunting, we show that the subsequent returns provided by the efficient and transparent development of IEA products are worth the effort. By improving the implementation of IEAs, open science tools and principals have the potential to further Ecosystem Based Management (EBM) worldwide.
Keywords:
Introduction
As implemented so far, integrated ecosystem assessments (IEAs) are bespoke products specific to regional policy needs at varying spatial scales. While each assessment is unique, the processes involved in developing IEAs generally conform to the framework outlined in Levin et al. (Citation2009). This iterative framework includes a scoping phase to define management objectives and the identification of ecosystem indicators that serve as proxies for important components of the system (Levin et al. Citation2014). Changes in ecosystem indicator status (short-term) and trends (long-term) are documented in ecosystem status reports, and risk assessments are developed to identify where ecosystem considerations might threaten management objectives. The final phase of an IEA involves management strategy evaluation (MSE), in which potential management actions are tested using simulation models. Because the approach is iterative, any management actions are followed with continued monitoring and reassessment of management goals (Levin et al. Citation2008, Citation2009; Samhouri et al. Citation2014). The elements of the IEA framework are central to its implementation, but its flow is not prescriptive (Harvey, Kelble, and Schwing Citation2017). Instead, IEAs are malleable to the needs of stakeholders, a term referring to those with an interest in the resources being evaluated. In the context of fisheries, the stakeholder group could be composed of the managers and decision makers, fishery participants, and others directly or indirectly impacted by management actions (Goethel et al. Citation2019; Decker et al. Citation1996).
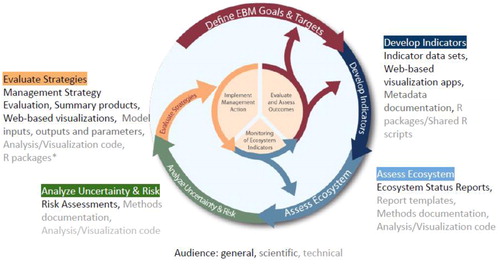
IEAs are products developed with specific goals and audiences in mind meaning that each will manifest with unique structural requirements. However, data acquisition, management, processing, analysis, and communication are universal challenges that apply across the disparate applications of IEAs. The number of entry and exit points for data in an IEA is large, and outputs vary by end-user need. For example, data may enter into an IEA during the exploratory phases of the process, where objectives are scoped and representative indicators are developed. Exit points for data products can be found in the derived indicator data informing ecosystem status reports and risk assessments. Simulated products (e.g., model output summaries) and model parameters, such as those resulting from MSE model runs, are also important to disseminate, as these results inform management actions. Any data that leaves or enters an IEA brings with it metadata and code used to analyze, process, and visualize the data. Through the processing of these datasets, accompanying code and metadata documentation become scientific and technical products in their own right, feeding into subsequent IEA outputs (). Adding to these complexities are the diversity of audiences to which IEA products appeal, including both technical and non-technical users.
Figure 1. Products as part of the IEA loop according to the audience: general, scientific, and technical (*in development).
Embracing open science, which is defined as public access to scientific data, methods, and products (Hampton et al. Citation2015; McKiernan et al. Citation2016), along with the tools facilitating open science, has been suggested as a solution to these data challenges (Michener and Jones Citation2012; Hampton et al. Citation2015; Lowndes et al. Citation2015, Citation2017; Ma et al. Citation2018). Michener and Jones (Citation2012) presented examples of how developing data ontologies, which represent formal descriptions of scientific concepts and their relationships, can streamline the synthesis of unique, cross-disciplinary datasets for analysis. Lowndes et al. (Citation2017) demonstrated that embracing open science methods resulted in increased efficiency, transparency, and repeatability in the development of the Ocean Health Index (Halpern et al. Citation2012); an iterative framework developed to assess the benefits of marine ecosystems to humans for sustainable management. Case studies for applying open science techniques to ecosystem assessments have also been completed in the context of IEAs of large marine ecosystems (LMEs); defined as discrete regions of ocean characterized by distinct hydrographic, bathymetric, and biotic relationships (Sherman and Duda Citation1999). One example comes from the Northeast IEA region in the western Atlantic, where an ecosystem assessment was developed using reproducible IPython Notebooks with formally documented provenance describing the lineage and origins of included indicator datasets (Ma et al. Citation2018). Such work highlights the growing enthusiasm for embracing open science techniques in the context of marine resource management and IEAs.
In this article, we present the various open science strategies being implemented within different phases of the IEA framework across regions in the United States. While this implementation is still nascent, we show that open science in IEAs has improved the flexibility of assessments for better responsiveness to stakeholder needs, prevented IEAs from becoming “black boxes” through greater transparency, and increased efficiency in data tasks through automated methods. The accurate capture of data provenance has been recognized as a key component of actionable science (Ma et al. Citation2014), which IEAs strive toward. Here, we argue that the continued use and improvement of open science techniques in IEAs will further improve their actionability for implementing ecosystem-based management.
Scientific workflow
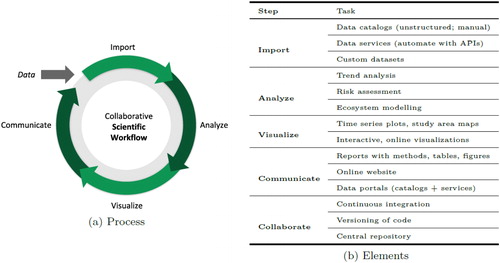
A similar scientific workflow [import, analyze, visualize, and communicate; see Wickham and Grolemund (Citation2016)] may be applied within each analytical phase of the IEA framework (ecosystem assessment, risk assessment, and MSE), and adoption of open science principles allows for efficient knowledge transfer between these phases (). Below we describe the scientific workflow () and common open science software tools used in the context of IEAs (). These examples by no means cover all of the tools available nor all of the possible applications of those tools but are representative of the methods currently in use across IEA regions in the United States. Each tool or strategy will have differential applicability across IEA projects, and so we refrain from being prescriptive in our reporting.
Figure 2. Scientific workflow within the IEA framework.
Import
Handling data in a way that is both reproducible and transparent begins with the initial import, and good data management practices must start here. Data import is a broad term used to describe bringing data into the scientific workflow. Within the IEA process, this may include data collected and tailored specifically for ecosystem assessment as well as data extracted from larger regional or global datasets. The data format and method for data transfer varies widely, from small collections of individual files (.csv, .rda., .xlsx, etc.) delivered person to person from individual contributors to formalized queries of databases or repositories. Data sources range from fully open to highly restricted, and many sources include their own data management systems for tracking and distributing data and metadata. The messy nature of data acquisition and import presents a challenge for tracking metadata and data provenance, particularly given the iterative nature of IEAs, where source data may need to be reanalyzed and re-queried as indicators are updated to address management priorities. Leveraging open science software tools to control the import, storage, and management of datasets can help address many of these challenges (Yenni Citation2019).
Two such tools for identifying and importing data into any phase of the IEA framework are data catalogs and data services. Data catalogs serve as an inventory of available data. Examples of data catalogs can be found nationally (https://data.gov), for NOAA (https://data.noaa.gov) and more specifically for marine biodiversity (https://mbon.ioos.us). They present metadata so at a glance the data consumer can determine if the full dataset meets their needs. On-line data services further provide a standard way of downloading the raw data (not just the metadata), and possibly a subset (not the whole set of data), by a human using a web browser as well as machine-to-machine communication via a consistent programmable interface for use by applications or scripts.
The data service ERDDAP (Simons Citation2019) is a free and open source software tool that can serve gridded and tabular datasets in a variety of formats (.csv, .nc, etc.) through web pages or RESTful web services. ERDDAP servers provide direct and consistent access to scientific data for IEA scientists and the public, for example, all the indicator data used in the California Current IEA region can be accessed via ERDDAP (CCIEA indicator tables and dashboard at www.integratedecosystemassessment.noaa.gov). ERDDAP datasets can be imported programmatically with any software that supports the OPeNDAP protocol (e.g., R and Matlab), and users do not need to know the details of how the data are stored in order to access it in the format of their choice. When properly documented with metadata, both data catalogs and data services provide more transparent and efficient paths of importing data compared to traditional methods like email. As more IEA contributors develop data catalogs and services, the network of publicly available, properly documented IEA source data products will continue to grow.
Data provisioning
A data provisioning strategy, through which the dissemination of data between collaborators and with the public is defined, is important for the development and execution of the IEA process. Establishing a data service or central repository for indicator data provides access to the data for all collaborators, and in addition provides a single authoritative source for the latest data and metadata. Data services such as ERDDAP are accessible using both point and click or programmatic methods (). ERDDAP allows a data set to be subsetted and downloaded in various formats. For example, data from a selection of only certain variables from a limited time frame may be downloaded as a time series plot in PNG or as tables in CSV or JSON. DataOne (Michener et al. Citation2012) provides a full archive of a dataset in most any format, but does not offer consistent dataset subsetting and representation like ERDDAP; instead, the emphasis of DataOne is on metadata and long-term data storage. Both ERDDAP and DataOne can have standardized metadata, e.g., in Ecological Metadata Language (EML) associated with datasets that describe the data and provenance information. Inputting and maintaining metadata is one of the more onerous yet essential tasks of data management to ensure data integrity and proper usage. A short-term, but flexible strategy for provisioning data is to use Github to store the data files, such as done with R data package, ecodata (github.com/NOAA-EDAB/ecodata) in the Northeast IEA region. This method is feasible for short tabular datasets (e.g., .csv); for storage and tracking of larger non-text datasets (a task for which traditional version control software like git is poorly suited), data versioning tools like DVC (https://dvc.org) may be of use instead. Rather than downloading data and keeping private copies on individual computers, specific versions and data sources can be flagged and products updated in an automated fashion as the data are revised.
A related challenge in the provisioning of scientific data to the public stems from the dual-role that many scientists inevitably play when charged with developing IEA products. Namely, scientists must develop high-quality IEA products while also maintaining a data service for ensuring accessibility; the latter being a niche skillset outside the scope of training for most scientists. As the number of datasets involved in IEAs increase, some IEA programs have turned to hiring data analysts to fill in these valuable, but often overlooked skill sets. Installing and maintaining a data service such as ERDDAP requires skilled analysts that can make the service a priority without taking away from the efforts of IEA subject matter experts that lack training in data provisioning. However, hiring such specialists may be outside the scope of necessity for many IEAs that, for example, do not need a data service continually provisioning large and frequently updated datasets (e.g., satellite imagery). In such cases, starting a data service will still have some upfront cost for training administrators but less so for maintaining and updating data. With proper versioning or version control, data services translate into more efficiently developed IEA products by acting as central repositories for critical datasets. This strategy also ensures that the most current version of a dataset can be provisioned to stakeholders quickly and easily.
Analyze
The analysis performed in each phase of the IEA framework varies from simple trend analysis to more complex ecosystem modeling and simulation. To accomplish these disparate tasks, software tools have been developed and deployed to streamline each phase of the IEA framework. Software packages used to store related functions specific to the needs of regional IEAs have been built embracing open science principles (for example, several IEA software products are under development at github.com/NOAA-EDAB). These packages handle everything from simple to complex analyses with source code made available to the public to promote reproducibility and transparency. Standard packaging of functions creates inline documentation and allows others in the open-source community to contribute improvements for approval by the package author.
The NOAA IEA community has also built on the open-source nature of some existing ecosystem models such as Ecopath with Ecosim (Christensen and Walters Citation2004). There are Matlab and R versions available, both of which rely on a scripting environment rather than a point and click graphical user interface (GUI; Lucey, Gaichas, and Aydin Citation2020, Kearney Citation2017). The analysis step in the scientific framework is important and decisions made here should be defendable; the application of open science will make this step more transparent and thus trustworthy.
Visualize
Once analyzed, information must be shared in a digestible format, most likely some intuitive visualization. To produce understandable visualizations and make them available to resource managers and the public, IEA practitioners must package complex ecosystem information quickly and repeatedly. Application of software tools has greatly decreased the time spent building visualizations resulting in more rapid and effective communication of IEA products.
A common choice for creating reproducible data visualizations is the ggplot2 R library (Wickham Citation2016; Wilkinson Citation2012). Static visualizations produced in ggplot2 or similar R packages can be made interactive for web-based visualizations through a rich suite of open source tools providing access to JavaScript data visualization libraries (e.g., those showcased at htmlwidgets.org). These tools are not limited to the R language, but we highlight them here as a use case. Similar reproducible visualization tools exist for other programming languages; for example, matplotlib and Jupyter Widgets for Python (Hunter Citation2007; Kluyver et al. Citation2016) and LiveScripts for MATLAB (Shampine and Reichelt Citation1997). Regardless, the use of reproducible visualization techniques facilitates the development of standardized visualizations (e.g., for maps and time series) that streamline the incorporation of new data and make the iterative nature of IEAs more efficient. For example, in the NE-LME, the ecodata R package is used in IEA products to provide standardized trend visualization functions and plotting themes. This reduces the time spent by the analyst customizing visualizations and simplifies the incorporation of new data into visualizations.
Communicate
Perhaps the most important step in the scientific workflow is the communication of products developed for regional IEAs. As shown in , the diversity of IEA products is further complicated by the many audiences that comprise the stakeholder group. Several tools have been used by IEA teams to meet this challenge; perhaps most notably the use of interactive websites allowing users to visualize and interact with IEA data at multiple technical levels (e.g., https://mbon.ioos.us). These websites, with associated reports and data portals, all must be established and maintained throughout the often multi-year IEA process.
Some IEA teams have chosen to use notebook scripting software, such as R Markdown (Baumer et al. Citation2014), Jupyter Notebooks (Kluyver et al. Citation2016), or Matlab LiveScripts (Shampine and Reichelt Citation1997), to build their yearly reports; scripting-based methods of reporting are typically more reproducible than traditional approaches like Microsoft Word (Lowndes et al. Citation2017). These methods allow for template development to ensure cohesive products between years, and also for the simultaneous editing of code and text for simplifying workflows. This approach removes the need to copy/paste figures into a document. Programmatic document creation can be translated to other communication types (presentations, books, articles, etc.) facilitating the delivery of information to a variety of audiences. All of these features, and especially when combined with public code repositories, promote transparency, and create a balance between automation and flexibility.
Web applications and data portals play an important communicative role within an IEA. Web applications can provide a means of communicating indicator status and trends to managers, fisheries councils, and the public, and can be designed to customize the experience for particular interest groups. The technical barriers to developing useful interactive web products have declined with the integration of common web-based visualization libraries that previously required custom web coding (e.g., in JavaScript, CSS, and HTML), and such visualizations can now be easily rendered with scientific programming languages like Python and R (e.g., for a showcase of R examples, see http://htmlwidgets.org). Entire websites may be generated from R Markdown documents or Python-based Jupyter notebooks (Kluyver et al. Citation2016) for sharing IEA products (e.g., https://noaa-edab.github.io/tech-doc/). Further, web applications can directly access data services such as ERDDAP in order to always serve the most recent indicator data. For instance, the Channel Islands National Marine Sanctuary Condition Report has been “webenized” from a static PDF report into an on-line website (https://marinebon.org/cinms) that pulls from ERDDAP servers the latest sea-surface temperature and Chlorophyll satellite products. This website is hosted for free using Github Pages and automatically updated monthly using Github Actions that runs an R script to fetch the latest data and update the appropriate web pages. Data portals act as a tool in indicator data discovery and exploration, a source for data import and a place to view indicators in a central location, which also makes them a useful communication tool.
Collaborate
Collaboration is built into all aspects of the IEA framework and associated scientific workflows. IEAs must include input from stakeholders, management bodies and multiple scientific disciplines (Levin et al. Citation2009; Samhouri et al. Citation2014), and several open science methods have been used to facilitate this communication. Having a central repository with the latest versions of files is essential for internal collaboration. For code, the most common open-source central repository in use for IEAs is Github. Github works with the version-control software Git to track progress, roll back changes, and prevent loss of work amongst collaborators (Ram Citation2013; Chacon and Straub Citation2014).
The institutional memory gained by using Github project management, including “commit messages” that provide context for all tracked changes, and central tracking of on-going issues, means that new team members can quickly view the progression of a project and contribute. This is especially useful in IEAs in which there are many contributors and those contributors may change through time. Combining version control with a central repository, like Github, means that all interested parties have access to IEA work and team members can collaboratively and simultaneously work on projects while on different machines without losing individual work products. Github applies multiple security tools such as two-factor authentication and repository settings to help project manager’s control access and how team members can contribute to the project.
Internal reproducibility is essential for collaborative work and should be a focal component of IEA development to ensure efficiency. Code that is to be used by multiple contributors should be written with portability in mind, including the use of robust path management and avoidance of operating-system-specific constructs. Continuous integration (CI) is another software developer concept useful to the IEA process. By utilizing the “freemium” model of CI services such as Travis CI (https://travis-ci.org/), websites and reports can be automatically updated for free with the latest data and content on a regular basis (e.g., daily or monthly) and when any files in an associated public repository are changed. If anything breaks in the scripts, then maintainers can be notified via email. Together these software tools have improved the scientific workflow within all phases of the IEA framework.
Open science and the IEA process: examples
Define EBM goals and targets, develop indicators (IEA process)
Clear and achievable goals and targets are necessary for priority setting the IEA workflow (Levin et al. Citation2009), and establishing these targets requires flexible collaboration between many stakeholders. Collaborations between scientists, stakeholders, and managers may be enhanced through the adoption of open science methods. For example, the development of interactive data portal websites, such as those from the Marine Biodiversity Observation Network (https://mbon.ioos.us/), Mid-Atlantic Ocean Data Portal (http://portal.midatlanticocean.org/), or Northeast Ocean Data Portal (https://www.northeastoceandata.org/) make IEA-related science accessible for stakeholders and managers without technical backgrounds. For stakeholders, lowering the barriers to entry for accessing science products will make for more informed IEA goal development.
Embracing open science practices during this phase of the IEA process will benefit scientists as well. As Hampton et al. (Citation2015) advocated, “free and unfettered access” promotes the discovery of relevant datasets that could be used as ecosystem indicators. Further, the amount and spatiotemporal scales of open-sourced information available from a wide variety of stakeholders and public repositories creates a crosswalk between goal setting and indicator development. Open science principles allow data consumers to quickly take inventory of what data exist and at what scale relevant to their data needs (Wilkinson Citation2016).
Developing indicators that are both of interest to managers as well as relevant in explaining ecosystem dynamics is a vital phase of the IEA framework (Levin et al. Citation2009). It can be challenging to identify indicator datasets if they are not stored together or if they are not publicly available. As previously stated, IEA scientists are working with data servers to apply open science principles to overcome these challenges. Data provenance also plays an important role in indicator development and adds transparency to derived datasets (Ma et al. Citation2018).
Assess ecosystem (northeast ecosystem assessment)
There is clear interest in integrating ecosystem considerations within fishery management in the Northeast US (Biedron and Knuth Citation2016), as evidenced by recent adoption of an ecosystem policy statement by one of the two Federal fishery management bodies in the region (Seagraves Citation2016). Comprehensive Ecosystem Status Reports (NEFSC Citation2012, Citation2015) have been produced for the Northeast US since 2009. However, these reports were not specifically targeted at fishery managers.
Beginning in 2017 the Northeast IEA team began developing streamlined State of the Ecosystem (SOE) reporting tailored to a specific audience: fishery managers. Reporting to a specific audience allows the report to address specific management objectives, improving the ability of managers to use the information (Degnbol and Jarre Citation2004). Two similar yet separate reports are generated for the two Northeast regional fishery management bodies annually: the New England Fishery Management Council (NEFMC) and the Mid-Atlantic Fishery Management Council (MAFMC). The reports followed the California Current’s State of the Ecosystem report example (Pacific Fishery Management Citation2017), by limiting report length to fewer than 25 printed pages, using non-technical language, and including indicator data in a standardized format with standardized plotting throughout the report.
Northeast SOE reports emphasize synthesis across indicators by including a conceptual model linking environmental drivers, ecosystem components, human activities, and the management objectives (Pavao-Zuckerman Citation2000; Heemskerk, Wilson, and Pavao-Zuckerman Citation2003), similar to those developed for IEA in the California Current (Levin et al. Citation2016; Breslow et al. Citation2016). Reports also include a synthesis section summarizing across all objectives and associated indicators in the first 2–3 pages of the report, highlighting key messages similar to “report cards” produced in other regions (Zador et al. Citation2017). In addition to environmental and ecological indicators, fishery performance, economic, and social indicators are highlighted in response to documented management needs: “one of the greatest perceived needs for decision maker and stakeholder adoption of EBFM in the MAFMC and NEFMC is more information about human dimensions, including economics, jobs, revenue, and communities (Biedron and Knuth Citation2016).”
Regular production of ecosystem assessments are important for the continued tracking of how the system is changing (Levin et al. Citation2009; Zador et al. Citation2017) and therefore have become a staple in IEAs. Though intervals between assessments vary by region, the need to reiterate workflows persists, and developing automated workflows for common tasks (e.g., dataset updates, metadata, standardized plotting, report formatting) can greatly enhance the efficiency and reproducibility of these workflows. As discussed by Lowndes et al. (Citation2017), automating key tasks allows for quicker product turnaround, increased time spent interpreting indicators, and effectively communicating the findings. In the Northeast IEA region, the IEA team has developed a workflow to automate many aspects of their ecosystem assessment reports (Northeast Fisheries Science Center Citation2020a, Citation2020b). From initial data import to ecosystem assessment production, each step in the scientific workflow has included streamlining tools to enhance reproducibility and collaboration.
The NE IEA workflow has progressed steadily in its use of open science principles over the past few years. Each iteration of the annual ecosystem assessment brings improvements to the workflow () and identification of new opportunities for streamlining. The variety of spatial and temporal scales described by data in these reports create a complex problem for data management and directory organization. The workflow constructed to manage these complexities is as follows.
Figure 3. Northeast IEA indicator workflow from ingesting raw data to generating final reports. This workflow outlines the stream of indicator data starting with raw uploadable formats (tables in Excel or text format) or existing on-line datasets in ERDDAP. A Google Form is used to collect information on new indicators, including metadata and file uploads. Existing indicators that need to be updated with newer data can use the Data Uploader application to update and visualize the dataset with the new data. All indicator data are managed within the ecodata R package. R scripts ingest the data (get_{indicator}.R) into a documentable and reusable R dataset format (*.rda). Rmarkdown reports organized by theme alternate text with plots of the indicators. The R chunks in these Rmarkdown reports are individually output for plotting reuse by the Data Uploader application and the many IEA reports.
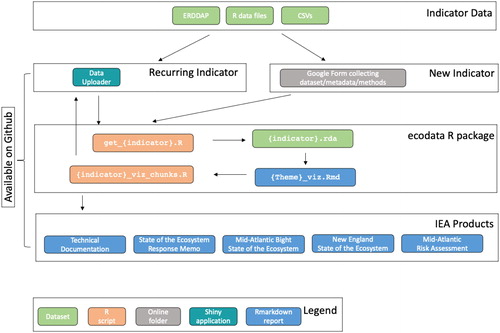
With each iteration, data contributors deliver a diverse array of datasets, both in structure and scientific domain. Processing code for these datasets, which converts them from native formats to a single, standard format used within ecosystem reporting workflows, is included with an open-source R package, ecodata, containing the derived indicator data (Hardison and Bastille Citation2018). Packages associated with ecosystem reporting are continually updated as new indicators are developed, and outputs from these packages are directly incorporated into SOE reports and other IEA products. Report production is facilitated by the use of R Markdown for automating the production of ecosystem assessments using report templates created to maintain cohesive report formatting from year to year. Team members are able to collaboratively write and edit both text and code through Github, further expediting the process. Each indicator used in the reports is documented using a comprehensive methods document where all contributors can collaboratively edit and update individual indicator chapters (NOAA-EDAB Citation2020). This workflow allows for both automation and flexibility where needed and continues to be improved upon.
All team members working on the reports, packages, or templates use the same coding language and directory structures, which greatly increases the ease of collaboration internally. The efficiency and institutional memory gained through the transition to open science principles has allowed for more reproducible and coherent products from year to year, while also allowing the products to grow and adapt to the needs and requests of the primary audience (Fishery Management Councils).
Analyze uncertainty and risk (California current fisheries)
The California Current IEA (CCIEA) is an example of a region that has embraced open science principles and built on them over the years. CCIEA reports are generated from data spanning the entire West Coast, numerous data providers, and many different ecosystems. Members include scientists from NOAA’s Northwest and Southwest Fisheries Science Centers, and many private foundations and academic institutions. The CCIEA had foresight early in the development process to agree upon a standard data format for sharing of indicators and a standard plot for indicators that included statistics of interest. Shared R scripts were developed to read the standard format and generate the plots. Today, all CCIEA indicator data is served by ERDDAP, making it available to be used directly by these same R scripts, as well as by an interactive web application that provides time series plots and tables of indicator status and trends.
In 2019, this data management technique was used to conduct an ecological risk assessment (ERA) for nine California fisheries (Samhouri et al. Citation2019). The open science principles applied to develop other phases of the IEA framework were directly implemented in this ERA. The time spent developing the ERA decreased due to the efficiency built into the data management steps of the scientific workflow, which allowed for more time dedicated to interpretation and dissemination of the results. In the future, this groundwork can be leveraged to spin up new ERAs, as the current structure exists in a repeatable format.
Like all phases of the IEA process, risk assessments require the participation of many stakeholders. The assessments are linked to management decisions and management objectives, which are often focused on balancing the needs of a variety of stakeholders. The participatory process and transparency in the development of the ERA may increase stakeholders’ trust in the assessment and therefore its application in management (Samhouri et al. Citation2019). Public cooperation in establishing the priorities and publicly available code and data highlight the adoption of open science principles by the IEA team. This adds transparency, trust, and possibly greater adherence to management decisions built on this work. In addition, it increases the potential for transferability and adaptation to decision contexts in the California Current region and beyond.
As a second example in the California Current, the development of the EcoCast framework (Hazen Citation2018) and tool (Welch Citation2018) relies on open science principles to create a user-friendly interface for determining risk to protected species from fishing. Specifically, this approach describes the expected distribution of species targeted by a fishery (e.g., swordfish) in relation to the expected distribution of species caught in that fishery by accident (e.g., leatherback turtles). These predictions of species’ distributions are made in near-real time and available on-line, enabling managers and fishermen to make daily decisions about where it is more or less risky to fish in order to avoid bycatch. This tool, therefore, informs a dynamic ocean management approach (Lewison et al. Citation2015) that can improve fisheries sustainability. It was developed in collaboration between the Southwest Fisheries Science Center (SWFSC), the National Marine Fisheries Service Western Regional Office, reflecting the collaborative approach underlying open science principles. All of the code, both describing the development of EcoCast and its operationalization, are freely available on Github.
Evaluate management strategies (Pacific Islands coral reef management)
The final phase of the IEA framework is to evaluate potential management strategies (). Management strategy evaluations (MSEs) apply models to simulate ecosystem behavior under different management scenarios to identify which policies could be used to meet the scoped objectives (Levin et al. Citation2009). The Puakō coral reef ecosystem MSE used input data from indicators like coral cover, fish biomass, and total value of catch. The data used to parameterize the Puakō coral reef ecosystem MSE were sourced from a literature review by scientific partners (Weijerman et al. Citation2018) and modeled using free and publicly available ecosystem modeling software, Ecopath with Ecosim (EwE; version 6.4.4). Simulation studies such as these carry with them a variety of input, output and parameterization data that can greatly benefit from the application of open science principles. For example, the metadata for data used in the simulation study are archived with the National Marine Fisheries Service Enterprise Data Management Program (InPort, https://www.fisheries.noaa.gov/inport/). Input and output data from this study are archived and accessible with a permanent digital object identifier (DOI) registered with the Dryad Data service (doi:10.5061/dryad.4sh45). Therefore, the results from the simulation study are replicable with the publicly available EwE software and archived input parameters.
Many other opportunities exist for using open science principles in MSE development. Applying programmatic tools such as Rpath (Lucey, Gaichas, and Aydin Citation2020), which is built off the open source EwE GUI, could improve the reproducibility of the MSE while incorporation of code and text in the report production could greatly increase communication efficiency. Automation and streamlining of this scientific workflow could lead to faster MSE production in other regions through enhanced reproducibility and institutional memory or could allow for more management strategy simulations as time needed to analyze, visualize, and communicate work is reduced. As in all other IEA phases, further adoption of open science is needed.
Discussion
Despite standardization efforts, data and metadata are often inconsistent from year to year. While this can be due to human error or events such as staff turnover, it could also be due to changes in ecosystems and priorities. Naming conventions that worked one year may fail the next due to unexpected changes in sampling regions or species behavior. Ecosystem events, such as the marine heat wave that affected much of the Northeast Pacific in 2014 (i.e., the “warm blob”) (Bond et al. Citation2015), may cause changes in survey and reporting priorities. Any IEA data workflow must be flexible enough to handle such changes without becoming unduly labor intensive. Each IEA team must establish the appropriate balance between automation and flexibility.
The use of software development tools within the scope of IEA will only get the IEA practitioner so far. Perhaps the larger challenge in the IEA process is impressing upon collaborators that their contributions are valued and their time well spent. Efficient data pipelines can lower the barrier to entry for scientists wishing to contribute their work to an IEA. However, that does not keep collaborators engaged through what is likely to be a multi-year project spanning several distinct periods. Strategies have been developed to smooth this process. As discussed, some IEA teams install contributor data into publicly accessible data servers with web-based analysis and visualization tools (). Data services such as these can incentivize long-term collaboration by adding value, visibility, and proper attribution to both the contributor and their work.
The placed-based nature of EBM determines the spatial scale of datasets used in IEA products. In the case of the Channel Islands National Marine Sanctuary condition report (National Marine Sanctuaries Citation2019), the use of openly available data led to a better description of ecosystem state for the assessment period of 2009–16. Three different long term monitoring surveys that collect samples within the sanctuary have regional extents much larger than the sanctuary boundaries; the California Cooperative Fisheries Investigations (CalCOFI) Ichthyoplankton surveys and Southern California Shelf Rockfish Hook and Line Surveys (SCSRHLS) cover much of Southern California waters and the U.S. West Coast Groundfish Bottom Trawl Survey (USWCGTW) covers the entire U.S. west coast. In each case, a subset of the data was selected to include one analysis using only samples collected in the sanctuary paired with another analysis that included samples from the large region in which the sanctuary resides. This is an example of down-scaling from larger regional monitoring to a scale that is relevant for the management area, in this case the marine sanctuary.
The issue with scale can also work in the other direction. On the east coast, where many states are included in the LME management area, smaller state-specific coastal surveys must be combined to cover the total managed area. Finding statistically sound datasets at the appropriate spatial scale is important and sometimes difficult. Public access to data of varying scales can help identify and fill gaps in data of the appropriate scale.
Making all data publicly available may not be the best practice for all datasets. Data can sometimes be sensitive in nature and thus must be handled appropriately before being made available to the masses. This is often the case for fisheries dependent data that uses catch location or in circumstances when knowledge of the exact location could put a species at risk of poaching, for example endangered black abalone, Haliotis cracherodii, along the California coast. It is standard to aggregate data in these circumstances and, though resolution is lost, the usability of the dataset increases. Password controls on services such as ERDDAP can provide a place for sensitive data while allowing access to scripts that aggregate and prepare indicators for public access. Individual IEAs can choose a method of data aggregation that suits their unique situation. Though we advocate transparency and publicly accessible data, this may not be practical for all data types and thoughtful action must be taken when handling sensitive datasets.
Coming together around a single development environment that works for most parties will increase efficiency and minimize pain points in the development process by ensuring that team members feel that they are able to contribute and understand the scripts being shared that concern their work. This also increases flexibility, so that the IEA team can adapt to new projects. Project development workflows, with standardized directory structures containing unique locations for data, processing and analytical scripts, and output documents will greatly enhance productivity (Wickham and Grolemund Citation2016; Lowndes et al. Citation2017). These practices will address challenges in “starting over” for each application of the IEA process. Striving to ensure that scripts run as seamlessly as possible across team member operating systems, such as through the use of relative working directories [e.g., the here package for R (Müller Citation2017)] and version control, will also improve iterating through the IEA loop. An effective first step for shifting toward the use of open science principles as a team would be to participate in a data literacy workshop (e.g., Software Carpentry series).
Call to action
As emphasized previously, we have intentionally avoided being overly prescriptive in our support for open science principles within the IEA process. IEA is meant to be a flexible and adaptable framework that can be tailored to the continuously changing needs of each region. The principles of open data science that we discussed above can bring efficiency and transparency to a process that otherwise may become unwieldy due to the large number of contributors, datasets, and stakeholders involved.
Many of the IEA scientific workflows in place today were built incrementally, and we advocate for this approach when establishing new workflows based on open science principles. To get started, we suggest three relatively simple action items. First, prior to beginning a new IEA, choose a single development environment for the group to learn and work in (e.g., R with R Markdown). Second, establish and adhere to project development workflows that promote collaboration and openness; for example, Git with Github. Finally, advocate for group participation in a data literacy workshop or other technical training (Wilson Citation2006; Lowndes et al. Citation2017). These initial steps will help get groups engaged with and (hopefully) excited about open science techniques.
Each regional IEA team applies open science principles differently, and though the scientific workflow is unifying throughout, its implementation is varied and constantly improving. While there is an upfront cost to learning new technical skills and becoming familiar with the programs discussed in this article, we suggest that the return on this investment will be worth it. The reproducibility and efficiency gained through applying open science principles is valuable and increasingly standard practice across a wide variety of disciplines. Adoption of open science tools and principles to support IEAs across the US has dramatically increased the IEA practitioners’ efficiency as the need to produce informative, up-to-date, and usable products can be met faster by the application of these principles. The rapid product turnaround and the highly collaborative nature of IEAs make open science extremely useful in advancing the implementation of EBM.
References
- Baumer, B., M. Cetinkaya-Rundel, A. Bray, L. Loi, and N. J. Horton. 2014. R Markdown: Integrating a reproducible analysis tool into introductory statistics. arXiv:1402.1894.
- Biedron, I. S., and B. A. Knuth. 2016. Toward shared understandings of ecosystem-based fisheries management among fishery management councils and stakeholders in the U.S. Mid-Atlantic and New England regions. Marine Policy 70:40–48. https:/doi.org/10.1016/j.marpol.2016.04.010.
- Bond, N. A., M. F. Cronin, H. Freeland, and N. Mantua. 2015. Causes and impacts of the 2014 warm anomaly in the NE Pacific. Geophysical Research Letters 42 (9):3414–20. 10.1002/2015GL063306.
- Breslow, S. J., B. Sojka, R. Barnea, X. Basurto, C. Carothers, S. Charnley, S. Coulthard, N. Dolšak, J. Donatuto, C. García-Quijano, et al. 2016. Conceptualizing and operationalizing human wellbeing for ecosystem assessment and management. Environmental Science & Policy 66:250–9. 10.1016/j.envsci.2016.06.023.
- Chacon, S., and B. Straub. 2014. Pro Git. Apress. doi: 10.1007/978-1-4842-0076-6..
- Christensen, V., and C. J. Walters. 2004. Ecopath with Ecosim: Methods, capabilities and limitations. Ecological Modelling 172 (2–4):109–39.
- Decker, D. J., C. C. Krueger, R. A. Baer, Jr., B. A. Knuth, and M. E. Richmond. 1996. From clients to stakeholders: A philosophical shift for fish and wildlife management. Human Dimensions of Wildlife 1 (1):70–82.
- Degnbol, P., and A. Jarre. 2004. Review of indicators in fisheries management – A development perspective. African Journal of Marine Science 26 (1):303–26. 10.2989/18142320409504063.
- Goethel, D. R., Lucey, S. M. A. M. Berger, S. K. Gaichas, M. A. Karp, P. D. Lynch, J. F. Walter, I. I. I. J. J. Deroba, S. Miller, and M. J. Wilberg. 2019. Closing the feedback loop: On stakeholder participation in management strategy evaluation. Canadian Journal of Fisheries and Aquatic Sciences 76 (10):1895–913.
- Halpern, B. S., C. Longo, D. Hardy, K. L. McLeod, J. F. Samhouri, S. K. Katona, K. Kleisner, S. E. Lester, J. O'Leary, M. Ranelletti, et al. 2012. An index to assess the health and benefits of the global ocean. Nature 76 (10):1895–913. doi: 10.1038/nature11397..
- Hampton, S. E., S. S. Anderson, S. C. Bagby, C. Gries, X. Han, E. M. Hart, M. B. Jones, W. C. Lenhardt, A. MacDonald, W. K. Michener, et al. 2015. The Tao of open science for ecology. Ecosphere 6 (7):1–13.
- Hardison, S., and K. Bastille. 2018. Ecodata: Documentation of ecosystem indicator reporting. https://noaa-edab.github.io/ecodata/landing_page (last accessed November 17, 2020).
- Harvey, C. J., C. R. Kelble, and F. B. Schwing. 2017. Implementing ‘the IEA’: using integrated ecosystem assessment frameworks, programs, and applications in support of operationalizing ecosystem-based management. ICES Journal of Marine Science 74 (1):398–405. 10.1093/icesjms/fsw201.
- Hazen, E. 2018. EcoCast. GitHub repository. GitHub. https://github.com/elhazen/EcoCast (last accessed November 17, 2020).
- Heemskerk, M., K. Wilson, and M. Pavao-Zuckerman. 2003. Conceptual models as tools for communication across disciplines. Conservation Ecology 7 (3). 10.5751/ES-00554-070308.
- Hunter, J. D. 2007. Matplotlib: A 2D graphics environment. Computing in Science & Engineering 9 (3):90–95.
- Kearney, K. A. 2017. ecopath_matlab: A Matlab-based implementation of the Ecopath food web algorithm. Journal of Open Source Software 2 (9). 10.21105/joss.00064.
- Kluyver, T., B. Ragan-Kelley, F. Pérez, B. E. Granger, M. Bussonnier, J. Frederic, K. Kelley, J. Hamrick, J. Grout, S. Corlay, et al. 2016. Jupyter Notebooks-A publishing format for reproducible computational workflows. In ELPUB, 87–90. https://www.semanticscholar.org/paper/Jupyter-Notebooks-a-publishing-format-for-workflows-Kluyver-Ragan-Kelley/e47868841d87efe261451a43b00d6c81cf7fb7a3.
- Levin, P. S., C. R. Kelble, R. L. Shuford, C. Ainsworth, Y. deReynier, R. Dunsmore, M. J. Fogarty, K. Holsman, E. A. Howell, M. E. Monaco, et al. 2014. Guidance for implementation of integrated ecosystem assessments: A US perspective. ICES Journal of Marine Science 71 (5):1198–204. 10.1093/icesjms/fst112.
- Levin, P. S., M. J. Fogarty, S. A. Murawski, and D. Fluharty. 2009. Integrated ecosystem assessments: Developing the scientific basis for ecosystem-based management of the ocean. PLoS Biology 7 (1):e1000014. 10.1371/journal.pbio.1000014.
- Levin, P. S., S. J. Breslow, C. J. Harvey, K. C. Norman, M. R. Poe, G. D. Williams, and M. L. Plummer. 2016. Conceptualization of social-ecological systems of the California current: An examination of interdisciplinary science supporting ecosystem-based management. Coastal Management 44 (5):397–408. 10.1080/08920753.2016.1208036.
- Levin, P., M. Fogarty, G. Matlock, and M. Ernst. 2008. Integrated ecosystem assessments. NOOA NMFS-NWFSC-92. https://www.nwfsc.noaa.gov/assets/25/796_07302008_144647_IEA_TM92Final.pdf (last accessed November 17, 2020).
- Lewison, R., A. J. Hobday, S. Maxwell, E. Hazen, J. R. Hartog, D. C. Dunn, D. Briscoe, S. Fossette, C. E. O'Keefe, M. Barnes, et al. 2015. Dynamic ocean management: Identifying the critical ingredients of dynamic approaches to ocean resource management. BioScience 65 (5):486–98. 10.1093/biosci/biv018.
- Lowndes, J. S. S., B. D. Best, C. Scarborough, J. C. Afflerbach, M. R. Frazier, C. C. O’Hara, N. Jiang, and B. S. Halpern. 2017. Our path to better science in less time using open data science tools. Nature Ecology & Evolution 1 (6):0160.
- Lowndes, J. S. S., E. J. Pacheco, B. D. Best, C. Scarborough, C. Longo, S. K. Katona, and B. S. Halpern. 2015. Best practices for assessing ocean health in multiple contexts using tailorable frameworks. PeerJ. 3:e1503. doi: 10.7717/peerj.1503.
- Lucey, S. M., S. K. Gaichas, and K. Y. Aydin. 2020. Conducting reproducible ecosystem modeling using the open source mass balance model Rpath. Ecological Modelling 427:109057. 10.1016/j.ecolmodel.2020.109057.
- Ma, X., P. Fox, C. Tilmes, K. Jacobs, and A. Waple. 2014. Capturing provenance of global change information. Nature Climate Change 4 (6):409–13. 10.1038/nclimate2141.
- Ma, X., S. E. Beaulieu, L. Fu, P. Fox, M. D. Stefano, and P. West. 2018. Documenting provenance for reproducible marine ecosystem assessment in open science. In Information Retrieval and Management: Concepts, Methodologies, Tools, and Applications, 1051–77. IGI Global.
- McKiernan, E. C., P. E. Bourne, C. T. Brown, S. Buck, A. Kenall, J. Lin, D. McDougall, B. A. Nosek, K. Ram, C. K. Soderberg, et al. 2016. Point of view: How open science helps researchers succeed. eLife 5:e16800.
- Michener, W. K., and M. B. Jones. 2012. Ecoinformatics: Supporting ecology as a data-intensive science. Trends in Ecology & Evolution 27 (2):85–93. doi: 10.1016/j.tree.2011.11.016.
- Michener, W. K., S. Allard, A. Budden, R. B. Cook, K. Douglass, M. Frame, S. Kelling, R. Koskela, C. Tenopir, and D. A. Vieglais. 2012. Participatory design of DataONE enabling cyberinfrastructure for the biological and environmental sciences. Ecological Informatics, Data Platforms in Integrative Biodiversity Research 11:5–15. 10.1016/j.ecoinf.2011.08.007.
- Müller, K. 2017. Here: A simpler way to find your files. https://github.com/krlmr/here (last accessed November 17, 2020).
- National Marine Sanctuaries. 2019. Channel Islands National Marine sanctuary 2016 condition report. U.S. Department of Commerce, National Oceanic; Atmospheric Administration, Office of National Marine Sanctuaries. https://sanctuaries.noaa.gov/science/condition/cinms/welcome.html (last accessed November 17, 2020).
- NEFSC. 2012. Ecosystem status report for the northeast shelf large marine ecosystem-2011. In US Dept Commer, Northeast Fish Sci Cent Ref Doc.12-07, ed. Ecosystem Assessment Program. Woods Hole, MA: National Marine Fisheries Service. http://www.nefsc.noaa.gov/nefsc/publications/.
- NEFSC. 2015. Ecosystem Assessment Program. Northeast Fisheries Science Center ecosystem considerations. NEFSC. http://www.nefsc.noaa.gov/ecosys/ (last accessed November 17, 2020).
- NOAA-EDAB. 2020. Technical documentation, state of the ecosystem. doi:10.25923/4tdk-eg57 (last accessed November 17, 2020).
- Northeast Fisheries Science Center. 2020a. State of the Ecosystem 2020: Mid-Atlantic. Northeast Fisheries Science Center. doi:10.25923/1f8j-d564 (last accessed November 17, 2020).
- Northeast Fisheries Science Center. 2020b. State of the Ecosystem 2020: New England. Northeast Fisheries Science Center. doi:10.25923/4tdk-eg57 (last accessed November 17, 2020).
- Pacific Fishery Management Council. 2017. Annual State of the California Current Ecosystem. Accessed November 6, 2018. https://www.pcouncil.org/ecosystem-based-management/annual-state-of-the-california-current-ecosystem/.
- Pavao-Zuckerman, M. 2000. The conceptual utility of models in human ecology. Journal of Ecological Anthropology 4 (1):31–56. 10.5038/2162-4593.4.1.2.
- Ram, K. 2013. Git can facilitate greater reproducibility and increased transparency in science. Source Code for Biology and Medicine 8 (1):7. doi: 10.1186/1751-0473-8-7.
- Samhouri, J. F., A. J. Haupt, P. S. Levin, J. S. Link, and R. Shuford. 2014. Lessons learned from developing integrated ecosystem assessments to inform marine ecosystem-based management in the USA. ICES Journal of Marine Science 71 (5):1205–15. 10.1093/icesjms/fst141.
- Samhouri, J. F., E. Ramanujam, J. J. Bizzarro, H. Carter, K. Sayce, and S. Shen. 2019. An ecosystem-based risk assessment for California fisheries co-developed by scientists, managers, and stakeholders. Biological Conservation 231:103–21.doi.org/10.1016/j.biocon.2018.12.027.
- Seagraves, R. 2016. Mid-atlantic fishery management council. http://www.mafmc.org/s/EAFM_Guidance-Doc_2017-02-07.pdf (last accessed November 17, 2020).
- Shampine, L. F., and M. W. Reichelt. 1997. The Matlab Ode suite. SIAM Journal on Scientific Computing 18 (1):1–22.
- Sherman, K., and A. M. Duda. 1999. Large marine ecosystems: An emerging paradigm for fishery sustainability. Fisheries 24 (12):15–26.
- Simons, R. A. 2019. ERDDAP. Monterey, CA: NOAA/NMFS/SWFSC/ERD. https://coastwatch.pfeg.noaa.gov/erddap (last accessed November 17, 2020).
- Weijerman, M., J. M. Gove, I. D. Williams, W. J. Walsh, D. Minton, and J. J. Polovina. 2018. Evaluating management strategies to optimise coral reef ecosystem services. Journal of Applied Ecology 55 (4):1823–33. 10.1111/1365-2664.13105.
- Welch, H. 2018. GitHub Repository. GitHub. https://github.com/HeatherWelch/EcoCast_Operationalization (last accessed November 17, 2020).
- Wickham, H. 2016. Ggplot2: Elegant graphics for data analysis. Use R! New York: Springer International Publishing. https://books.google.com/books?id=RTMFswEACAAJ (last accessed November 17, 2020).
- Wickham, H., and G. Grolemund. 2016. R for data science: Import. Tidy, transform, visualize, and model data. 1st ed. Sebastopol, CA, USA: O’Reilly Media, Inc.
- Wilkinson, L. 2012. The grammar of graphics. In Springer handbooks of computational statistics, ed. J. E. Gentle, W. K. Härdle, and Y. Mori. Berlin, Heidelberg: Springer. 10.1007/978-3-642-21551-3_13.
- Wilkinson, M. D., M. Dumontier, I. J. J. Aalbersberg, G. Appleton, M. Axton, A. Baak, N. Blomberg, J.-W. Boiten, L. B. da Silva Santos, P. E. Bourne, et al. 2016. The fair guiding principles for scientific data management and stewardship. Scientific Data 3:160018. doi: 10.1038/sdata.2016.18.
- Wilson, G. 2006. Software carpentry: Getting scientists to write better code by making them more productive. Computing in Science & Engineering 8 (6):66–69.
- Yenni, G. M., E. M. Christensen, E. K. Bledsoe, S. R. Supp, R. M. Diaz, E. P. White, and S. K. M. Ernest. 2019. Developing a modern data workflow for regularly updated data. PLOS Biology 17 (1):e3000125. 10.1371/journal.pbio.3000125.
- Zador, S. G., K. K. Holsman, K. Y. Aydin, and S. K. Gaichas. 2017. Ecosystem considerations in Alaska: The value of qualitative assessments. ICES Journal of Marine Science 74 (1):421–30.