?Mathematical formulae have been encoded as MathML and are displayed in this HTML version using MathJax in order to improve their display. Uncheck the box to turn MathJax off. This feature requires Javascript. Click on a formula to zoom.
Abstract
The coastal zone of mainland Portugal is characterized by its morpho-sedimentary diversity such as estuaries, lagoons, barrier islands, beaches, dunes and cliffs. The high population density and the multiplicity of land use, occupation and activities, makes it an area of great national strategic value. This transforms the coastal zone into a multi-hazard zone, where the occurrences related to coastal flooding and overtopping stand out. In the present work, a multidimensional methodology called Coastal Territorial Vulnerability Index (CTVI) was developed and applied in three selected areas with a historical record of coastal impacts, to analyze, evaluate and interpret the local vulnerability. The methodology considers four components of coastal territorial vulnerability: morphology, land value, buildings and public areas characteristics. These four components are combined to calculate the CTVI. The results highlight the differences for the analyzed areas, allowing the differentiation of natural and artificial areas. In the natural areas a moderate CTVI predominates, while in the latter, a high and very high CTVI stands out. The results contribute to the development of a comprehensive coastal flood risk assessment and forecasting the impacts.
Introduction
A coastal zone is characterized by its dynamics, complexity and constant interactions between the terrestrial and oceanic systems, where changes occur on different temporal and spatial scales (Ponte Lira et al. Citation2016). The damage and impacts associated with natural hazards in coastal zones have increased worldwide in recent decades (Sekovski, Del Río, and Armaroli Citation2020). The expected SLR (sea level rise) and increase in the frequency and intensity of extreme weather events (Bertin et al., Citation2013), combined with the increase in social and economic exposure to coastal flooding (Neumann et al. Citation2015), could exacerbate the damage and impacts related to natural hazards in coastal areas (Neumann et al. Citation2015). Without mitigation and adaptation measures, the current figure of 1.4 billion euros for annual damages associated with coastal flooding in the European Union (EU) could increase to almost 240 billion euros by 2100 (Vousdoukas et al. Citation2020).
According to the IOC (2020), 40% of the world’s population is located within 100 km of the coastline, where 10% (600 million people) live in coastal zone areas with an elevation of less than 10 m above the mean sea level (MSL). In the EU, approximately 42% of the total population lives in coastal regions (Iglesias-Campos, et al. Citation2015) and it is estimated that by the year 2050 this number will have increased by 24%, with significant spatial variability (Forzieri, et al. Citation2017). In Portugal, where the risk of SLR is high (Antunes and Taborda Citation2009; Rocha, Antunes, and Catita Citation2020), 75% of the population and 80% of the GDP are located in the coastal municipalities (Santos et al. Citation2017).
In recent decades, several methods for analyzing coastal vulnerability have been developed on different scales, either presenting new approaches or adapting the existing ones. According to Anfuso et al. (Citation2021) the methodological sets can be grouped into four clusters: “1) index/indicators-based methods, 2) methods based on dynamic computer models, 3) GIS-based decision support tools, 4) visualization tools”. The scale of analysis and the characteristics of the area influence the indicators that should be taken into account in the different approaches. Over the years, an increasing number of indicators have been used, due to the need to carry out multi-hazard analyses and assessments. (Viavattene et al. Citation2018). The most widely used coastal vulnerability assessment methodology is the Coastal Vulnerability Index (CVI) (Gornitz et al. Citation1994), applied and adapted by several authors over time (Pendleton et al. Citation2004; Boruff, Emrich, and Cutter Citation2005; Doukakis Citation2005; Koroglu et al. Citation2019). Other methodological approaches have been developed, namely by Nicholls et al. (Citation2008), McLaughlin and Cooper (Citation2010), Rangel-Buitrago and Anfuso (Citation2015). Recently, studies related to climate change and its impacts have also been developed (Giardino, Nederhoff, and Vousdoukas Citation2018; Kiat et al., Citation2019). For Portugal, different (national and local scale) analyses for evaluating vulnerability and coastal risks (coastal erosion, coastal flooding and overtopping) have been developed by Ceia et al. (Citation2010), Martins, Pires, and Cabral (Citation2012), Silva et al. (Citation2017), Rocha, Antunes, and Catita (Citation2020) and Ferreira et al. (Citation2021). These studies present some aspects similar to the methodology presented in this study, evident in the selected variables essentially related to physical aspects (e.g., average slope, distance to coastline, geological materials). However, this study differs in terms of the diversity of the variables considered, with a special emphasis on those related to buildings and public areas.
The study is motivated by the need to enhance the assessment of coastal vulnerability to flooding on a local scale through the use of multilayer variables. In this approach, coastal vulnerability is calculated on the basis of a composite index that aggregates the different dimensions of vulnerability within a given territory, namely its morphological, social, structural, economic, functional and land use characteristics. In applying this methodology, the authors intend to break with the logic of top-down processes present in many methodologies used to assess coastal vulnerability (Satta Citation2014), instead presenting a bottom-up methodological approach to territorial vulnerability assessment supported by a local scale of analysis and the fieldwork campaigns carried out by a multidisciplinary team in the different study areas. The database presented in Tavares et al. (Citation2021) was also relevant to developing a local understanding of the dynamics associated with the different occurrences of flooding and coastal overtopping and their respective impacts. Finally, the process of selecting and attributing weights to the different variables, carried out by the multidisciplinary team, should be highlighted. Involving intensive discussion, the information obtained from the fieldwork and database was relevant to the selection process, thus allowing for the appropriate selection and weighting of the different variables while taking specific local features into account.
The main objectives of this study are to: a) analyze and evaluate each study area, its open spaces and, in the case of buildings, the type of occupancy and functions; b) map the different dimensions of coastal vulnerability under analysis; c) calculate the four dimensions of vulnerability and the composite index known as the Coastal Territorial Vulnerability Index (CTVI); d) analyze and compare the results for the different study areas. The article is divided into five sections, beginning with a characterization of the coastal zone of mainland Portugal and the three study areas, followed by a description of the methodological approach of the Coastal Territorial Vulnerability Index (CTVI) and the four associated components. The results for each study area are then presented, referring to the different components of vulnerability and the composite index CTVI. Finally, the results and the conclusions are discussed, highlighting the relevance of the CTVI methodology for obtaining a comprehensive local coastal flood risk assessment.
Characterization of the study area
General framework
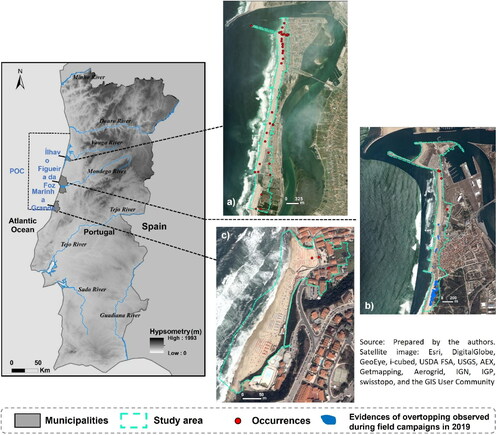
The Portuguese coast extends approximately 987 km from the mouth of the Minho River to the mouth of the Guadiana River (). This extensive coastal zone is divided into two sectors: a) the western coast, characterized by high energetic waves with a dominant north-west swell, resulting in a high sediment transport capacity (Andrade and Freitas Citation2002), and b) the south coast, which has a more moderate wave energy as it is protected from the northwest swell (Ferreira and Matias Citation2013). The Portuguese coastline presents a wide range of geomorphologic features, namely beaches and dunes, high cliffs and low-lying rocky shores, coastal lagoons and barrier islands (Ponte Lira et al. Citation2016). In the last seven decades, the coastal zone has been subjected to greater anthropic pressure due to urbanization, the growth of tourism and the concentration of the main national economic activities (Santos et al. Citation2017). According to Tavares et al. (Citation2021), between 1980 and 2018 over 650 occurrences of coastal flooding and overtopping were identified () with a high level of temporal and spatial variability. In terms of management, the Portuguese coast is divided into six stretches, each with its own Coastal Management Plan (POC): three of the plans have been finalized and the remainder is in preparation. The three study areas are part of the Ovar-Marinha Grande POC, operative since 2017. These national management plans aim to improve the quality and sustainable use of coastal zones and are intended to serve as instruments which address and also correct the problems affecting coastal zones (Marinho et al. Citation2019).
Figure 1. Framework for the study areas located on the west coast of mainland Portugal and included in the Coastal Management Plan (POC).
Study areas
The methodological approach was applied in three study areas located on the western coast of mainland Portugal and covered by the coastal section of the Ovar-Marinha Grande POC (). This coastal stretch is mainly characterized by a low-lying open sandy shoreline backed by dunes that are badly damaged and destroyed in some sections (Coelho et al. Citation2009), but also includes some stretches with coastal cliffs and others with protection structures. It is an area defined by a very energetic wave regime resulting in an intense N-S longshore drift which, combined with a significant deficit of sediment supply, results in considerable rates of shoreline retreatment ranging from 0.2 to 8.0 m/year in the past 50 years, (Ponte Lira eta al., 2016).
The lhavo coastal area
This study zone corresponds to a part of the coast of the municipality of lhavo which includes Barra and Costa Nova, comprising an area of 140 hectares (ha) (). It is defined by its proximity to the Aveiro lagoon and Aveiro harbor breakwaters, which negatively influence the entire coastal sector south of the area due to longshore drift retention. It is characterized by a low-lying sandy beach with a fragile dune system which, according to Pereira et al. (Citation2013), makes it an area susceptible to flooding and erosion. Tavares et al. (Citation2021) identify 59 occurrences of coastal flooding and overtopping in the study area between 1980 and 2018. The POC report (APA Citation2015) states that between 1958 and 2010 there was an average decrease, due to erosion, of −3.6 m/year, which translates into an average total decrease of −166.5 m. There have been several interventions in recent decades to protect natural resources and the existing urban fronts, involving the construction of five groins and two alongshore defence structures. In terms of exposed elements, the site presents relatively homogeneous use and occupation, expressed in residential and commercial areas. The Census statistical blocks that cover the study area account for 471 inhabitants, highlighting the high season population, not only during the summer months, but also at weekends.
The Cova Gala coastal area
Cova Gala is located in the municipality of Figueira da Foz south of the south jetty on the mouth of the Mondego River, which also includes Cabedelo and covers an area of 72 ha (). This area is characterized by a sandy beach-dune system which is approximately 2 km long and has a history of shoreline retreat and coastal erosion. In recent decades, the area has been altered by several human interventions that have modified its characteristics and dynamics (Freire, Oliveira, and Oliveira Citation2020), namely the construction of five groins and four longshore defence structures. Oliveira (Citation2015) concluded that a limited erosional trend can be observed on the northern Cova Gala seafront, together with a recovery trend between 1978 and 2011 as a result of the various defensive and restoration interventions. Consequently, Tavares et al. (Citation2021) identify a total of only 4 occurrences of coastal flooding and overtopping. The opposite trend is observed downdrift of the last groin of the Cova Gala groin field, where an increase in the erosive process can be observed for the same period. During the maritime winter 2018-2019, geotextile tubes were applied south of the southernmost groin to reinforce the dune. With regard to exposed elements, the area has a heterogeneous typology ranging from residential areas, a camping site, a hospital, cafés, restaurants, surf schools, car parks and fishery infrastructures. The three statistical blocks that cover the Cova Gala area record a total of 1,363 inhabitants. The present population fluctuates considerably between the summer months (June to September) and the rest of the year.
The São Pedro de Moel area
São Pedro de Moel is located in the municipality of Marinha Grande and covers an area of 4.8 ha (). Geomorphologically, it differs from the above-mentioned areas, consisting of an embedded narrow beach which is approximately 400 m long, situated between two active cliffs of consolidated rocks with heights varying from 20 to 40 meters. The cliffs exhibit instability and toppling processes. The beach is also characterized by the presence, at both ends, of low rocky outcrops that are alternately covered by sand and uncovered during the year. The backshore is bounded by a seawall and an alongshore defence structure. Tavares et al. (Citation2021) identify a total of 3 occurrences, with diverse impacts. In terms of exposed elements, there is less diversity in comparison to the other study areas. The São Pedro de Moel beach area mainly comprises vacant residential buildings, cafés, restaurants and a public square. The two statistical blocks that cover the area record a total of 206 inhabitants, with a huge increase during the summer months.
Data and methods
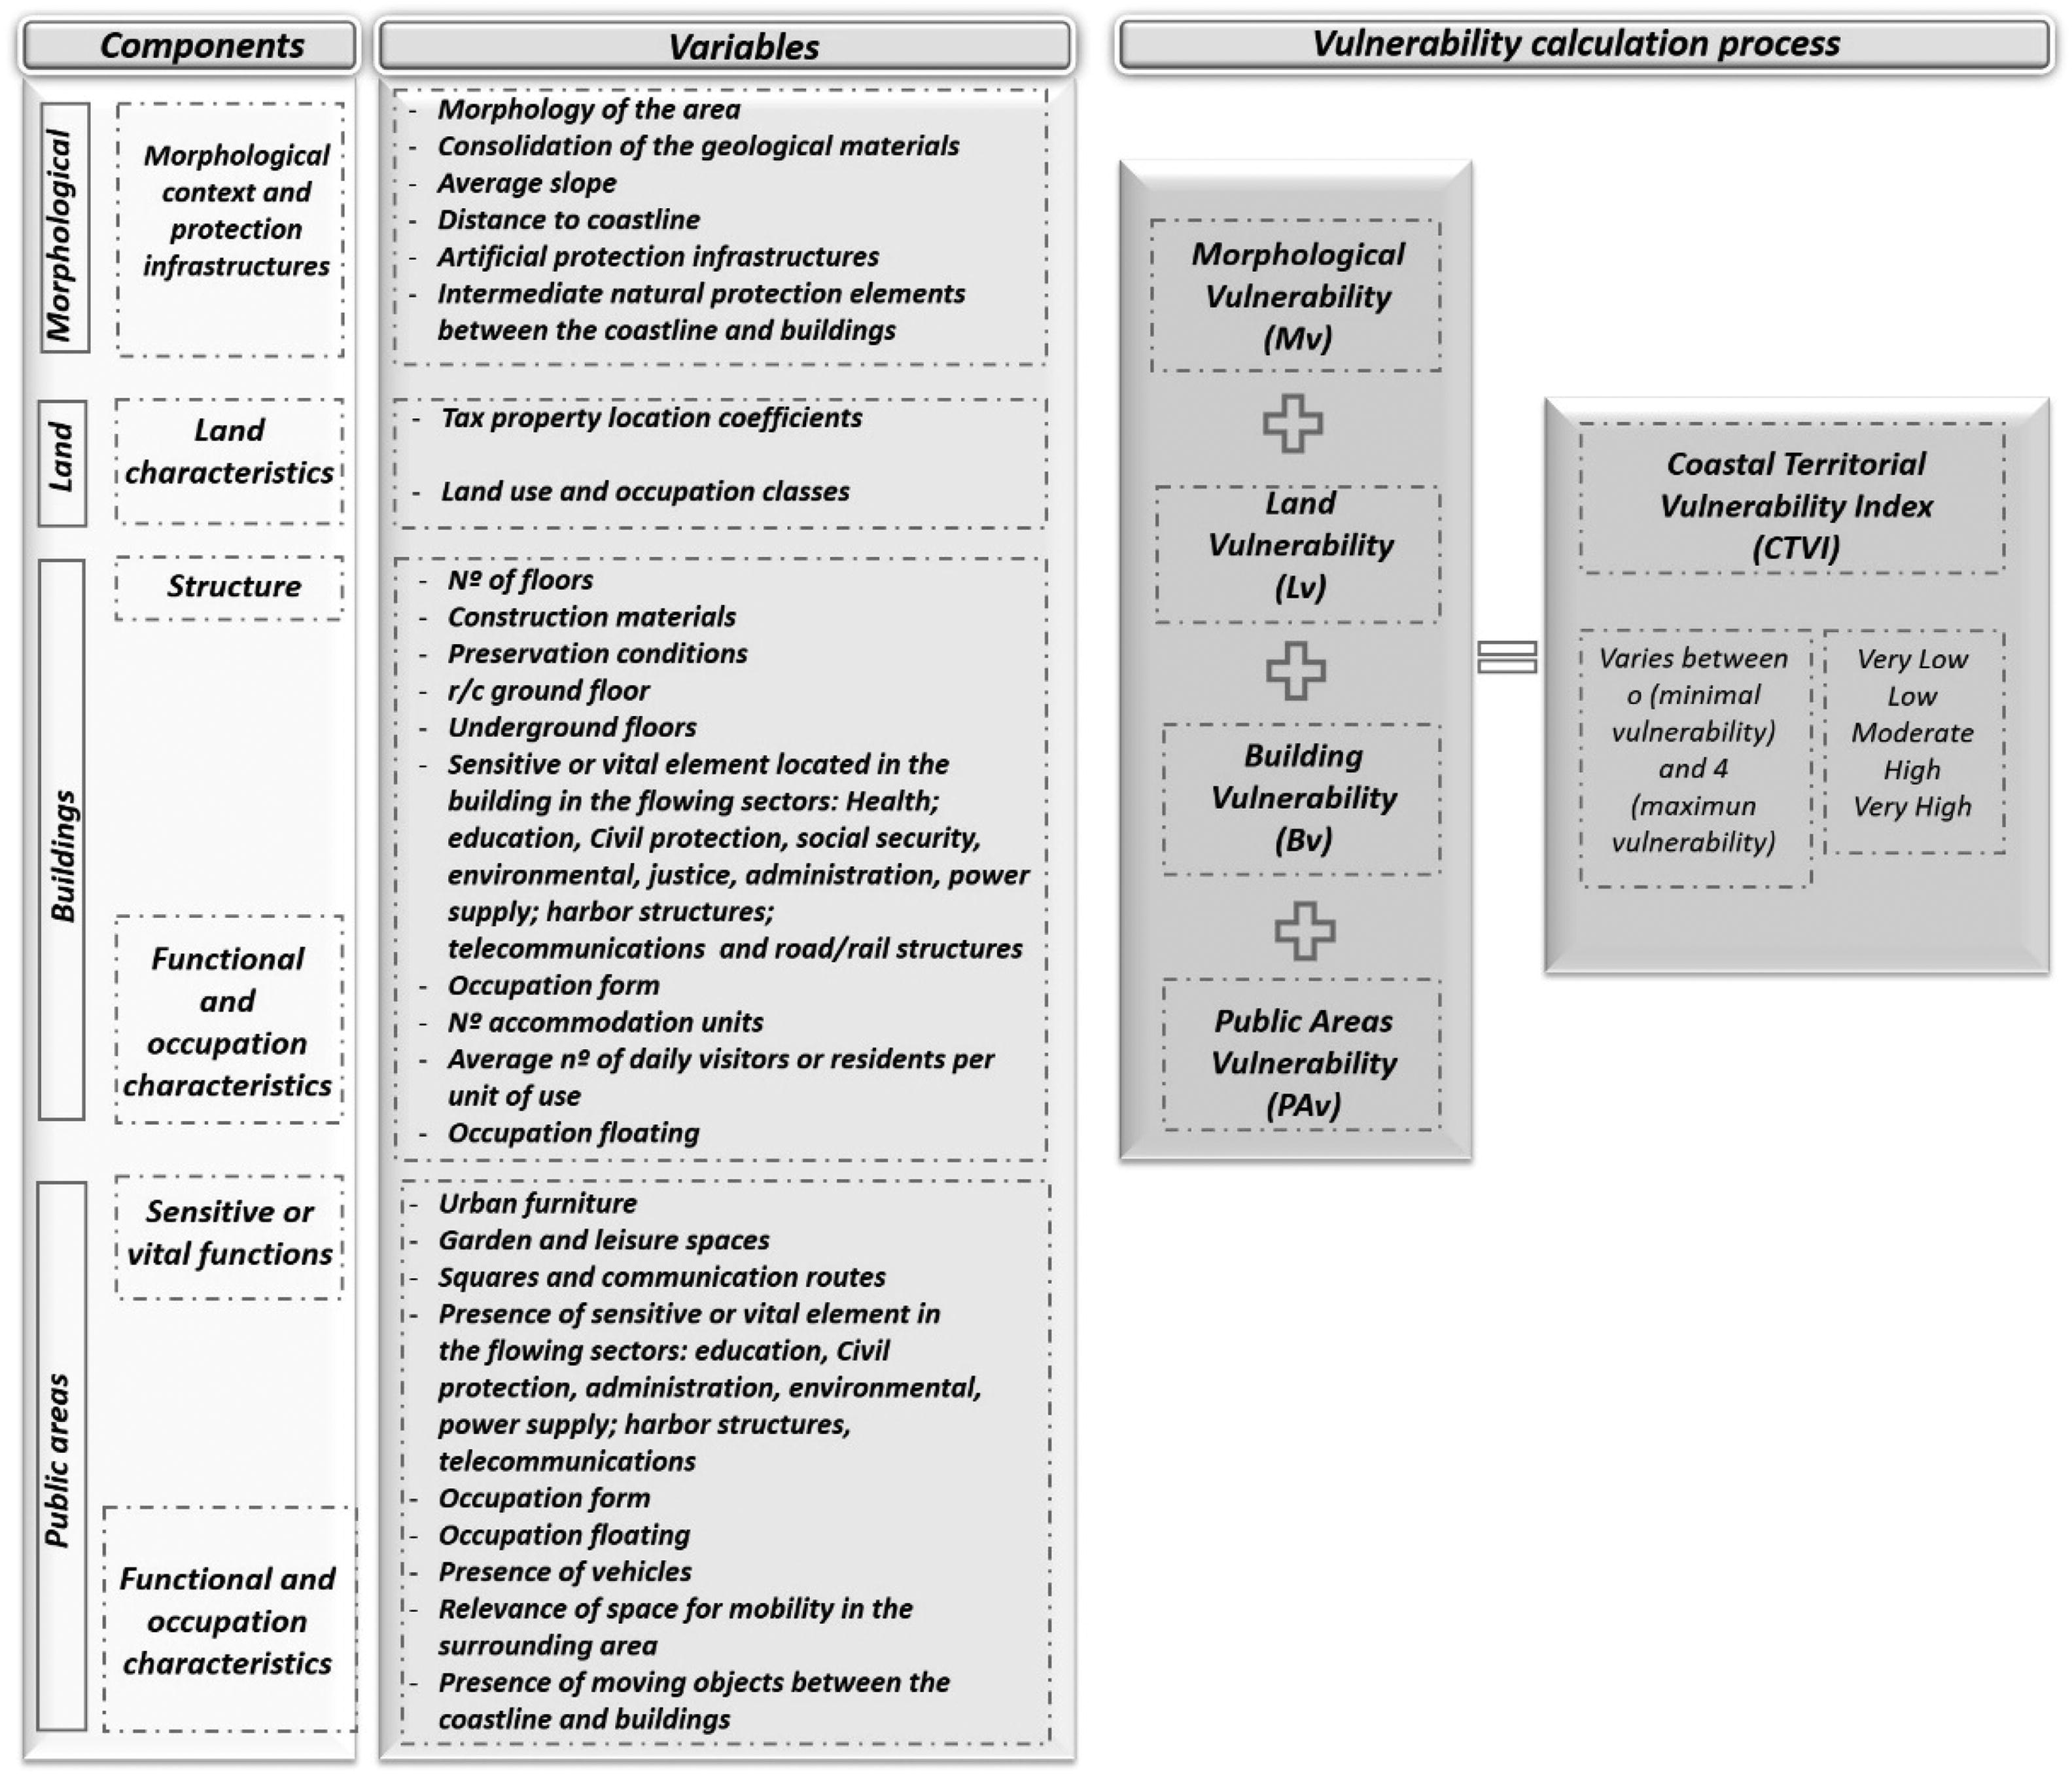
The methodology presented in this study, known as the Coastal Territorial Vulnerability Index (CTVI), is a multidimensional approach that results from the analysis and evaluation of four components associated with morphology, land value, buildings and public areas.
Before presenting the base variables for the CTVI calculation, certain key concepts in the field of risk sciences should be clarified. Vulnerability and risk are concepts with multiple definitions and, consequently, multiple assessment methods (Aven and Renn Citation2010; Aven Citation2012). However, the definitions presented in Julião et al. (Citation2009) allow for a standardization of concepts. On this basis, vulnerability is understood as the degree of loss of an element or set of exposed elements as a result of the occurrence of a natural, technological or mixed process (or action) of a certain severity. Hazard is considered to be a natural, technological or mixed process that can result in losses and damages. Susceptibility is the spatial incidence of the hazard, without considering the probability of occurrence, and is evaluated through its predisposing factors. Risk is defined as the probability of the occurrence of a hazardous process (or action) and the estimated consequences for people, property or the environment, expressed as personal injury and/or material and functional losses.
Selection of variables
In total, 33 variables were considered and analyzed (). The selection of variables was based on a literature review () and a consideration of expert opinion. In this regard, the fieldwork carried out by the Mosaic.pt project team (which resulted in a set of reports available at http://mosaic.lnec.pt) and the scientific knowledge of its multidisciplinary team, which contributed to the discussion and selection process for the most appropriate variables for the present study, should be highlighted. The CTVI methodology is distinguished by its local scale analysis, comprehensiveness and multidisciplinary approach and by the fact that it takes occupancy and functional aspects into consideration, in relation to buildings and public spaces located in the study areas. The values of each attribute vary between +1 and −1. Positive values represent an increase in vulnerability and negative values represent a decrease in vulnerability. When it only has an influence on increasing vulnerability, the rating varies from +1 to 0. The variables considered in each component do not contribute to the calculation of the vulnerability in the same way, but have different influences. The choice of the value assigned to each variable resulted from the analysis of a wide range of literature, as well as discussion between the different experts in the Mosaic.pt project team. In order to consider these differences, weights were assigned to each variable, using the M-Macbeth® multicriteria analysis software (Costa, Carlos, and Vansnick Citation1999; Bana, Costa, and Chargas Citation2004). The choice of this method was based on the fact that it allows the attractiveness or value of options to be measured through a non-numerical pairwise comparison questioning mode based on seven qualitative categories (CO to C6) of difference in attractiveness, ranging from no difference (C0) to very weak (C1), weak (C2), moderate (C3), strong (C4), very strong (C5), or extreme (C6) difference. The main differentiating feature is that Macbeth only uses such qualitative judgments of difference in attractiveness to generate, by mathematical programming, value scores for options and weights for criteria (Costa, Carlos, and Vansnick Citation1999). These weights were calculated via pairwise matches between each of the factors (). The pairwise matches comparison, using the software, was performed by the authors according to the previous fieldwork and taking the opinions of the different specialists in the Mosaic.pt project team into account. In the hierarchical analysis process for determining the weighting coefficients of each parameter, an upper limit corresponding to the value “100” is established, and a lower limit corresponding to the value “0”.
Figure 2. Vulnerability assessment variables, attributes and weightings. (Colour figure).
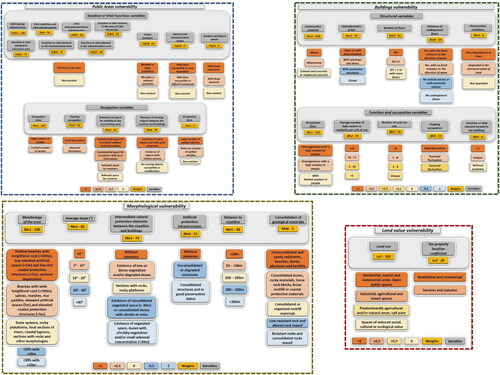
Figure 3. Morphological vulnerability assessment in the study areas.
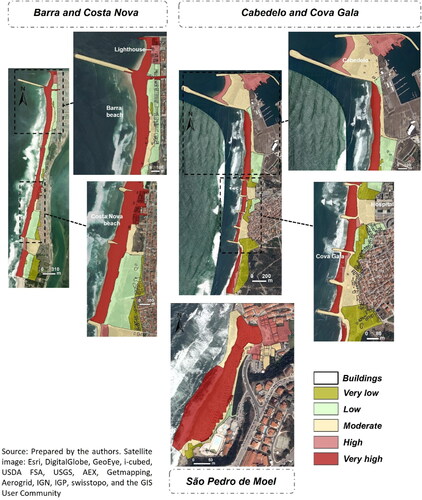
Table 1. Coastal vulnerability variables used in different methodologies.
In each of the three selected locations, area delimitation always follows the precautionary principle, complemented by the history of flood and overtopping occurrences between 1980-2018 (Tavares et al. Citation2021), field data and information collected from local authorities and residents.
The relevance of each variable within the vulnerability indexes is well covered in the literature (cf. ). With regard to the morphological component, areas with lower beaches and less artificial protection are more vulnerable, whereas the existence of dune systems, coastal protection and cliffs helps to reduce vulnerability. In relation to slope, territorial features in flat areas are more prone to damage from coastal flooding than features located in steeper ground. In terms of coastal protection, the absence of either natural or artificial protection is considered to contribute to increased vulnerability, while consolidated vegetated spaces, conserved dune systems or well-preserved consolidated artificial infrastructures help to reduce vulnerability. Distance to the coastline is an important factor, as vulnerability increases with proximity to the shoreline. Finally, regarding the consolidation of geological materials, vulnerability varies in inverse proportion to consolidation: beaches and dunes affected by erosion, for example, present high vulnerability, while resistant and consolidated rocks are less susceptible to flooding and consequently less vulnerable.
With regard to the land use variable, higher vulnerability is assigned to classes of land use associated with greater economic, social, cultural and ecological value. In terms of the property tax location coefficients, based on the Municipal Property Tax (IMI), higher IMI (residential or commercial) coefficients mean that a building has greater potential value and contributes more to the local economy, thus increasing the vulnerability of other coefficients (services and industry).
Building vulnerability considered two groups of variables: a) structural and b) function and occupation. With regard to the structural aspects, more resistant construction materials reduce vulnerability and buildings in a better state of conservation reduce the probability of severe damage. The number of floors is also an important factor in the structural assessment of buildings: it is assumed that buildings with more floors are less vulnerable, since they allow for vertical evacuation of residents and have a more resistant structural system. In addition, the existence of underground floors and their orientation in relation to the coast contribute to vulnerability, as they will be the first floors to be affected in the event of flooding. In hydrodynamics, it is considered that a building with a closed ground floor is less vulnerable than one which has windows or doors, since there is less likelihood of damage. Regarding the variables related to the functionality and occupation of buildings, it is considered that the more heterogeneous the occupation and the greater the number of residents or visitors, the greater the vulnerability. The existence of sensitive or vital elements in the building, such as a police or fire station, must also be considered, as they may not be able to respond to the emergency in the event of flooding.
In terms of the occupation variables for public areas, based on the above logic it appears that vulnerability increases with larger numbers of people and a wider occupation range. Variables related to mobility and the presence of moveable objects are particularly significant. Regarding the former, if the area is important in terms of mobility and there are no alternative routes, it presents greater vulnerability since, in the event of a coastal flood, it will affect local mobility and may contribute negatively to the emergency response process. Concerning the latter, objects of different sizes (e.g., cars, garbage cans) may be swept up by floodwaters, injuring people and damaging property. Hence, the greater the amount and size of the objects, the greater the vulnerability. Finally, it is important to mention the variables related to sensitive or vital functions associated with public areas. From the outset, the existence of critical infrastructures contributes to an increase in vulnerability due to the increased risk of damage, restricted functions or even inoperability. In the remaining variables in this group, the logic for the variable associated with mobile objects applies. Hence, the existence of large moveable items of urban furniture, which may also exist in gardens or leisure spaces, mounted on surfaces made from unconsolidated materials will contribute to increased vulnerability, since they can be swept away in the event of flooding and cause injuries to people and damage to property.
Morphological assessment (Mv)
A total of six variables were considered in the evaluation of the morphological component. Data collection followed the application in the field of a matrix containing the variables, attributes and respective values (). Subsequently, using GIS technology and satellite images, the different variables belonging to the morphological component were vectorized. The values of each attribute vary between +1 and −1 (). After weighting each of the variables and assigning values to each of its attributes, the Morphological vulnerability (Mv) was calculated using the following formula:
(Eq. 1)
(Eq. 1)
in which Mvn is the value assigned to each variable “n” and Wn is the weight assigned to each variable.
After calculating Equation (1), the algorithm shown in Equation (2) (Barros et al. Citation2015; Tavares, Barros, and Santos Citation2017) was used to rescale the values for the interval between 0 and 1:
(Eq. 2)
(Eq. 2)
in which x represents the direct value of the vulnerability, y is the rescaled vulnerability value ranging from 0 to 1, a is the minimum value for the vulnerability of the sample, and b is the maximum value for the sample.
Land value assessment (Lv)
The Land value assessment was carried out using the land use variables and property tax location coefficients (). This coefficient serves as the basis for calculating the Municipal Property Tax/IMI and its value depends on several factors, including accessibility, quality and variety of the road and rail network, access to social facilities such as schools, and the value of the real estate market in the area where the property is located. The property tax location coefficients assess the economic value of buildings (based on the Municipal Property Tax/IMI), the potential value of services, and the value or contribution to the local economy. Consideration of these two variables enables areas to be identified and differentiated according to the established activities, and also improves identification of the various exposed elements. The matrix presents a set of intrinsic attributes for each parameter and provides a value for each attribute, ranging between +1 and 0 (). Different weights are also assigned to each variable for the Lv assessment ().
After weighting each of the variables and assigning values to each of their attributes, the Land value vulnerability (Lv) was calculated using the following formula:
(Eq. 3)
(Eq. 3)
in which Lvn is the value assigned to each variable n and Wn is the weight assigned to each variable. After calculating Equation (3), the algorithm shown in Equation (2) was used to rescale the values for the interval between 0 and 1.
Buildings assessment (Bv)
Ten variables were considered in the evaluation of buildings, divided into two subcomponents used to analyze buildings according to their structural, functional and occupation components. The matrix presents a set of intrinsic attributes for each parameter and provides a value for each attribute, ranging between +1 and −1 (). Many of the previously mentioned methodologies () also include an analysis of buildings, emphasizing the structural component. However, this methodology is distinguished by the introduction of variables related to the function and occupation of buildings, thus allowing for differentiation on the basis of their structural component, but also consideration of the functions and occupation of each one. Data was gathered from fieldwork using GIS technology (ArcGIS 10.2® and Android®). As the assessment building vulnerability is based on two subcomponents, each variable was weighted independently for each of the subcomponents. Building vulnerability is calculated using the following formula (4):
(Eq. 4)
(Eq. 4)
in which Bsn and Bfn are the values assigned to each variable n and Wsn and Wfn are the weights assigned to each variable. After calculating Equation (4), the algorithm shown in Equation (2) was used to rescale the values for the interval between 0 and 1.
Public areas assessment (PAv)
This component is designed to analyze and evaluate the functionality and occupation of the different public spaces in the study areas. The data for each variable was collected from fieldwork. Subsequently, using GIS technology and satellite images, the different variables were vectorized. As in the case of the Bv component, vulnerability is also analyzed in PAv by two subcomponents that analyze and evaluate public areas in terms of their functional and occupation aspects, taking a total of 15 variables into account (). Each variable was weighted independently for each of the subcomponents. This component excludes the area where the buildings are located from the analysis, since the analysis only considers public spaces. The component is calculated using the following Equationequation (5)(Eq. 5)
(Eq. 5) :
(Eq. 5)
(Eq. 5)
in which Pafn and Paon are the values assigned to each variable n and Wfn and Waon are the weights assigned to each variable. After calculating Equation (5), the algorithm shown in Equation (2) was used to reschedule the values for the interval between 0 and 1.
The coastal territorial vulnerability index (CTVI)
In the CTVI calculation each component contributes equally to the vulnerability. After calculating the Morphological (Mv), Land value (Lv), Buildings (Bv) and Public areas (PAv) vulnerability, the Coastal Territorial Vulnerability Index (CTVI) was calculated from the sum of the four components, as presented in EquationEquation (6)(6)
(6) :
(6)
(6)
The CTVI varies between 0 (minimal vulnerability) and 4 (maximum vulnerability), with vulnerability ranging from very low to very high, in accordance with the standard deviation (SD) and the following categories: “very low”, <-1 SD; “low”, ≥ −1 to −0.5 SD; “moderate”, ≥ −0.5 to +0.5 SD; “high”, ≥0.5 to 1 SD; “very high”, ≥1 SD (Barros et al. Citation2015 and Tavares, Barros, and Santos Citation2017). The standard deviation is only used to define vulnerability classes.
Results
Morphological vulnerability
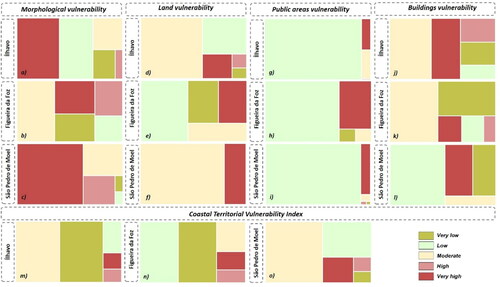
Morphological vulnerability (Mv) () ranges from very low to very high in the three study areas. The Mv in 63.4% of the total area (138 ha) varies between moderate and very high, with the highest level representing 34.2% (47.2 ha).
The Barra and Costa Nova areas near the coastline associated with beaches () present Mv values between high and very high (43.7%). This pattern, in which the highest CTVI is found near the coastline, is transversal to the other study areas. In contrast, the most inland areas have an Mv ranging from very low to moderate (56.4%), associated with frontal dune systems, coastal protection infrastructures, urban areas and agricultural land. In Barra, in addition to the beach areas, the northern part of the urban area (in the vicinity of the lighthouse) also has high and very high vulnerability. The spatial distribution in Costa Nova is similar to Barra beach, although the central area of the village, which is closer to the coastline, presents very high vulnerability.
In Figueira da Foz, more specifically between Cabedelo and the southern area of Cova Gala, 35.8% (25.9 hectares) of the area has high and very high Mv, essentially associated with the beaches. The zones with the lowest vulnerability values are located in the innermost areas, associated with frontal dune systems, and artificial and shrub vegetation areas. However, the Cabedelo area stands out () in presenting moderate vulnerability, since it is decisively influenced by the protection afforded by the south jetty on the mouth of the Mondego River. With regard to Cova Gala, the areas with the highest Mv are found along the beaches, with moderate scores standing out in the area adjacent to the Figueira da Foz hospital and on the seafront between the third and fifth groin. The southern zone immediately after the southernmost groin (moderate to very high Mv) is also of interest since it has been affected in recent decades by intense erosional processes and subjected to numerous interventions, the last of which involved installing geotextile tubes for coastal protection in 2019.
In São Pedro de Moel, most of the area analyzed (62.5%) has a very high Mv (). The less vulnerable areas are located at the southern end of the study area, corresponding to cliff areas and alongshore defence structures in the backshore of the beach.
Figure 4. Land value vulnerability assessment in the study areas.
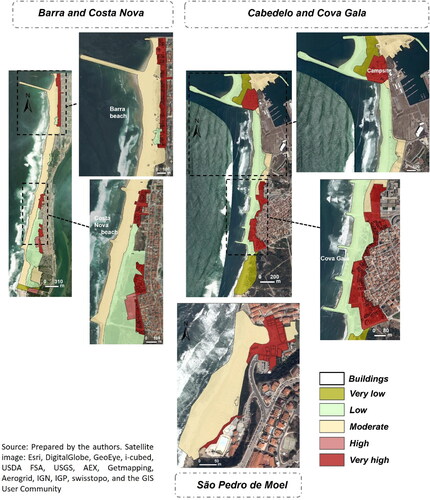
Land vulnerability
The Land value vulnerability (Lv) presents great variability (). In general, most of the area analyzed (75.7%) has a low to moderate Lv, with only 16% presenting high and very high values.
In lhavo, 58.4% of the area has a moderate Lv, coinciding with most of the natural areas. The high and very high vulnerability areas represent 14.4% and are almost exclusively located in urban areas, where there is a greater density of exposed elements. A quarter (24.9%) of the area has a low Lv, with the lowest values found south of Costa Nova, which essentially comprises natural areas.
In Cabedelo and Cova Gala (), 64.6% of the area’s Lv ranges from very low to low, coinciding with natural areas. Very high vulnerability (18.8%) corresponds to the majority of artificial areas, particularly in the north, where a camping site is located, and along the entire consolidated urban front of Cova Gala ().
In São Pedro de Moel, 79.5% of the area has moderate vulnerability, corresponding to the entire beach and cliff areas and a leisure area located on the eastern boundary of the study area. The exception is the village urban front, which presents very high vulnerability.
Buildings vulnerability
A total of 425 buildings distributed across the three study areas were analyzed. Bv displays strong heterogeneity among the different areas. The analysis reveals that 69.4% have a very low to moderate Bv, with the remaining 30.6% ranging from high to very high.
In lhavo, 253 buildings were analyzed, the majority exclusively residential (77.5%). This area presents the highest number of buildings (12.3%) with mixed occupation (residential and commercial), particularly in the Barra urban area. Another differentiating factor is the high percentage (31.9%) of multi-storey and multi-family buildings, some with mixed occupation. This is the predominant typology in the Barra zone. With regard to fluctuating occupation, 79% show daily fluctuation. In terms of vulnerability, 20.2% have very low to low vulnerability, particularly the buildings located in the southern zone of Costa Nova (), 39.6% present moderate vulnerability, and 40.2% range between high and very high vulnerability. They include four buildings related to critical infrastructures that are of strategic importance to the emergency response and normal functioning of society (). In these buildings, Bv varies between low (a wastewater treatment plant), moderate (a marine pilot house and lighthouse) and high (a school and kindergarten).
Figure 5. Buildings vulnerability assessment in the study areas.
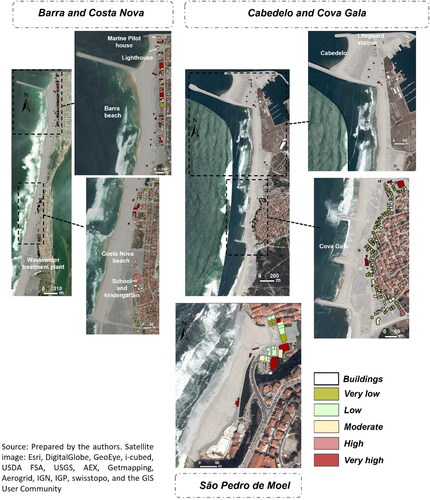
In Figueira da Foz, 145 buildings were analyzed, revealing a clear contrast between the Cabedelo area and Cova Gala. In the former, they mainly consist of commercial and support buildings for the camping site, together with some residential buildings connected to the harbor. In Cova Gala, predominantly residential and single-family buildings are found (73%). Regarding fluctuations in occupation, the same trend can be observed as in lhavo, with daily fluctuation predominating (58%). 85.5% of buildings range from very low to moderate Bv, while the remaining 14.5% have high and very high vulnerability. In Cabedelo, a critical infrastructure was also identified, namely two buildings belonging to the Portuguese navy, which function as a lifeguard station.
In São Pedro de Moel, 27 buildings were analyzed (), which have similar attributes to the Cova Gala buildings due to the predominance of exclusively residential buildings with single-family characteristics. The buildings in this area are distinguished from the others, as they are mainly occupied on a seasonal basis. The majority (19 buildings) have very low and low Bv, although six buildings have very high vulnerability. The latter are associated with beach support buildings and those with mixed (residential and commercial) characteristics, with several floors and units of use.
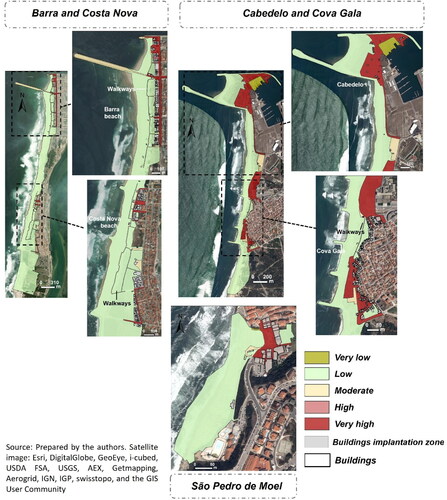
Public areas vulnerability
In the Public areas vulnerability (PAv) assessment no void spaces exist. In the analysis, only the building implantation zones and adjacent private areas, such as gardens or land attached to a particular building, were not considered. The analysis in shows a clear contrast between natural and artificial areas in the three sites. The PAv of the former ranges from very low to low, representing 85.2% of the total for the three areas analyzed. In artificial areas the PAv varies between moderate and very high, representing 14.8%. The assessment of this component reveals great homogeneity between the different areas in comparison to the other CTVI components.
Figure 6. Public areas vulnerability assessment in the study areas.
The coastal territorial vulnerability index
After calculating each of the above-mentioned territorial vulnerability components, the Coastal Territorial Vulnerability Index was calculated (). The results verify the existence of a predominantly very low to moderate CTVI (86.2%) transversal to the different areas and essentially coinciding with natural areas. There is a marked contrast between these areas and the artificial ones, which generally have high and very high CTVI values. The analysis in shows that several buildings are individualized, with lower or higher CTVI values than the adjacent spaces. This results from the composite CTVI calculation process and the respective cross-referencing of the various vulnerability components, which allows for the identification of areas in which buildings have a different vulnerability from their surroundings.
Figure 7. The coastal territorial vulnerability index in the study areas.
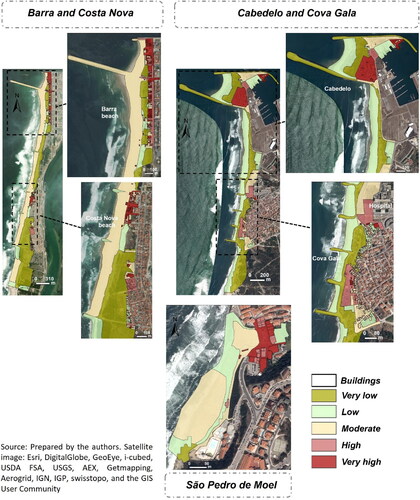
In lhavo, 91.3% of the area analyzed presents a very low to moderate CTVI. These values are mainly found in natural areas. The entire area closest to the coastline, associated with beaches, presents a moderate CTVI, with a few exceptions. The consolidated urban areas of Barra and Costa Nova have a predominantly high and very high CTVI.
In Figueira da Foz, 72.7% of the area has a very low to low CTVI. In this area, contrary to lhavo, the area closest to the coastline has a low CTVI and the areas with frontal dune systems and zones with sparse and shrubby vegetation have a very low CTVI. The artificial areas present a vulnerability that varies between moderate and very high, representing 27.3% of the total area. Special mention should be made of the Cabedelo camping site and the area where a lifeguard station is installed, which presents a very high CTVI. In the most central zone of the study area which coincides with the Cova Gala built-up area, the area adjacent to the hospital, certain buildings and the urban front have high and very high CTVI values.
In São Pedro de Moel there is a clear contrast between natural and artificial areas. The former are characterized by a CTVI that varies between low and moderate, representing 83.6% of the area analyzed. The latter have an almost exclusively high and very high CTVI, representing 16.4% of the area analyzed. The three beach support buildings, located on a lower level of the balcony area and along the pedestrian platform, should also be noted since, despite being situated in areas with a low and moderate CTVI, they present high and very high CVTI values which distinguish them from the surrounding area ().
Finally, it is important to relate the occurrences of flooding and overtopping observed between 1980 and 2018 (Tavares et al. Citation2021) to the results of the composite CTVI index. This analysis shows that 83.3% of the occurrences appear in areas classified as having a moderate, high and very high CTVI. Most (57.3%) occur in natural areas, namely beaches and dunes, mainly classified with a moderate CTVI. It can also be seen that 26% of occurrences are associated with areas with a high and very high CTVI associated with artificial areas, in particular the consolidated urban area of Barra beach in lhavo.
Discussion
This study presents a composite methodology for analyzing and assessing the territorial vulnerability of coastal areas associated with floods and overtopping. The range of variables considered allows for the inclusion of multiple factors that contribute to coastal vulnerability, allowing for a more reliable index, as advocated by Balica, Wright, and Van der Meulen (Citation2012).
The proposed methodology is distinguished by its differentiated analysis and evaluation of the occupation and functionality of buildings and public areas. It provides important information for prevention and mitigation and for the emergency response process, specifically with regard to the interdiction of certain areas, the definition of evacuation routes, the identification of buildings that can serve as shelters and the identification of the most vulnerable buildings and public areas, not only in terms of structure but also occupation and functionalities. The methodology also considers the history of flooding and overtopping occurrences between 1980 and 2018 (Tavares et al. Citation2021) in the definition of the areas to be analyzed. The database contributed to the analysis and understanding of the different territorial dynamics involved in the occurrence of floods and coastal overtopping and also enabled the different associated impacts to be identified and understood. The scope of the variables and vulnerability components, the fieldwork carried out and the opinions of specialists from the multidisciplinary Mosaic.pt project team allowed for an understanding and analysis of the territorial complexity inherent to the local scale and, consequently, the territorial vulnerability. The main limitation is that it did not consider hazard mapping in the study area, although this does not affect the theoretical basis of the vulnerability assessment. However, these variables may be included in future, thus strengthening the methodology.
The local scale valued by the CTVI methodology allows for a differentiated and aggregated assessment of the different dimensions of vulnerability which would not be detected on a different scale, thus contributing to our understanding of what drives vulnerability in at-risk areas and enabling exposed elements and vulnerability hotspots to be identified.
The spatial variability of the different variables considered and the complexity that characterizes the coastal zone is analyzed and evaluated most effectively on the basis of the weighted index. According to Sekovski, Del Río, and Armaroli (Citation2020), the use of a weighted index enables higher vulnerabilities to be identified and assigned more effectively to areas that currently have a higher vulnerability, whereas an unweighted approach would either underestimate or overestimate vulnerability.
Regarding Mv (,b,c), the main differentiating element between the areas concerns the variables related to the existence of natural or artificial protection elements between the coastline and the more inland areas.
Figure 8. Spatial variability of vulnerability in the study areas
.
In terms of land value vulnerability (, e, f), the final results are fundamentally influenced by land use, although it should be noted that it is the property tax location coefficients variable, namely those relating to housing and commerce, that allows for differentiation among the study areas.
This methodology also analyses and assesses the vulnerability of public areas, complementing and strengthening the previous Lv analysis. Sekovski, Del Río, and Armaroli (Citation2020) claim that the attribution of vulnerability values based solely on different land use types can lead to distortions of reality, arguing that land use and occupation between the coastal zone and the most inland areas should be considered. In terms of PAv, the main elements that distinguish between areas are related to the variables that identify the presence of sensitive or vital elements, as well as those associated with the occupation of public areas, namely the form of occupation, floating occupation and the presence of mobile objects. , h, i) shows homogeneity in the three areas.
, k and l) shows the percentage of buildings by vulnerability class. With regard to the differentiation existing within and among the different areas, a set of four variables stands out, namely number of floors, the hydrodynamics of the ground floor, the form and fluctuation of occupation and the average daily number of people present/visitors per unit of use.
Regarding the CTVI, (, n and o), an in-depth spatial analysis allows for a clear contrast between natural and artificial areas. The former have a predominantly very low to moderate CTVI, while the latter have a predominantly moderate to very high CTVI. In the natural and transition areas, the CTVI obtained is fundamentally influenced by the morphological and land value vulnerability components, whereas artificial areas are fundamentally influenced by the land, public areas and buildings components. Another factor that distinguishes the present methodology is the fact that it is able to differentiate between the site of a certain building and the surrounding area whenever it presents a different CTVI to the building.
provides a graphic summary of each of the vulnerability classes obtained for the different components () and the CTVI () in the three study areas. The y-axis represents the maximum and minimum values for each vulnerability class. It is clear from the outset that the Mv presents higher minimum and maximum vulnerability values than all the other components. In all areas and components there is significant dispersion and amplitude in the vulnerability values, which is related to the spatial multiplicity of spaces and buildings analyzed, as well as the temporal variations associated with their occupation. On the other hand, the range of values is related to the large number of variables used in the present methodology, allowing for analysis and evaluation of the multiple dimensions of the territory, whilst also demonstrating that the different vulnerability components contribute differently to the CTVI, thus reflecting the territorial singularities of each area.
Figure 9. Box-plot of the vulnerability components (a) and the Coastal Territorial Vulnerability Index values (b) in the study areas.
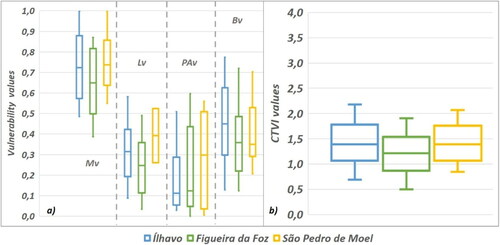
It should be noted that the theoretical range of vulnerability values can be verified in any area in which the method is applied, since the transformation considers the theoretical minimum and maximum.
Conclusions
This paper presents the CTVI, a composite methodology for assessing the territorial vulnerability of coastal zones, given the occurrence of coastal flooding and overtopping. One differentiating aspect of the methodological approach presented here relates to the diversity of the variables considered and the analysis and evaluation of the functionality and occupation of buildings and public areas. On the other hand, the methodological process allows the local characteristics of each area to be highlighted, as well as comparisons between areas, meaning that it can be used in geographical contexts with different coastal typologies. The analysis was also reinforced by a database of historic flooding and overtopping occurrences between 1980 and 2018, thus allowing for a more detailed spatial definition of the areas analyzed.
The increasing complexity that characterizes coastal areas makes it necessary to provide user-friendly tools for the different stakeholders and coastal managers. In this sense, the practical, functional and user-friendly CTVI methodology enables it to function as an important working tool. The different outputs allow for identification of the most vulnerable areas and buildings, contributing toward the provision of reliable information, important not only in the definition of planning strategies for coastal areas but also in the definition and implementation of prevention and mitigation measures related to emergency management.
The CTVI methodology can contribute toward obtaining a unique framework for evaluating and measuring coastal flood vulnerability with a high level of detail (local scale). The use of the CTVI methodology and its results can make an important contribution to obtaining a comprehensive coastal flood risk assessment. The different outputs may contribute toward defining priorities, the implementation of adaptation and operational mitigation programmes in the most vulnerable areas, and the operationalization of plans for the protection of people and goods. The dissemination of the results should also be shared and discussed with the local population in the study areas in order to achieve comprehensive risk communications, thus involving all stakeholders potentially affected or responsible for coastal flooding management. Hence, the CTVI methodology emerges as an important contribution to the creation and development of more resilient communities, to the Sendai Framework for Disaster Risk Reduction (UNISDR Citation2015), and, through the knowledge generated, to the adoption of local practices for dealing with flooding and its impacts.
Additional information
Funding
References
- Andrade, C., and M. C. Freitas. 2002. Coastal zones. In Climate change in Portugal. Scenarios, impacts and adaptation measures – SIAM project, eds. F. D. Santos, K. Forbes, and R. Moita, 173–2019. Lisbon, Portugal: Gradiva.
- Anfuso, G., M. Postacchini, D. Di Luccio, and G. Benassai. 2021. Coastal sensitivity/vulnerability characterization and adaptation strategies: A review. Journal of Marine Science and Engineering 9:72. doi: 10.3390/jmse9010072.
- Antunes, C., and R. Taborda. 2009. Sea level at Cascais tide gauge: Data, analysis and results. Journal of Coastal Research:218–22. SI 56. Proceedings of the 10th International Coastal Symposium, Lisbon, Portugal.
- Antunes, C., and R. Taborda. 2009. Sea level at Cascais tide gauge: data, analysis and results. In Journal of Coastal Research, Special Issue No. 56. Proceedings of the 10th International Coastal Symposium ICS 2009. Vol. I, 218-22.
- APA. 2015. Programa da Orla Costeira Ovar-Marinha Grande. Relatório Ambiental. Lisbon, Portugal: CEDRU/Universidade de Aveiro; 188.
- Aven, T. 2012. The risk concept—historical and recent development trends. Reliability Engineering & System Safety 99:33–44.
- Aven, T., and O. Renn. 2010. Risk management and governance: Concepts, guidelines and applications. Vol. 16. Springer Berlin, Heidelberg: Springer Science & Business Media.
- Bahinipati, C. S. 2014. Assessment of vulnerability to cyclones and floods in Odisha, India: A district-level analysis. Current Science 107 (1):1997–2007.
- Balica, S. F., N. G. Wright, and F. Van der Meulen. 2012. A flood vulnerability index for coastal cities and its use in assessing climate change impacts. Natural Hazards 64 (1):73–105.
- Bana, E., C. A. Costa, and M. Chargas. 2004. An example of how to use MACBETH to build a quantitative value model based on qualitative value judgements. European Journal of Operational Research 153:323–31.
- Barros, J. L., A. O. Tavares, A. Santos, and A. Fonte. 2015. Territorial vulnerability assessment supporting risk managing coastal areas due to tsunami impact. Water 7 (9):4971–98.
- Bertin, X., E. Prouteau, and C. Letetrel. 2013. A significant increase in wave height in the North Atlantic Ocean over the 20th century. Global and Planetary Change, 106:77–83.
- Boruff, B. J., C. Emrich, and S. L. Cutter. 2005. Erosion hazard vulnerability of US coastal counties. Journal of Coastal Research 21 (5 (215):932–42.
- Ceia, F. R., J. Patrício, J. C. Marques, and J. A. Dias. 2010. Coastal vulnerability in barrier islands: The high risk areas of the Ria Formosa (Portugal) system. Ocean & Coastal Management 53:478–86.
- Coelho, C., R. Silva, F. Veloso-Gomes, and F. Taveira-Pinto. 2009. Potential effects of climate change on northwest Portuguese coastal zones. ICES Journal of Marine Science 66 (7):1497–507. doi: 10.1093/icesjms/fsp132.
- Costa, B. E., A. Carlos, and J. C. Vansnick. 1999. The MACBETH approach: Basic ideas, software, and an application. In Advances in decision analysis, 131–57. Dordrecht: Springer.
- Dall’Osso, F., M. Gonella, G. Gabbianelli, G. Withycombe, and D. Dominey-Howes. 2009. A revised (PTVA) model for assessing the vulnerability of buildings to tsunami damage. Natural Hazards and Earth System Sciences 9:1557–65.
- Doukakis, E. 2005. Coastal vulnerability and risk parameters. European Water 11 (12):3–7.
- Ferreira, J. C., F. S. Cardona, C. Jóia Santos, and J. A. Tenedório. 2021. Hazards, vulnerability, and risk analysis on wave overtopping and coastal flooding in low-lying coastal areas: The case of Costa da Caparica, Portugal. Water 13 (2):237. doi: 10.3390/w13020237.
- Ferreira, O., and A. Matias. 2013. Portugal. In Coastal erosion and protection in Europe, ed. A. Williams and E. Pranzini, 457. London & New York: Routledge. doi: 10.4324/9780203128558.
- Forzieri, G., A. Cescatti, F. B. e Silva, and L. Feyen. 2017. Increasing risk over time of weather‑related hazards to the European population: A data‑driven prognostic study. The Lancet Planetary Health 1 (5): e200–e208. doi: 10.1016/S2542-5196(17)30082-7.
- Freire, P., F. Oliveira, and J. N. Oliveira. 2020. Coastal flooding process: Comparing different coastal typologies response to extreme hydrodynamic conditions. In: Malvárez, G. and Navas, F. (eds.). Journal of Coastal Research, SI 95:797–802. doi: 10.2112/SI95-155.1.
- Giardino, A., C. Nederhoff, and M. I. Vousdoukas. 2018. Coastal hazard risk assessment for small islands: Assessing the impact of climate change and disaster reduction measures on Ebeye (Marshall Islands). Regional Environmental Change 18 (8): 2237-48.
- Gornitz, V. 1991. Global coastal hazards from future sea level rise. Palaeogeography, Palaeoclimatology, Palaeoecology, 89 (4):379–98.
- Gornitz, V. M., R. C. Daniels, T. W. White, and K. R. Birdwell. 1994. The development of a coastal risk assessment database: Vulnerability to sea-level rise in the U.S. Southeast. Journal of Coastal Research 12:327–38.
- Huang, Y., F. Li, X. Bai, and S. Cui. 2012. Comparing vulnerability of coastal communities to land use change: Analytical framework and a case study in China. Environmental Science & Policy 23:133–43.
- Iglesias-Campos, A., et al. 2015. Coastal population and land use changes in Europe. In Coastal zones, ed. J. Baztan, 29–49. Amsterdam: Elsevier.
- Julião, R. P., F. Nery, J. L. Ribeiro, M. Castelo Branco, and J. Zêzere. 2009. Guia metodológico para a produção de cartografia municipal de risco e para a criação de sistemas de informação geográfica (SIG) de base municipal. ANPC, DGOTDU, IGP, Lisboa.
- Kantamaneni, K., M. Phillips, T. Thomas, and R. Jenkins. 2018. Assessing coastal vulnerability: Development of a combined physical and economic index. Ocean & Coastal Management 158:164–75.
- Kiat, Ng, P. Borges, M. R. Phillips, A. Medeiros, and H. Calado. 2019. An integrated coastal vulnerability approach to small islands: The Azores case. Science of The Total Environment, 690:1218–27.
- Koroglu, A., R. Ranasinghe, J. A. Jiménez, and A. Dastgheib. 2019. Comparison of coastal vulnerability index applications for Barcelona Province. Ocean & Coastal Management 178:104799.
- Kumar, T. S., R. S. Mahendra, S. Nayak, K. Radhakrishnan, and K. C. Sahu. 2010. Coastal vulnerability assessment for Orissa State, east coast of India. Journal of Coastal Research, 26 (3 (263):523–34.
- Mani Murali, R., M. Ankita, S. Amrita, and P. Vethamony. 2013. Coastal vulnerability assessment of Puducherry coast, India, using the analytical hierarchical process. Natural Hazards and Earth System Sciences 13 (12):3291–311.
- Marinho, B., C. Coelho, H. Hanson, and K. Tussupova. 2019. Coastal management in Portugal: Practices for reflection and learning. Ocean & Coastal Management 181:104874.
- Martins, V. N., R. Pires, and P. Cabral. 2012. Modelling of coastal vulnerability in the stretch between the beaches of Porto de Mós and Falésia, Algarve (Portugal). Journal of Coastal Conservation 16 (4):503–10.
- McLaughlin, S, and J. A. G. Cooper. 2010. A multi-scale coastal vulnerability index: A tool for coastal managers? Environmental Hazards 9 (3):233–48.
- Neumann, B., A. T. Vafeidis, J. Zimmermann, and R. J. Nicholls. 2015. Future coastal population growth and exposure to sea-level rise and coastal flooding—a global assessment. PLoS One 10:e0118571. doi: 10.1371/journal.pone.0118571.
- Nicholls, R. J., P. P. Wong, V. Burkett, C. D. Woodroffe, and J. Hay. 2008. Climate change and coastal vulnerability assessment: Scenarios for integrated assessment. Sustainability Science 3 (1):89–102.
- Oliveira, F. S. B. F. 2015. Evolution of the coastal morphology south of Mondego river mouth, from 1975 to 2011. LNEC - Proc. 0604/112/20285. Relatório 2015 – DHA/NEC.
- Özyurt, G. 2007. Vulnerability of coastal areas to sea level rise: a case study on Goksu Delta. Master’s thesis, Middle East Technical University.
- Özyurt, G., and A. Y. Ş. E. N. Ergin. 2009. Application of sea level rise vulnerability assessment model to selected coastal areas of Turkey. Journal of Coastal Research I: 248–51.
- Palmer, B. J., R. Van der Elst, F. Mackay, A. A. Mather, A. M. Smith, S. C. Bundy, … O. Parak. 2011. Preliminary coastal vulnerability assessment for KwaZulu-Natal, South Africa. Journal of Coastal Research Special Issue 64:1390–5.
- Pendleton, E. A., E. R. Thieler, S. J. Williams, and R. S. Beavers. 2004. Coastal vulnerability assessment of Padre Island National Seashore (PAIS) to sea-level rise; US Geological Survey Open-File Report. Woods Hole, MA: U.S. Geological Survey.
- Pereira, C., C. Coelho, A. Ribeiro, A. Fortunato, C. Lopes, and J. Dias. 2013. Numerical modelling of shoreline evolution in the Aveiro coast, Portugal – climate change scenarios. Journal of Coastal Research 65:2161–6. doi: 10.2112/SI65-365.1.
- Pethick, J. S., and S. Crooks. 2000. Development of a coastal vulnerability index: A geomorphological perspective. Environmental Conservation 27 (4):359–67.
- Ponte Lira, C., A. Nobre Silva, R. Taborda, and C. Freire de Andrade. 2016. Coastline evolution of Portuguese low-lying sandy coast in the last 50 years: An integrated approach. Earth System Science Data 8 (1):265–78. doi: 10.5194/essd-8-265-2016.
- Rangel-Buitrago, N., and G. Anfuso. 2015. Risk assessment of storms in coastal zones: Case studies from Cartagena (Colombia) and Cadiz (Spain). New York, NY: Springer.
- Rocha, C., C. Antunes, and C. Catita. 2020. Coastal vulnerability assessment due to sea level rise: The case study of the Atlantic Coast of Mainland Portugal. Water 12 (2):360. doi: 10.3390/w12020360.
- Santos, F. D., A. M. Lopes, G. Moniz, L. Ramos, and R. Taborda. 2017. Grupo de Trabalho do Litoral: Gestão da Zona Costeira: O desafio da mudança, eds. Filipe Duarte Santos, Gil Penha-Lopes, and António Mota Lopes. Lisbon. (ISBN: 978-989-99962-1-2).
- Satta, A. 2014. An index-based method to assess vulnerabilities and risks of Mediterranean coastal zones to multiple hazards. Doctoral dissertation submitted in October 2014 to the Department of Economics Ca’Foscari University of Venice, Italy.
- Sekovski, I., L. Del Río, and C. Armaroli. 2020. Development of a coastal vulnerability index using analytical hierarchy process and application to Ravenna province (Italy). Ocean & Coastal Management 183:104982.
- Silva, S. F., M. Martinho, R. Capitão, T. Reis, C. J. Fortes, and J. C. Ferreira. 2017. An index-based method for coastal-flood risk assessment in low-lying areas (Costa de Caparica, Portugal). Ocean & Coastal Management 144:90–104.
- Szlafsztein, C., and H. Sterr. 2007. A GIS-based vulnerability assessment of coastal natural hazards, state of Pará. Brazil. Journal of Coastal Conservation 11 (1):53–66.
- Tavares, A. O., J. L. Barros, and A. Santos. 2017. Multidimensional approach for tsunami vulnerability assessment: Framing the territorial impacts in two municipalities in Portugal. Risk Analysis 37 (4):788–811.
- Tavares, A. O., J. L. Barros, P. Freire, P. P. Santos, L. Perdiz, and A. B. Fortunato. 2021. A coastal flooding database from 1980 to 2018 for the continental Portuguese coastal zone. Applied Geography 135:102534. doi: 10.1016/j.apgeog.2021.102534.
- Torresan, S., A. Critto, J. Rizzi, and A. Marcomini. 2012. Assessment of coastal vulnerability to climate change hazards at the regional scale: The case study of the North Adriatic Sea. Natural Hazards and Earth System Sciences 12 (7):2347–68.
- UNISDR (United Nations International Strategy for Disaster Reduction). 2015. Sendai framework for disaster risk reduction 2015– 2030. March 14–18, 2015, Sendai, Japan. Geneva.
- Viavattene, C., J. A. Jiménez, O. Ferreira, S. Priest, D. Owen, and R. McCall. 2018. Selecting coastal hotspots to storm impacts at the regional scale: A Coastal Risk Assessment Framework. Coastal Engineering 134:33–47.
- Vousdoukas, M., L. Mentaschi, I. Mongelli, J. C. Ciscar, J. Hinkel, P. Ward, … L. Feyen. 2020. Adapting to rising coastal flood risk in the EU under climate change. EUR 29969 EN. Luxembourg: Publications Office of the European Union.
Technical appendix
In this technical appendix, the different characteristics and information related to the different variables used throughout the study are presented in detail. The process for calculating the Coastal Territorial Vulnerability Index is also schematically presented.
Characteristics and information of the variables used in the study
Components, variables and calculation process for the Coastal Territorial Vulnerability Index (CTVI)