
Abstract
The Arafura and Timor Seas (ATS) comprise both near pristine and highly threatened marine ecosystems. There are four littoral nations (Indonesia, Timor-Leste, Australia, and Papua New Guinea), which have independently established Marine Protected Areas (MPAs). We design the first resilient MPA network for the entire region to protect critical habitats and species by considering transboundary features (i.e., connectivity of fisheries, rare, threatened, and protected species), uses and threats (i.e., fishing and climate change). We used Geographic Information System processing to identify gaps in the regional network based on existing and proposed MPAs and Areas of Interest (AOIs: previously identified as potential new MPAs) in each country, followed by systematic conservation planning to identify new AOIs for establishing MPAs to fill these gaps. The ATS MPA Network design (301,055 km2) has been endorsed by all four countries and includes all 93 existing (265,405 km2) and proposed (6,264 km2) MPAs, 13 previously identified AOIs (14,773 km2), and seven new AOIs identified in this study (14,613 km2). Of the new AOIs, three have been incorporated in Indonesia’s national MPA network plan, one is in a new MPA currently being developed in Timor-Leste, and Australia is considering two as potential areas for new MPAs.
Introduction
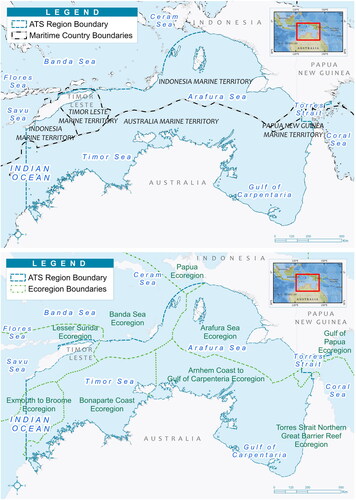
The Arafura and Timor Seas (ATS) is a tropical marine area located between the Pacific and Indian Oceans, extending east from the Timor Sea through the Arafura Sea and Gulf of Carpentaria to the Torres Strait (). The region contains high marine biodiversity (Veron et al. Citation2009), all or part of nine marine ecoregions (Spalding et al. Citation2007; ), and near pristine and highly threatened coastal and marine ecosystems (Edyvane et al. Citation2024). These ecosystems provide critically important goods and services for the four littoral nations bordering the region: Indonesia, Timor-Leste, Australia, and Papua New Guinea (Susanto et al. Citation2024: ).
Figure 1. Boundary of the Arafura Timor Seas (ATS), showing Maritime borders of the four Littoral nations (top) and marine ecoregions (bottom) in the region. Sources: Marine Regions (Citation2024) and marine ecoregions of the world (Spalding et al. Citation2007).
The ATS region faces numerous transboundary environmental threats that have led to habitat degradation, reduced populations of migratory marine megafauna (i.e., sea turtles, dugongs, seabirds, shorebirds, sea snakes, cetaceans, sharks, and rays), and overexploitation of fisheries species (Susanto et al. Citation2024; Kasim et al. Citation2024). These transboundary threats stem from one or multiple countries, traverse national boundaries, impact neighboring nations, and necessitate coordinated regional initiatives for mitigation (ATSEA Citation2011, Citation2023). Climate change exacerbates these threats and is likely to have profound effects on the status and distribution of coastal and marine habitats, associated species, and the ecosystem services they provide (Johnson et al. Citation2023).
Marine Protected Areas (MPAs) can be powerful tools to address local threats and protect biodiversity, enhance fisheries productivity, and increase ecosystem resilience to climate change (Green et al. Citation2014; McLeod et al. Citation2019; Roberts et al. Citation2017; Strain et al. Citation2019). They can also enhance food security and sustainable livelihoods for communities and other stakeholders (White et al. Citation2021). MPA networks, collections of individual MPAs that are ecologically connected, can deliver additional benefits (i.e., by acting as mutually replenishing networks to facilitate recovery after disturbances and enhance protection of migratory species: Green et al. Citation2020b). However, MPAs and MPA networks can only achieve their objectives if they are well designed and managed effectively (Edgar et al. Citation2014; Giakoumi et al. Citation2018; Gill et al. Citation2017; Green et al. Citation2014).
Each of the four countries has an existing MPA network or design that includes their waters in the ATS Region [e.g., DSEWPaC 2012; Fajariyanto et al. Citation2019; Grantham et al. Citation2011; Wilson et al. Citation2011; Papua New Guinea Government (PNG) Citation2015]. However, they were not designed to form a regional network, so they do not take large-scale patterns of biophysical, socioeconomic, and cultural considerations into account (such as region wide patterns of connectivity of fisheries, rare, threatened, and protected species and transboundary uses and threats e.g., fishing and climate change).
In this study we designed, for the first time, a resilient network of Marine Protected Areas (MPAs) for the entire ATS region, which is urgently required to safeguard crucial habitats and species by addressing transboundary issues (particularly related to connectivity, overfishing, the decline of migratory species, and climate change). Our approach was to conduct a marine gap analysis by considering existing and proposed MPAs (and Areas of Interest already identified for establishing new MPAs), and using the best available science, data and MPA design practices to identify potential gaps in the regional MPA network.
The ATS countries can use the regional MPA network design to meet their national goals (e.g., Indonesia’s commitment to expanding their MPA coverage to 30% by 2045: Kementerian Kelautan dan Perikanan (KKP) Citation2023) and contribute to global conservation targets such as the Kunming-Montreal Global Biodiversity Framework [that invites governments to cooperate at the transboundary, regional, and international level to protect at least 30% of lands and waters in MPAs and other effective area-based conservation measures by 2030: Convention on Biological Diversity (CBD) Citation2022]. Our design will also complement other regional initiatives in nearby areas such as the Coral Triangle Marine Protected Area System Framework and Action Plan [Coral Triangle Initiative on Coral Reefs and Fisheries and Food Security (CTI-CFF) Citation2013].
Methods
MPA networks can support ecosystem resilience by preventing or reducing local stressors and maintaining key factors (such as coral recruitment and herbivory) that support resilience to local and global threats (McLeod et al. Citation2019). Resilient MPA networks should be designed to include the full suite of habitat types to protect biodiversity and functional redundancy, include replicates of representative habitats, ensure connectivity between healthy and degraded reefs to support replenishment, include areas that are likely to be more resilient or resistant to global environmental change, and increase the likelihood of protecting diverse assemblages and taxa with acclimation and adaptation properties that support resilience (reviewed in Mcleod et al. Citation2019).
We designed a resilient ATS MPA Network using a five-step process described below where we: (1) defined the goals and design criteria; (2) delineated the planning area and stratification units; (3) defined the conservation features, threats, and other uses; (4) compiled and processed spatial data layers; and (5) designed the network using a gap analysis and systematic conservation planning.
Throughout the process we consulted with governments (national, provincial and/or local), scientists and a range of other stakeholders (e.g., nongovernmental organizations, women’s groups, and the private sector) in each country. In March 2021, we consulted 240 key stakeholders through three national workshops and 56 stakeholders in one regional workshop involving all ATS countries. In these workshops, we sought their input and review regarding the MPA network design process, the best available data layers used in the analysis, and the results. The entire process spanned one year from June 2020 to June 2021.
Step 1. Defining goals and design criteria
First, we defined the goals for the MPA network, and the design criteria required to achieve these goals. We established the goals in accordance with the objectives of the ATSEA-2 project regarding recovering and sustaining fisheries, restoring degraded habitats for sustainable provision of ecosystem services, reducing land-based and marine sources of pollution, protecting key marine species; and adapting to impacts of climate change (Susanto et al. Citation2024).
Then we identified biophysical and socioeconomic design criteria ( and ) to provide specific advice on how to design and implement the MPA network to achieve these goals and address the needs and interests of stakeholders, by adapting and refining criteria used in previous MPA network design processes in the region (DSEWPaC 2012; Fernandes et al. Citation2005; Green et al. Citation2009, Citation2020a,Citationb). We applied these criteria in the regional MPA network design process as far as possible, depending on available data.
Table 1. Biophysical criteria for designing an MPA network for the Arafura Timor Seas.
Table 2. Socioeconomic and cultural criteria for designing and establishing an MPA network for the Arafura and Timor Seas.
Step 2. Delineating the planning area and stratification units
We defined the planning area for the MPA network design as including all waters within the ATS Boundary () extended to the highest astronomical tide to include an important conservation feature (mangroves).
We divided the planning area into stratification units that represent the range of environmental, geographic, and political variations in the region, and applied targets for each conservation feature (see Defining Targets) within each stratum. We stratified in two ways: (1) by country, so the results can be used to refine or develop MPA networks in each of the four Countries that intersect with the ATS Region (); and (2) by marine ecoregion () to ensure that the design criteria of habitat representation and replication () apply to each conservation feature in each ecoregion.
Step 3. Defining conservation features, threats, and other uses
We defined conservation features to protect in the ATS MPA Network that included the following habitats, critical, special, and unique areas:
Shallow water habitats (≤ 200m), including coral reefs, mangrove forests, seagrass beds and estuaries (), and coral reef habitat types (i.e., coral, rubble, rock sand etc.: ).
Deepwater habitats (>200m) including: seamounts; canyons; abyssal hills, mountains, or plains; basins, bridges, escarpments, or ridges; shelves (low, medium or high) and shelf valleys (small or moderate); hadal; spreading ridges, sills, slopes, terraces, trenches, and troughs ().
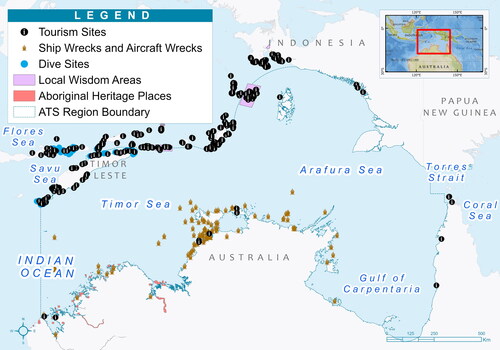
Critical, special and unique areas for: focal fisheries (fish spawning and nursery areas) and endangered, threatened and protected species (sea turtles, birds, marine mammals and sharks: ); and tourism and culture [tourism and dive sites, ship and airplane wrecks, and important traditional areas (aboriginal heritage places and local wisdom areas) ().
Figure 2. Shallow water conservation features for protection in the Arafura Timor Seas (ATS) Region: coral reefs, seagrasses, mangroves and estuaries (top); and coral reef habitat types (bottom). For data sources see .
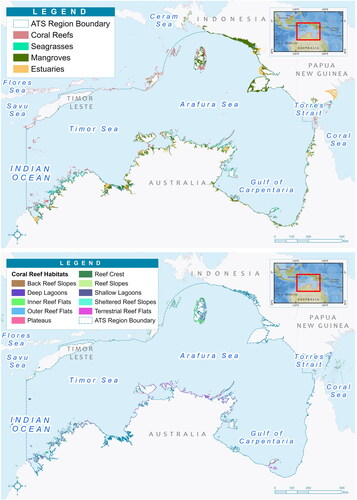
Figure 3. Deepwater conservation features for protection in the Arafura Timor Seas (ATS) Region. For data sources see .
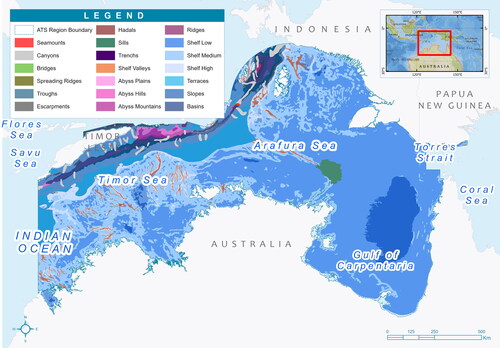
Figure 4. Critical areas for protecting endangered, threatened and protected species (sea turtles, birds, marine mammals and sharks). For data sources see .
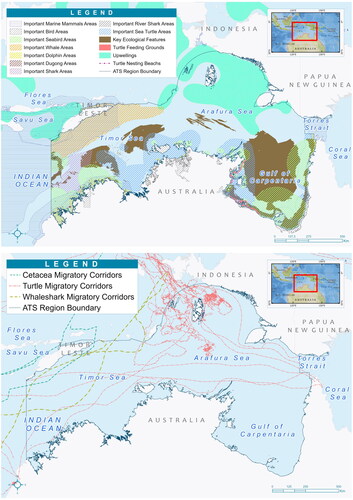
Figure 5. Critical areas protecting socioeconomic and cultural areas. For data sources see .
We also identified areas to avoid establishing MPAs because they are allocated for other uses or there are threats to these conservation features. One of the most important uses of marine resources in the region is fishing ().
Figure 6. Fishing pressure (top), other uses and threats (bottom). For data sources see .
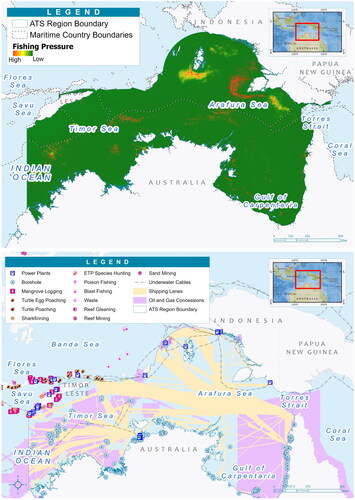
Some uses are not compatible with the goals of the MPA network. Where possible, we avoided placing MPAs in locations where these activities are already established or planned (). For example in Indonesia, MPAs cannot be established in marine areas already allocated for the following uses in national spatial plans: military areas, transportation and fishing ports, international shipping lanes, oil and gas mining areas, underwater cable pipe lanes, and sea mine areas (unexploded ordinance: Green et al. Citation2020a; see Supplemental Information Figure A).
Threats to conservation features included overfishing and destructive fishing practices (poison and blast fishing, and reef gleaning), poaching (of turtles and their eggs), discharges from power plants, waste, mangrove logging, and shark finning ().
Step 4. Compiling and processing spatial data layers
To apply the design criteria ( and ), we compiled 108 spatial data layers (Supplemental Information Table A) into a GIS database regarding:
MPA status: existing MPAs (legally established), proposed MPAs (in the process of being established), and Areas of Interest (AOIs: potential new MPAs identified in previous regional, national, or provincial/state plans or research projects: Fajariyanto et al. Citation2019; Grantham et al. Citation2011; Wilson et al. Citation2011) in each country ().
Conservation features: shallow water habitats (), deepwater habitats () and critical special and unique areas ( and ); and
Other Uses and Threats ().
We reviewed, processed, and verified each data layer (i.e., validating accuracy by comparing it with other spatial and non-spatial information for the same area e.g., for conservation features, threats, and other uses). We identified 41 layers that we used for the Marxan analysis () because they were comprehensive (available for the entire planning area), unbiased (the same level of detail was available throughout the planning area) and reliable (validated).
Table 3. Spatial data layers used in the marxan analyses (for shallow water habitats only or for shallow and deepwater habitats combined) as either targets for protecting each conservation feature (% protection or locked in 100% or locked out 0%) or in the cost surface. A list of all data layers, and how they were used to design the MPA network, is in Supplemental Information Table A.
We prepared each of the spatial data layers to use in Marxan by intersecting them with the planning area, stratification, and planning units (see below). We also identified 67 other data layers to use manually to refine the results of the Marxan analysis to identify AOIs for new MPAs later in the process (which primarily comprised good quality data for specific areas only: see Supplemental Information Table A).
Step 5. Designing the MPA network
We designed the MPA network for the ATS Region by: conducting a marine gap analysis to identify gaps in the network where an adequate proportion of conservation features (see Defining Targets) are not located in MPAs; and using systematic conservation planning to identify AOIs for establishing new MPAs to fill these gaps.
Conducting the marine gap analysis
We identified gaps in the existing MPA network by determining the percentage of each conservation feature located in existing and proposed MPAs and AOIs within the ATS Region () using five ArcGIS spatial operation tools: “Erase” to eliminate overlapping areas between existing MPAs, proposed MPAs and AOIs; “Merge” to combine data layers; “Intersect” to identify overlapping regions; Dissolve” to merge data layers; and “Geometry Calculator” to conduct advanced geometric operations. We repeated this analysis as we refined the MPA Network design until we achieved the targets as far as possible.
Using systematic conservation planning
We used the systematic conservation planning tool Marxan to design an MPA network for the ATS Region, by including existing and proposed MPAs and AOIs, and identifying new AOIs to fill gaps in the network. Marxan aims to efficiently meet targets for protecting conservation features while minimizing the impacts on utilization (fisheries, industry, etc.: Ball, Possingham, and Watts Citation2009). The Marxan process comprised six key components: conducting shallow and deepwater analyses; developing planning unit layers: defining targets; defining locked in and locked out features; developing a cost surface; and refining the MPA Network design with input from stakeholders.
Conducting shallow and deepwater analyses
Since we had better quality data (higher resolution with more validation) for shallow (≤200 m) than deepwater (>200 m) habitats, we conducted the Marxan analysis in two steps. First, we ran a shallow water analysis only. Then we locked in the best (sum) solution from the shallow water analysis (Supplemental Information Figure B) and ran a shallow and deepwater analysis combined. This approach ensured that Marxan aimed to achieve the targets for protecting both shallow and deepwater conservation features, while prioritizing using better-quality data and considering connectivity between shallow and deepwater habitats.
We used different data layers and planning unit sizes (see below) for each analysis. For the shallow water analysis, we used data layers for MPA status (existing and proposed MPAs, and existing AOIs), conservation features (shallow water habitats, critical, special, and unique areas), and other uses (; ). For the combined shallow and deepwater analysis, we used data layers for the result (best solution) from the shallow water analysis (Supplemental Information Figure B), conservation features (deepwater habitats) and other uses (; and ).
Developing planning unit layers
We used geographic planning units (in the shape of hexagons) as the individual units of choice for selection in the analysis, and two planning unit layers with hexagons of different sizes based on data resolution and the scale of conservation features. The size of these planning units also allowed us to keep the Marxan processing time within manageable time frames.
We used smaller planning units (5 km2) for the shallow water analysis because of the higher resolution of the data, and larger planning units (25 km2) for the combined shallow and deepwater analysis because of the coarser resolution of the deepwater habitat data (and the larger size of many of the deepwater conservation features: ). The planning unit layers comprised 279,026 and 68,132 hexagons for the shallow water and the combined shallow and deepwater habitat analyses respectively.
Defining targets
We defined targets for how much of each conservation feature to include in the MPA network. Marxan aims to achieve these targets, while minimizing the “cost” of including them in the network (see Developing a Cost Surface).
We set targets for each conservation feature by following scientific advice for habitat representation in resilient MPA network design (e.g., Green et al. Citation2014) and to be consistent with (or similar to) targets used in previous MPA network designs in the region (e.g., Fajariyanto et al. Citation2019; Green et al. Citation2009, Citation2020a,Citationb; Wilson et al. Citation2011) as follows ():
30% of each shallow water habitat (coral reefs, mangroves, seagrasses, and estuaries; and coral reef habitat types: ) per country and ecoregion.
10% of most deepwater habitats that may be less critical for biodiversity protection, some of which cover very large areas (). Higher targets were allocated for seamounts (100%) and canyons (30%), because of their importance for biodiversity and as feeding areas for cetaceans and large pelagic fishes (Thompson et al. Citation2023).
30% of most critical, special, and unique areas (turtle nesting beaches, dive sites, tourism areas, ship and airplane wrecks), except for important traditional areas (i.e., local wisdom and Aboriginal Heritage Places: and ) which were 50%.
Defining locked in and locked out features
Some areas are so important to include or exclude in the MPA network design that we locked them in or out of the analysis (see ). Marxan did not select “locked out” areas for inclusion in the MPA network and aimed to select “locked in” areas () as priorities to include in the network. Where areas were included in both locked in and locked out areas, Marxan did not select locked out areas.
We locked out areas that have already been allocated for other uses [i.e., transportation and fisheries ports, underwater cable pipe lanes, military areas, oil and gas mining areas, and sea mine areas (unexploded ordinance): ], where MPAs may not be compatible with these uses or if they cannot be established in those areas (i.e., if they have been allocated for other uses in marine spatial plans in Indonesia: Green et al. Citation2020a).
We “locked in” existing MPAs, proposed MPAs (areas already allocated for that purpose in marine spatial plans in Indonesia) and AOIs (). We added existing MPAs located in locked out areas (e.g., areas allocated for other uses in Indonesia’s spatial plans) to the MPA network design after the Marxan analysis when we refined the network manually (see below). AOIs located in locked out areas were not selected for inclusion in the network.
Developing a cost surface
"Costs" are values assigned to each planning unit used to help minimize the impact of the MPA network on other uses of marine resources, and to minimize impacts from other uses and industries on the MPA network (e.g., for fisheries and other industries). The values reflect the “cost” of including each planning unit in the MPA network, which may not necessarily be a monetary value. For example, costs may reflect socioeconomic factors that help reduce conflict with other uses and facilitate implementing the network more effectively (i.e., avoiding the loss of fishing areas).
Cost surfaces are spatial data layers that combine costs and are overlaid with the planning unit layer to determine the cost of including each planning unit in the MPA network. We used a socioeconomic cost surface that we created as a weighted sum of impacts to fisheries (using fishing pressure) and access to transportation and fishing ports (using shipping lane density: Marine Traffic Citation2019), as well as impacts from industries (power plants, underwater cables, oil and gas areas: ).
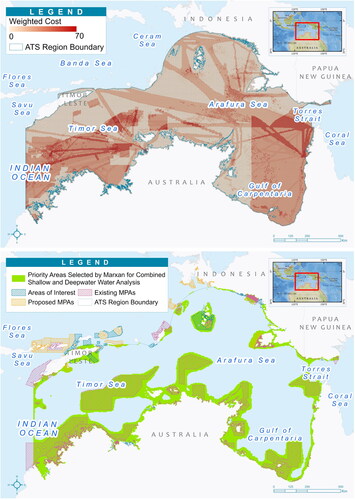
Figure 7. Weighted cost surface (top) and priority areas for inclusion in the MPA network (areas selected 70 to 100 times in the sum solution for the combined shallow and deepwater marxan analysis) overlaid with existing and proposed MPAs and areas of interest previously identified for establishing new MPAs (bottom).
For fishing pressure, we extracted daily fishing hours from Global Fishing Watch (GFW 2012-2016: see Supplemental Information Figure C). This data provides a record of voyages of larger fishing vessels using Automatic Identification System (AIS) tracking, producing a raster data layer with units of hour/km2. To represent smaller traditional fishing vessels, we also used night lights [VIIRS Monthly Average Nighttime data (NOAA 2012-2016): see Supplemental Information Figure D] to produce a raster data layer with units of nanowatts/cm2/sr). We averaged both types of data for the same time (2012 to 2016).
Combining the GFW and VIIRS data sets required both datasets to be rescaled. We assumed that each data set had a normal distribution and used Z-scores to standardize the data. We rescaled the data to conform within a range of 0 to 100 and generated a new data layer for combined fishing pressure (). Then we applied zonal statistics to assign a value for fishing pressure to each planning unit using the maximum operator in ArcGIS Software.
Planning units that intersected with each feature were assigned a cost value to represent the presence of each cost layer. Since we established a scale of 0 to 100 for all costs, the value for each layer was 0 for non-existent or 100 for existing intersection.
We then used a weighted value for each cost layer () to create the combined cost surface (). We used our professional judgment to assign weighted values to each cost layer based on their likely impacts on the MPA network, and to minimize the impact of the network on other marine resource uses (e.g., fishing pressure had the highest weight to avoid conflict with fisheries). Thus Marxan avoided placing MPAs in areas with higher costs () to minimize impacts on fisheries and ports, and from industry.
Table 4. Weighted value for each cost layer.
Refining the MPA network design with input from stakeholders
We used results of the Marxan analysis and other information to develop the final ATS MPA network design by: reviewing the results of the first Marxan analysis with governments, scientists, and other stakeholders from each of the four countries; conducting a second, more refined Marxan analysis based on their input; and manually refining the results of the second Marxan analysis using GIS Software and data layers not included in the Marxan analysis (Supplemental Information Table A).
This included manually refining the Marxan result to consider regional patterns of larval connectivity and vulnerability to climate change. To address climate change, we used data layers provided by Johnson et al. (Citation2023) to apply a conservation target of including 30% of corals and seagrasses (see Defining Targets) with different levels of vulnerability to climate change (low, moderate, and high) within each coral ecoregion (Veron et al. Citation2009) in the MPA network.
To address connectivity, we applied a target of 30% habitat representation within coral ecoregions (e.g., Veron et al. Citation2009) to represent areas that appear distinct in terms of larval connectivity of multiple taxa (Treml et al. Citation2015; Thompson et al. Citation2018). We also examined the location, size and spacing of MPAs and AOIs to determine if they comply with design criteria to incorporate connectivity in the MPA network design and protect critical areas (i.e., migratory corridors: ; ). Where necessary, we manually adjusted the location, size and spacing of MPAs and AOIs to meet these design criteria.
Results
Outputs of marxan analyses
The combined shallow and deepwater Marxan analysis identified priority areas for including conservation features in the MPA network (). Most priority areas were already included in existing or proposed MPAs, or AOIs identified in previous studies that were locked in for the analysis.
An MPA network design for the Arafura and Timor Seas
The MPA network design for the ATS Region () includes 93 existing and proposed MPAs (comprising 271,669 km2), thirteen AOIs for establishing new MPAs identified in previous studies (five in Indonesia, and eight in Timor-Leste, comprising 14,773 km2) and seven new AOIs identified in this study (comprising 14,613 km2: ) to fill gaps in the network.
Figure 8. Marine protected area network design for the Arafura and Timor Seas region, consisting of existing and proposed MPAs, and Areas of Interest for establishing new MPAs (identified in this and previous studies). Sources: Indonesia Indonesian Ministry of Marine Affairs and Fisheries (MMAF) (Citation2020), UNEP-WCMC and IUCN (Citation2019), Australian Marine Parks (Citation2023), Edyvane and Dethmers (Citation2010), Grantham et al. (Citation2011), Wilson et al. (Citation2011), and Fajariyanto et al. (Citation2019).
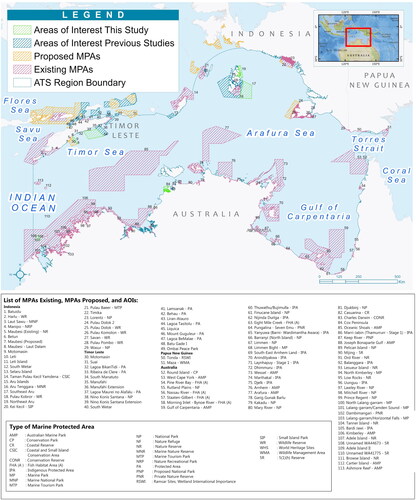
Table 5. Area (km2) of existing and proposed MPAs, and Areas of Interest for establishing new MPAs (identified in this and previous studies) in each country in the Arafura and Timor Seas (see Figure 8).
The seven new AOIs include (): three in Indonesia (Motamasin, Northeast Aru and Southeast Aru), two in Timor-Leste (Motamasin and South Manatuto), and two in Australia (Adele Island II and Cox Peninsula). The Motamasin AOI is designed as a transboundary MPA between Indonesia and Timor-Leste.
All 20 AOIs were identified as potential areas for establishing new MPAs because they comprise important biophysical, socioeconomic and/or cultural areas not currently located within existing or proposed MPAs. If all 20 AOIs were established as new MPAs, they would increase the total area of existing and proposed MPAs in the ATS Region from 271,669 to 301,055 km2 ().
Results of marine gap analysis
The gap analysis showed that while existing or proposed MPAs achieve the targets for including most shallow water conservation features, additional MPAs in the AOIs are required to achieve the targets for other conservation features (e.g., for some deepwater habitats, and critical, special and unique areas: ). However, the targets could not be achieved in the MPA Network design for estuaries and some deepwater habitats (, see below).
Figure 9. Percentage of each conservation feature represented in the Arafura and Timor Seas MPA network design in existing and proposed MPAs, and Areas of Interest identified for establishing new MPAs in this and previous planning processes, for: shallow water habitats (top left) and coral reef habitats (top right); deepwater habitats (bottom left); and critical, special and unique areas (bottom right). Where targets for representing each feature in MPAs (represented by black lines) are: at least 30% for each shallow water and coral reef habitats; 10% for most deepwater features except for canyons (30%) and seamounts (100%); and 30% for most critical, special and unique areas except for important traditional areas (local wisdom and Aboriginal Heritage Places) which are 50%.
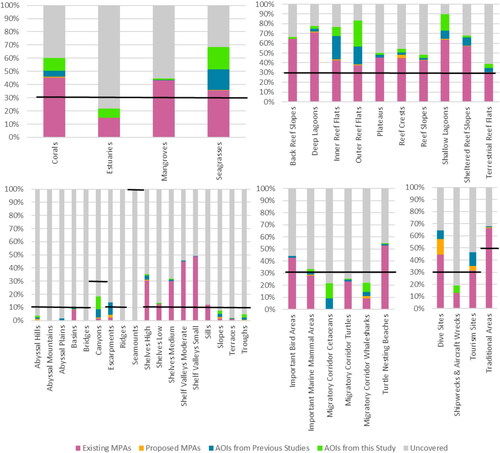
Shallow water habitats
Representation of each shallow water habitat has already achieved the target for inclusion in existing or proposed MPAs, except for estuaries (). Targets for representing shallow water habitats were also met within the marine waters of each country within the Region, except for estuaries in Australia, Indonesia and Timor-Leste and seagrasses in Papua New Guinea (Supplemental Information Figure E). The percentage of estuaries represented in MPAs would increase with the establishment of MPAs in Australian AOIs, although it would still be less than the desired target of 30% ( and Supplemental Information Figure E).
Representation of each of the 10 coral reef habitats in MPAs has also been achieved in existing MPAs throughout the Region () and for most of these habitats in each country (Supplemental Information Figure F). Representation of all these classes would increase with the implementation of the proposed MPAs and new MPAs in AOIs (), which would result in the target being achieved for all coral reef habitats in each country (Supplemental Information Figure F).
Deepwater habitats
Representation of most of deepwater habitats in existing or proposed MPAs and AOIs in the MPA Network design are low, and do not meet the target of 10% (with many habitats currently at 0 to <8% representation: ), except for basins, escarpments, shelves, and sills (that range from 12 to 48% representation). Similarly, the MPA network design does not meet the target of protecting 30% of canyons (currently 18%) or 100% of seamounts (currently 0%). This is because some deepwater conservation features could not be included in the MPA network design because they are in areas that were either locked out or were considered high cost to include in the network (i.e., where there is high fishing pressure, oil and gas mining concessions, underwater cables, power plants and high-density shipping areas).
In Australian waters, most habitats are already achieving the targets in existing MPAs, although slope and terraces are still underrepresented (Supplemental Information Figure G). In Indonesia, most habitats (except high shelves) are underrepresented, and two of the four habitats (basins and low shelves) are underrepresented in PNG (Supplemental Information Figure G). In Timor-Leste, representation of most habitats is currently low, but the targets would be achieved or exceeded for most habitats by the addition of the new MPAs in the AOIs identified in this study (including 60% of canyons).
Critical, special, and unique habitats
The regional MPA network design would achieve most targets for protecting critical, special, and unique areas, with more than 60% of dive sites, 50% of tourism areas and more than 50% of turtle nesting beaches and Aboriginal Heritage Places, and 30% of local wisdom areas included in the network (). However, less than 25% of migratory corridors and wrecks would be represented, falling short of their targets ().
There is a lot of variation among countries in the degree to which each feature is located within the MPA Network design in their waters (Supplemental Information Figure H). More than 50% of important traditional areas (Aboriginal Heritage Places) are already within MPAs in Australia, and 30% of local wisdom areas are included in the MPA network design in Indonesia. Representation of the local wisdom areas cannot meet the target (50%) in Indonesia, because some areas overlap with one or more locked out areas (for underwater cable) and high-density shipping lanes.
More than 30% of turtle nesting beaches are included in the regional network design (), although representation varies greatly among countries (>60% in Australia, >30% in Indonesia, 90% in Timor-Leste and 5% in PNG: Supplemental Information Figure H).
Dive sites are well represented in the MPA network in both Indonesia (100%) and Timor-Leste (∼70%), as are tourism areas in Indonesia (>50%) (Supplemental Information Figure H). However, none of the four dive sites identified in Australia are within MPAs, since they are all in areas that overlap with ports and high-density shipping lanes.
In Australia, less than 20% of shipwrecks are included in the MPA Network design (Supplemental Information Figure H). Other shipwrecks could not be included in new AOIs (e.g., in Indonesia) because they are in areas that overlap high density shipping lines, underwater cables, military areas, and ports.
Incorporating large scale patterns of connectivity
We achieved the target of incorporating larval connectivity by representing 30% of coral reefs in each area that appears distinct in terms of connectivity in the MPA network design. The design also appears to accommodate connectivity patterns of many species, since most MPAs and AOIs are either large enough to be self-sustaining (e.g., the Oceanic Shoal in Australia) or close enough to form mutually replenishing networks for these species (Supplemental Information ). However, a more rigorous scientific analysis is required to confirm if this is the case.
We also designed the MPA network to include more migratory corridors for rare and threatened species () e.g., by expanding the existing Southeast and Northeast Aru AOIs and adding the Adele Island II AOI to include sea turtle migratory corridors between Indonesia and Australia.
Discussion
A resilient MPA network design for the Arafura and Timor Seas
At present, there are many existing or proposed MPAs in the Arafura and Timor Seas. However, they were not designed to form a network that takes biophysical, socioeconomic, and cultural considerations into account to achieve conservation goals and targets at the regional scale.
In this study we provide, for the first time, an MPA network design for the entire ATS Region (301,055 km2) that includes all 93 existing and proposed MPAs (271,669 km2), and 20 AOIs (29,386 km2) for establishing new MPAs, in the four countries in the region (). These AOIs are designed to address gaps in the current network by: increasing representation of shallow (especially estuaries) and deepwater habitats (i.e., canyons), and critical, special, and unique areas (i.e., ship and aircraft wrecks) within MPAs; and taking regional patterns of connectivity and transboundary uses and threats (i.e., fishing and climate change) into account.
Addressing conflicts among MPAs and other uses
The ATS MPA Network design highlights the issue of conflicting use since there is a lot of overlap between some high priority areas for protecting conservation features in MPAs and areas with other uses. This resulted in some conservation features being underrepresented in the MPA network design. For example, there is a need to include more conservation features (e.g., estuaries and some deepwater features such as canyons) in MPAs. However, it was not possible to include some of these features in the MPA network design, because they are in areas allocated for other uses. For example, the only seamount in the region is located within an Indonesian Oil and Gas Concession allocated for underwater cables in the National Marine Spatial Plan, where new MPAs cannot be established. Conversely, some existing and proposed MPAs are already located in areas allocated for other uses in Indonesia’s National Marine Spatial Plan (e.g., Yamdena Coastal and Small Islands Conservation Area and Lorentz National Park overlap Oil and Gas Concessions: and ). This demonstrates that conflicts between MPAs and other uses is still a challenge in the region, particularly in Indonesia (Fajariyanto et al. Citation2019), and we have notified the Indonesian MPA Management Authority of the need to address this issue.
Some useful lessons may be learned from other ATS countries regarding how to integrate MPAs more effectively with other uses and threats in marine spatial plans. For example, the Great Barrier Reef Marine Park in Australia accommodates many uses (including highly protected areas, designated shipping areas, defense training areas etc.) through a multiple use zoning plan (Day et al. Citation2018).
Implementing design criteria
Designing MPA networks requires the application of a comprehensive set of biophysical, socioeconomic, and cultural design criteria ( and ). In this analysis, we applied most of the biophysical design criteria (), although the design may need to be refined as more information becomes available (particularly regarding climate change and larval connectivity), or during implementation (e.g., to allow time for populations of fisheries species to recover from overfishing).
We were also able to apply some socioeconomic and cultural design criteria where information was available (particularly regarding protecting marine heritage sites and supporting local wisdom and practices). However, we were unable to apply other criteria because either the relevant information was not available (regarding local uses and livelihoods) or they need to be applied during implementation (e.g., regarding stakeholder involvement and compliance). These criteria should be addressed when designing and implementing individual AOIs throughout the region, particularly where they relate to the needs and interests of local communities.
Refining the ATS MPA network design
In this study we provide, for the first time, an ATS MPA Network design that identifies important areas for inclusion in the network. This design is based on the best available information and practices for conservation planning and should be used to inform MPA network design by the four countries in the region.
The MPA network design should be updated and refined in future as new MPAs are established and more information becomes available (particularly regarding: the location and extent of conservation features, uses and threats; socioeconomic and cultural information; and new or improved data layers). It may also be more important to protect the highest priority critical, special, and unique areas (i.e., turtle nesting areas or shipwrecks), rather than just achieving the percentage targets. This should be assessed in future.
The design will also need to be refined over time to consider MPA zones. Most of the biophysical design criteria () should be applied to no-take areas (e.g., see Green et al. Citation2014), because they provide the greatest ecological benefits for enhancing fisheries productivity, protecting biodiversity, and adapting to climate change (Edgar et al. Citation2014). However, we could not design the MPA network using zones because zoning plans were not available for some MPAs (especially in Indonesia and Timor-Leste). The next step may require zoning individual MPAs so zones can be considered in the regional design process (using zones that are compatible across all four countries).
Implementing the ATS MPA network design
This study represents the first attempt to design a regional network of MPAs for the ATS, led by the ATSEA-2 Project in collaboration with the four littoral countries in the Region. Each country has endorsed the ATS MPA Network design, acknowledging the process and validity of the data, and committing to referring to and possibly adopting the recommendations. The ATSEA MPA Network design (this study) has also been crucial in shaping the region’s Strategic Action Program for the next decade (2024-2033: ATSEA Citation2023).
In this study, we identified seven new AOIs to fill gaps in the ATS Regional MPA Network: two in Timor-Leste, two in Australia, and three in Indonesia (). Indonesia has included three of these new AOIs in their MPA Network plan to be launched in 2024 (with a target of allocating 30% of marine waters in MPAs by 2045). Timor-Leste is currently developing a new MPA in the south in Manufahi and Manatuto Municipalities that includes a new AOI, and Australia is considering two new AOIs we identified as potential MPAs within their waters. The remaining AOI (Motamasin) will need to be considered as a transboundary MPA between Timor Leste and Indonesia in future planning processes.
If each country implements their proposed MPAs and establishes new MPAs in the AOIs identified in this and previous studies, the ATS MPA Network should be designed to protect most shallow water conservation features. However, additional management actions may be required to protect some deepwater features (i.e., canyons and seamounts) where MPAs cannot be established, because of their importance for biodiversity, fisheries, rare, threatened, and protected species (Thompson et al. Citation2023).
With the ATSEA-2 project ending this year (Susanto et al. Citation2024), the four countries will be responsible for implementing the ATSEA MPA Network design, including establishing MPAs in AOIs (as appropriate) and addressing the need for further education and awareness raising among communities and resource users. Establishing new MPAs will need to follow established processes in each country, including consultations with local stakeholders. Furthermore, before they are established as MPAs, AOIs will need to be validated in the field to ensure they will provide the expected benefits for the network (as indicated by the best available data used for this analysis).
Management effectiveness is also a major challenge in the region. Many MPAs are not managed effectively, and improving their effectiveness remains a high priority for ensuring that MPAs achieve their goals for conservation and management (especially in Indonesia and Timor-Leste: White et al. Citation2021; Susanto et al. Citation2024).
Supplemental Material
Download PDF (3.2 MB)Acknowledgements
We thank the National, State and Provincial Governments of the ATS Region, and many non-governmental organisations, scientists (particularly Karen Edyvane, Johanna Johnson and Jennifer McGowan) and other stakeholders for sharing their knowledge and supporting this process.
Disclosure statement
No potential conflict of interest was reported by the author(s).
References
- Alder, J. 2003. Putting the coast in the “Sea Around Us.” The Sea Around Us Newsletter 15:1–2. Accessed December 2019. http://seaaroundus.org/newsletter/Issue15.pdf; http://data.unep-wcmc.org/datasets/23. (version 2.0).
- Allen Coral Atlas. 2020. Imagery, maps and monitoring of the world’s tropical coral reefs. doi:10.5281/zenodo.3833242
- ATSEA. 2011. Transboundary diagnostic analysis for the Arafura and Timor Seas Region. Arafura Timor Seas Ecosystem Action (ATSEA) Program, Bali, Indonesia.
- ATSEA. 2023. Strategic Action Programme (SAP) for the Arafura and Timor Seas Region (ATS). 2024-2033. Arafura and Timor seas ecosystem action phase II (ATSEA-2) project. Arafura Timor Seas Ecosystem Action (ATSEA) Program, Bali, Indonesia. 78. pp.
- Australian Marine Parks. 2023. Australian Government Department of Climate Change, Energy, the Environment and Water. Accessed December 2019. https://www.environment.gov.au/fed/rest/document?id=%7BCD8877F3-8C39-4A20-A53F-070FBEE5AF3C%7D
- Australian National Offshore Petroleum Titles Administrator. 2019. Timor-Leste national petroleum authority. Accessed December 2019. https://www.nopta.gov.au/maps-and-public-data/spatial-data.html
- Ball, I. R., H. Possingham, and M. Watts. 2009. Marxan and relatives: Software for spatial conservation prioritization. In Spatial conservation prioritisation: Quantitative methods and computational tools, eds. A. Moilanen, K.A. Wilson, and H.P. Possingham, 185–95. Oxford, England: Oxford University Press.
- Bunting, P., A. Rosenqvist, R. Lucas, L.-M. Rebelo, L. Hilarides, N. Thomas, A. Hardy, T. Itoh, M. Shimada, and C. M. Finlayson. 2018. The Global Mangrove Watch – a new 2010 global baseline of mangrove extent. Remote Sensing 10 (10):1669. doi:10.3390/rs10101669.
- Commonwealth of Australia. 2019a. Department of Climate Change, Energy, the Environment and Water. Australasian underwater cultural heritage database. Accessed December 2019. https://www.environment.gov.au/shipwreck/public/wreck/search.do
- Commonwealth of Australia. 2019b. Native title determinations. Accessed December 2019. https://data.gov.au/data/dataset/native-title-determinations-national-native-title-register
- Convention on Biological Diversity (CBD). 2022. Decision adopted by the Conference of the Parties to the Convention on Biological Diversity 15/4. Kunming-Montreal Global Biodiversity Framework. https://www.cbd.int/doc/decisions/cop-15/cop-15-dec-04-en.pdf.
- Coral Triangle Initiative on Coral Reefs, Fisheries and Food Security (CTI-CFF). 2013. Coral triangle marine protected area system framework and action plan. C, United States Agency for International Development Coral Triangle Support Partnership and US National Oceanic and Atmospheric Administration, Cebu City, Philippines. 75. pp.
- Day, J. C., R. A. Kenchington, J. M. Tanzer, and D. S. Cameron. 2018. Marine zoning revisited: How decades of zoning the Great Barrier Reef has evolved as an effective spatial planning approach for marine ecosystem-based management. Aquatic Conservation: Marine and Freshwater Ecosystems 29 (S2):9–32. doi:10.1002/aqc.3115.
- Department of Sustainability, Environment, Water, Population and Communities (DSEWPaC). 2012a. Proposal to proclaim the final commonwealth marine reserves network consultation paper. Commonwealth of Australia, Canberra, Australia.
- Dive Logs. 2019. Accessed December 2019. https://divelogs.org/
- Dive Sites. 2019. Accessed December 2019. https://dive.site/
- Edgar, G. J., R. D. Stuart-Smith, T. J. Willis, S. Kininmonth, S. C. Baker, S. Banks, N. S. Barrett, M. A. Becerro, A. T. F. Bernard, and J. Berkhout. 2014. Global conservation outcomes depend on marine protected areas with five key features. Nature 506 (7487):216–20. doi:10.1038/nature13022.
- Edyvane, K. S., Y. Fajariyanto, L. Hakim, A. Prananda, C. Tania, and H. A. Susanto. 2024. Coastal and marine ecosystems of the Arafura and Timor Seas – characterization, key features and ecological significance. Coastal Management. his issue.
- Edyvane, K., and K. Dethmers. 2010. Identifying potential sites for marine protected areas in the Northern Territory. Department of Natural Resources, Environment, the Arts and Sport, Darwin, Northern Territory.
- ESDM One Map. Accessed December 2019. Minyak dan Gas Bumi https://geoportal.esdm.go.id/migas/
- Fajariyanto, Y., A. L. Green, F. Ramadyan, N. Suardana, L. Hakim, D. Akbarur, Rudyanto, and J. McGowan. 2019. Designing a network of marine protected areas for fisheries management area 715 and six associated provinces in Indonesia. USAID Sustainable Ecosystems Advanced Project, Jakarta, Indonesia.
- Fernandes, L., J. Day, A. Lewis, S. Slegers, B. Kerrigan, D. Breen, D. Cameron, B. Jago, J. Hall, D. Lowe, et al. 2005. Establishing representative no-take areas in the Great Barrier Reef; large-scale implementation of theory on Marine Protected Areas. Conservation Biology 19 (6):1733–44. doi:10.1111/j.1523-1739.2005.00302.x.
- Giakoumi, S., J. McGowan, M. Mills, M. Beger, R. Bustamante, A. Charles, P. Christie, M. Fox, P. Garcia-Borboroglu, S. Gelcich, et al. 2018. Revisiting “success” and “failure” of marine protected areas: A conservation scientist’s perspective. Frontiers in Marine Science 5:223 doi:10.3389/fmars.2018.00223.
- Gill, D. A., H. B. Mascia, G. N. Ahmadia, L. Glew, S. E. Lester, M. Barnes, I. Craigie, E. S. Darling, C. M. Free, J. Geldmann, et al. 2017. Capacity shortfalls hinder the performance of marine protected areas globally. Nature 543 (7647):665–9. doi:10.1038/nature21708.
- Global Fishing Watch (GFW). 2012-2016. Global datasets of AIS-based fishing effort and vessel presence. Accessed December 2019. https://globalfishingwatch.org/data-download/datasets/public-fishing-effort.
- Grantham, H. S., J. E. M. Watson, M. Mendes, F. Santana, G. Fernandez, P. Pinto, L. Riveiro, and C. Barreto. 2011. National ecological gap assessment for Timor-Leste 2010. Prepared for United Nations Development Program, Department of Protected Areas and National Parks of Timor-Leste by CNRM Solutions, Australia.
- Green, A. L., L. Fernandes, G. Almany, R. Abesamis, E. McLeod, P. Aliño, A. T. White, R. Salm, J. Tanzer, and R. L. Pressey. 2014. Designing marine reserves for fisheries management, biodiversity conservation and climate change adaptation. Coastal Management 42 (2):143–59. doi:10.1080/08920753.2014.877763.
- Green, A. L., Y. Fajariyanto, H. Lionata, F. Ramadyan, S. Tighe, A. White, T. Gunawan, Rudyanto, and N. Minarputi. 2020a. A guide, framework and example: Designing marine protected areas and marine protected area networks to benefit people and nature in Indonesia. Prepared by The Nature Conservancy for USAID Sustainable Ecosystems Advanced Project.
- Green, A. L., Y. Fajariyanto, S. Tighe, and A. T. White. 2020b. Biophysical criteria: Designing marine protected areas and marine protected area networks to benefit people and nature in Indonesia. Prepared by The Nature Conservancy for USAID Sustainable Ecosystems Advanced Project, Indonesia.
- Green, A., S. E. Smith, G. Lipsett-Moore, C. Groves, N. Peterson, S. Sheppard, P. Lokani, R. Hamilton, J. Almany, J. Aitsi, et al. 2009. Designing a resilient network of marine protected areas for Kimbe Bay, Papua New Guinea. Oryx 43 (04):488–98. doi:10.1017/S0030605309990342.
- Harris, P. T., M. Macmillan-Lawler, J. Rupp, and E. K. Baker. 2014. Geomorphology of the oceans. Marine Geology 352:4–24. doi:10.1016/j.margeo.2014.01.011.
- Indonesian Ministry of Marine Affairs and Fisheries (MMAF). 2020. Marine protected areas, international shipping lanes (ALKI), fisheries and transportation ports and cetacean migration corridors. In: Thematic map of coastal and small islands zoning plan. Unpublished data, Indonesian Ministry of Marine Affairs and Fisheries, Jakarta, Indonesia.
- Indonesian Navy. 2020. M ilitary areas, shipwrecks and seamines. Digitized from map of Indonesia coastal environment, hydrography and oceanography centre . Unpublished data, Indonesian Navy, Jakarata, Indonesia. Accessed December 2019.
- Johnson, J. E., D. J. Welch, R. van Hooidonk, D. Tracey, G. Chandrasa, B. Molinari, D. Triani, C. Tania, and H. Susanto. 2023. Climate change implications for the Arafura and Timor Seas region: Assessing vulnerability of marine systems to inform management and conservation. Climatic Change 176 (7):88. doi:10.1007/s10584-023-03554-9.
- Kasim, K., S. W. Trenggono, M. R. Putri, S. Nurdjaman, S. I. Wahyu, D. Wudianto, T. Nugroho, N. Yuwono, S. T. Winarsih, C. Haryuni, et al. 2024. Towards sustainable fishing practices in the Arafura Sea: Defining a catch quota allocation for Saddletail Snapper (Lutjanus malabaricus) in Indonesia. Coastal Management. This issue.
- Kementerian Kelautan dan Perikanan (KKP). 2023. Peta Jalan Ekonomi Biru. Menuju Indonesia Emas 2045. Kementerian Kelautan dan Perikanan, Jakarta, Indonesia. 204 pp.
- Marine Regions. 2024. Flanders Marine Institute. Accessed December 2019. http://www.marineregions.org.
- Marine Traffic. 2019. Global density maps. Accessed December 2019. https://help.marinetraffic.com/hc/en-us/articles/204802167-Display-Density-Maps-on-the-Live-Map.
- McLeod, E., K. N. Anthony, P. J. Mumby, J. Maynard, R. Beeden, N. A. J. Graham, S. F. Heron, O. Hoegh-Guldberg, S. Jupiter, P. MacGowan, et al. 2019. The future of resilience-based management in coral reef ecosystems. Journal of Environmental Management 233:291–301. doi:10.1016/j.jenvman.2018.11.034.
- National Oceanic and Atmospheric Administration (NOAA). 2012-2016. VIIRS night light imagery. National Geophysical Data Center. Accessed December 2019. https://www.earthdata.nasa.gov/learn/find-data/near-real-time/viirs
- OCHA Latin America and the Caribbean (ROLAC). 2019. World port index. Accessed December 2019. https://data.humdata.org/dataset/world-port-index
- Papua New Guinea Government (PNG). 2015. National marine conservation assessment for Papua New Guinea. Conservation and Environment Protection Authority.
- Roberts, C. M., B. C. O’Leary, D. J. McCauley, P. M. Cury, C. M. Duarte, J. Lubchenco, D. Pauly, A. Sáenz-Arroyo, U. R. Sumaila, R. W. Wilson, et al. 2017. Marine reserves can mitigate and promote adaptation to climate change. Proceedings of the National Academy of Sciences of the United States of America 114 (24):6167–75. doi:10.1073/pnas.1701262114.
- Spalding, M. D., H. E. Fox, G. R. Allen, N. Davidson, Z. A. Ferdaña, M. Finlayson, B. S. Halpern, M. A. Jorge, A. Lombana, S. A. Lourie, et al. 2007. Marine ecoregions of the world: A bioregionalization of coastal and shelf areas. BioScience 57 (7):573–83. doi:10.1641/B570707.
- Strain, E. M. A., G. J. Edgar, D. Ceccarelli, R. D. Stuart-Smith, G. R. Hosack, and R. J. Thomson. 2019. A global assessment of the direct and indirect benefits of marine protected areas for coral reef conservation. Diversity and Distributions 25 (1):9–20. doi:10.1111/ddi.12838.
- Susanto, H. A., C. Tania, C. I. Narcise, K. R. Aguiling, D. Triani, D. A. Gautama, K. Yhuanje, and E. M. Belo. 2024. ATSEA: A regional collaboration to address transboundary threats to ecosystems for human wellbeing in the Arafura-Timor Seas. Coastal Management. This issue.
- TeleGeography. 2019. Submarine cable map. Accessed December 2019. https://github.com/telegeography/www.submarinecablemap.com
- Thompson, D. M., J. Kleypas, F. Castruccio, E. N. Curchitser, M. L. Pinsky, B. Jönsson, and J. R. Watson. 2018. Variability in oceanographic barriers to coral larval dispersal: Do currents shape biodiversity? Progress in Oceanography 165:110–22. doi:10.1016/j.pocean.2018.05.007.
- Thompson, C. D. H., J. J. Meeuwig, A. M. Friedlander, and E. Sala. 2023. Remote seamounts are key conservation priorities for pelagic wildlife. Conservation Letters el2993. doi:10.1111/conl.12993
- Timor-Leste National Petroleum Authority. 2019. Accessed December 2019. http://www.anpm.tl/interactive-map/
- Treml, E. A., J. Roberts, P. N. Halpin, H. P. Possingham, and C. Riginos. 2015. The emergent geography of biophysical dispersal barriers across the Indo-West Pacific. Diversity and Distributions 21 (4):465–76. doi:10.1111/ddi.12307.
- UNEP-WCMC. 1999. Global distribution of sea turtle nesting sites (version 1.1). Cambridge (UK): UNEP World Conservation Monitoring Centre. Accessed December 2019. Data doi:10.34892/1731-mc59.
- UNEP-WCMC and IUCN. 2019. Protected planet: The world database on protected areas (WDPA). Accessed December 2019. http://www.protectedplanet.net
- Veron, J., L. M. Devantier, E. Turak, A. L. Green, S. Kininmonth, M. Stafford-Smith, and N. Peterson. 2009. Delineating the Coral Triangle. Galaxea 11 (2):91–100. doi:10.3755/galaxea.11.91.
- White, A., Rudyanto, M. F. Agung, N. Minarputri, A. P. Lestari, Wen Wen, Y. Fajariyanto, A. Green, and S. Tighe.. 2021 Marine protected area networks in Indonesia: Progress, lessons and a network design case study covering six eastern provinces. Coastal Management, 6, 575, 597, 49: doi:10.1080/08920753.2021.1967560.
- Wilson, J., A. Darmawan, J. Subijanto, A. Green, and S. Sheppard. 2011. Scientific design of a resilient network of marine protected areas for the Lesser Sunda Ecoregion of the Coral Triangle. The Nature Conservancy, Jakarta, Indonesia, 96 p.
- World Port Index. 2019. Accessed December 2019. https://msi.nga.mil/Publications/WPI
- World Resources Institute. 2019. Global energy observatory, Google, KTH Royal Institute of Technology, Stockholm, Enipedia. Global power plant database. Accessed December 2019. https://datasets.wri.org/dataset/globalpowerplantdatabase
- Yayasan Konservasi Alam Nusantara (YKAN). 2017a. Lesser sunda ecoregion habitat benthic mapping. Unpublished data, YAKAN, Jakarta, Indonesia. Accessed December 2019.
- Yayasan Konservasi Alam Nusantara (YKAN). 2017b. Estuary distribution mapping. Unpublished data, YAKAN, Jakarta, Indonesia. Accessed December 2019.
- Yayasan Konservasi Alam Nusantara (YKAN). 2020. Indonesia mangrove distribution mapping. Unpublished data, YAKAN, Jakarta, Indonesia. Accessed December 2019.