
Abstract
The radial growth and advancement of the adhesive interface to the substratum of many species of acorn barnacles occurs underwater and beneath an opaque, calcified shell. Here, the time-dependent growth processes involving various autofluorescent materials within the interface of live barnacles are imaged for the first time using 3D time-lapse confocal microscopy. Key features of the interface development in the striped barnacle, Amphibalanus (= Balanus) amphitrite were resolved in situ and include advancement of the barnacle/substratum interface, epicuticle membrane development, protein secretion, and calcification. Microscopic and spectroscopic techniques provide ex situ material identification of regions imaged by confocal microscopy. In situ and ex situ analysis of the interface support the hypothesis that barnacle interface development is a complex process coupling sequential, timed secretory events and morphological changes. This results in a multi-layered interface that concomitantly fulfills the roles of strongly adhering to a substratum while permitting continuous molting and radial growth at the periphery.
Introduction
Barnacles, which are an infraclass of Arthropoda called Cirripedia, have significantly different attachment biochemistry (Kamino Citation2008, Citation2013) than mussels or sand castle tubeworms (Stewart et al. Citation2011; Nicklisch & Waite Citation2012). Arthropod growth occurs concurrently with periodic molting events that replace the chitinous exoskeleton. Cirripedes undergo this process differently from other crustaceans by retaining the outer, armored shell and shedding the cuticle covering the soft body tissues inside the shell and at the attachment point (Bocquet-Védrine Citation1965; Blomsterberg et al. Citation2004). In acorn barnacles, the shell expands circumferentially by extending growth zones between the calcareous plates covering the barnacle body; striations on the shell mark cyclic growth periods (Darwin Citation1854). Acorn barnacles grow in height by extending the parietal (side) plates where they meet the substratum, while stalked barnacles have an additional growth zone in the peduncle (Blomsterberg et al. Citation2004). In acorn barnacles, such as Amphibalanus improvisus (= Balanus improvisus) (Costlow & Bookhout Citation1953) and A. amphitrite (Costlow & Bookhout Citation1956), shell size appears to increase continuously and can proceed under constant environmental conditions (Clare et al. Citation1994).
Radial expansion of barnacles with membranous bases or calcified base plates is accompanied by the appearance of concentric rings associated with molting called ecdysal lines (Darwin Citation1854); they are sometimes referred to as cuticular slips and arise from expansion and fracture of old cuticle in the basal growth zone (Bocquet-Védrine Citation1965; Bourget Citation1987; Anderson Citation1994). Capillary structures linked to cement glands (Lacombe & Liguori Citation1969; Lacombe Citation1970; Saroyan et al. Citation1970; Walker Citation1970; Fyhn & Costlow Citation1976) have duct orifices terminating at the circumferential ecdysal lines in the basal growth zone junctions.
In this work, basal growth zones of live juvenile barnacles were monitored during a single growth cycle using techniques that enable simultaneous temporal, spatial, and spectral measurements. Arthropod cuticle is autofluorescent (Zill et al. Citation2000; Michels & Gorb Citation2012), which has allowed anatomical structure to be mapped by confocal microscopy in 3D. Autofluorescence of barnacle shells and interfacial tissues has also been noted (Fernandez et al. Citation2002). Burden et al. (Citation2012) identified autofluorescent secretions in A. amphitrite that showed periodic variations at the 2D interface. This paper describes real-time confocal microscopy that reveals processes within the interface involving both autofluorescent cuticle membrane development and fluid secretion processes. The approach revealed expansion of parietal plates, advancement and deformation of epicuticle at the substratum interface, the appearance of new capillary ducts, and finally biomineralization above the newly deposited cuticular membrane. Ex situ analyses of the interfacial features confirm the presence of protein, cuticle and biomineralized components observed in situ.
Materials and methods
Cyprid settlement and barnacle maintenance
Barnacle cyprids, Amphibalanus (= Balanus) amphitrite, were settled onto borosilicate glass coverslips and T2® silicone film coated glass panels and raised as described previously (Holm et al. Citation2005) until they could eat nauplii of Artemia spp. The silicone panels and coverslips were shipped to NRL and submerged in 32 ppt artificial seawater (Instant Ocean Aquarium Sea Salt Mixture, Instant Ocean, Blacksburg, VA) in distilled water. Barnacles were maintained under ambient light at room temperature with water changes twice a week. Normal base plate development is observed for polystyrene and polycarbonate substrata (Hui et al. Citation2011), as well as borosilicate glass, CaF2, germanium, and silicon (Barlow & Wahl Citation2012), thus normal base plate development is expected for barnacles on the various surfaces described in this work. It has been noted that none of these substrata resulted in barnacles with concave base plates and opaque adhesive phenotypes often observed on poly(methyldisiloxane)(PDMS) or ‘silicone’ surfaces. By contrast barnacles develop normal base plate morphologies on rigid, non-toxic substrata (Wendt et al. Citation2006; Holm et al. Citation2009). New growth measured and monitored in these experiments proceeded as expected for rigid surfaces (see review by Kamino Citation2013). In situ optical observations reported here were performed through borosilicate glass coverslips. For ex situ evaluation of the interface, barnacles were transferred from silicone panels to gold-coated glass to facilitate analytical microscopy of new growth regions as described below.
In situ time lapse confocal microscopy
Barnacles on coverslips were examined in situ using an Eclipse C1si confocal microscope (Nikon Instruments, Melville, NY, USA) within two weeks of metamorphosis from cypris larvae to juvenile barnacles. Spectrally resolved autofluorescence was collected with sub-micron spatial resolution in three dimensions. Throughout the period of observation, barnacles were submerged in seawater and fed inside a polypropylene tube attached to the coverslip using RTV silicone rubber (Permatex, Hartford, CT, USA). The edge of the adhesive interface of a barnacle was positioned in the field of view under 60 × magnification. Over the 36–72 h experiments, a three-dimensional (3D) volume of autofluorescence data was collected at 30 min time intervals under 402 nm laser excitation. Data at each time point consisted of a series of 19 focal planes (500 nm thick, 512 × 512 pixels) spanning ~ 5–10 μm from the barnacle/substratum interface to the barnacle interior. The time required to capture each dataset was ~ 2–3 min, after which the laser excitation was removed until the next 30 min time interval and limiting tissue exposure to the excitation laser to ~ 10% of the total observation period. Spectral information was collected simultaneously with 32 spectrally resolved fluorescence channels (bins) within each focal plane covering a spectral range from 405 to 565 nm (with 5 nm resolution). Thus, data collected at each time point consisted of a 3D volume of voxels with both spatially and spectrally resolved information. The main advantage of using the spectral approach was that it enabled monitoring the different autofluorescent portions of the barnacle with spatial accuracy under single excitation wavelength. Following an entire experiment, the autofluorescent intensity from the imaged area was compared to surrounding tissue to assess evidence of photobleaching and was found to be minimal.
Fluorescence data were collected using commercial software (EZ-C1, Nikon, v.3.60) and processed using FIJI open source imaging software (Schindelin et al. Citation2012) to produce images and time-lapse video of the interface rendered from selected perspectives. The 32 spectral channels were rendered to maintain a spectrally accurate representation of the fluorescence. Each spectral channel was assigned an 8-bit look-up table created from the RGB color closest to the bin mid-point wavelength between 408 and 563 nm (http://rohanhill.com/tools/WaveToRGB/). Channel images were summed to produce a spectrally accurate frame for each focal plane and each time point, then summed over the depth to create a composite color image for each time interval. Images are presented as either a single slice of autofluorescence through the 3D volume or as a composite image with the autofluorescence summed through the volume along an indicated axis. The composite images were animated at eight frames per second to create time lapse videos. Contrast enhancement (0.1% saturation) was performed to aid visualization.
To construct cross sectional images of the 3D confocal datasets, a line of pixels was selected perpendicular to the shell growth direction on each of the processed, RGB z-axis focal plane images to create a color composite cross section. Then, five additional composites were created from the immediately adjacent parallel planes, and these six images were summed in order to improve the signal to noise ratio and contrast enhanced as described above.
Ex situ sample preparation
Barnacles 4–7 mm in diameter were removed from silicone panels, rinsed with distilled water, and reattached onto clean gold-coated glass slides (Ted Pella, Redding, CA). Barnacles grew for four additional weeks, allowing formation of 10–15 new adhesive growth rings. When barnacles were firmly attached (about a week), growth proceeded as on other rigid non-toxic surfaces. The new interface built by the barnacle many cycles after the reattachment process was not visibly different in any way than that developed by barnacles settled from cyprids onto an equivalent surface. Then the upper portion of each barnacle was removed, and the remaining base plate and adhesive were rinsed with distilled water and dried in air. Samples were examined using optical microscopy, Fourier transform infrared (FTIR) microscopy, and X-ray photoelectron spectroscopy (XPS). Where noted, samples were decalcified with 0.1 M ethylenediaminetetraacetic acid (EDTA).
Optical microscopy
Barnacle base plates were imaged from above (proximal side of base plate), with bright field reflection and epifluorescence microscopy using a Nikon AZ100 microscope. Fluorescence images were acquired using a green-fluorescent protein (GFP) filter set (excitation 450–490 nm, dichroic 495 nm, and emission bandpass 500–550 nm).
FTIR microscopy
The base plate samples on Au-coated glass were examined using transreflectance FTIR spectroscopy with a Thermo Scientific 6,700 (FTIR spectrometer, Waltham, MA) outfitted with a Continuum microscope, and a liquid nitrogen cooled mercury cadmium telluride detector. After removal of the upper portion of the barnacle, an area ~ 150 × 200 μm at the periphery of the interfacial layer remaining was imaged in 5 μm steps from the outer edge using a 10 × 150 μm aperture with the long axis of the aperture parallel to the growth edge of the barnacle. Each spectrum is composed of 1,024 scans at 4 cm−1 resolution with 2 × zero filling and Happ-Genzel apodization. Reference spectra were acquired on the gold surface adjacent to the adhesive. Spectra were converted to units of –log(R/R0), equivalent to absorbance, where R and R0 are the intensities of reflected light from the sample and reference, respectively. No baseline corrections or further processing were applied.
X-ray photoelectron spectroscopy
XPS of base plates was performed with a monochromated Al Kα X-ray source calibrated at 1486.6 ± 0.2 eV. The X-ray source illuminated a spot of about 40 × 60 μm2 on the samples; three separate spots were analyzed in each region of interest. Spatially uniform charge neutralization was provided by beams of low-energy (≤ 10 eV) electrons and Ar+ ions. Survey and high resolution scans were acquired at pass energies of 200 and 20 eV, respectively. Prior to spectral analysis, surface contaminants were removed by a 10 s sputter with low-energy Ar+ ions (200 eV). High resolution spectra of C 1s, O 1s, N 1s, S 2p, Ca 2p, Cl 2p, Na 1s, Mg 1s, and P 2p were obtained for elemental and chemical composition analysis with peak fitting by Unifit (Ver. 2011, www.uni-leipzig.de/~unifit/downloads.htm) using a combination of Lorentzian and Gaussian line shapes to fit individual components.
X-ray diffraction
A separate preparation was necessary to obtain samples of the adhesive interface layer suitable for analysis by X-ray diffraction. Barnacles on silicone panels were removed from their shells, leaving only the base plates adhered to the panels. Panels were allowed to completely dry. Drying in this manner resulted in separation of a fraction of the base plates from the panels and delamination of the underlying adhered layer from the calcified base plate. Thick and thin regions of the interfacial layers were selected for analysis, corresponding to regions in the central, interior region of the barnacle (just after metamorphosis) and more recent growth regions, respectively. Samples were coated with high viscosity microscope oil (Paratone-N, Hampton Research, Aliso Viejo, CA) and placed on a MicroMesh mount (MiTeGen, Ithaca, NY, USA). X-ray diffraction data were collected using CuKα radiation (λ = 1.54178 Å) and a Bruker platinum-135 CCD area detector. Images were un-warped and then integrated using the XRD2 plug-in for the APEX data collection suite (Bruker AXS, Madison, WI, USA). In addition to the thick and thin base plate samples, diffraction data were collected on α-chitin and chitosan reference materials (Deschamps Citation2013) as well as an air scatter background image.
Atomic force microscopy (AFM)
AFM images on base plate samples of barnacles adhered to Au-coated glass were acquired of the peripheral regions, in air, using intermittent contact mode imaging conditions with a Nanoman with Dimension V controller and TESP cantilever (Bruker). Image analysis was performed with WSxM software (Horcas et al. Citation2007).
Results
4D confocal microscopy
Following a latent period at the start of each experiment, a similar pattern of growth was observed for all barnacle samples. Four main features were common in the growing interface: (i) continuous radial advancement of the parietal shell; (ii) extension and stretching of autofluorescent striations directly behind the leading edge of the parietal shell; (iii) appearance of strong autofluorescence within a newly formed capillary and duct and subsequent secretion of this material to the interface; and (iv) advancement of a ‘wave’ of weakly autofluorescent particles originating behind the newly formed autofluorescent capillary. Figure shows fluorescent micrographs of a representative time lapse experiment (see accompanying Supplementary Video S1; Supplementary material is available via a multimedia link on the online article webpage). The growth events outlined above and depicted in Figure and Video S1 are described below in more detail, with the time of initial motion of the side plate set to t = 0 h for reference.
Figure 1. Confocal microphotographs showing time series of spectrally accurate autofluorescence at the leading edge of A. amphitrite. (A) At t = 0, two prominent features are present: a bright band at the periphery (arrow 1) and circumferentially striated bands (arrow 2). (B) At t = 12.5 h, there is the appearance of autofluorescence within a new duct and capillary (arrows 3 and 4, respectively). Additionally, the innermost striated band has stopped advancing (arrow 5) relative to the leading edge. (C) By t = 15 h, a second set of striations appear (arrow 6) and the region surrounding the duct orifice shows autofluorescence matching the spectral signature within the duct/capillary (arrow 7). (D) At t = 18 h, dislocated fragments of the initial striated material are observed (arrow 8) as well as the presence of a weakly fluorescent granular-appearing wavefront that advanced toward the new capillary/duct boundary at a variable rate (arrow 9).
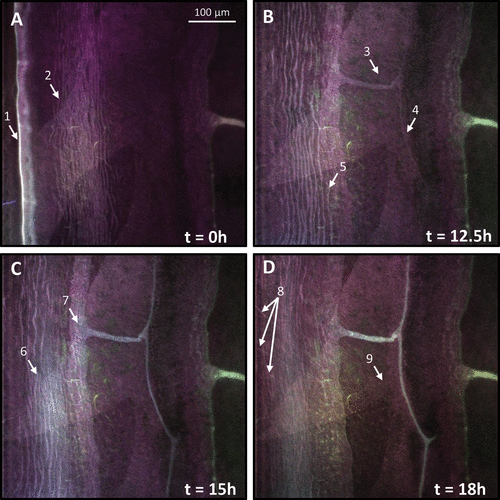
Barnacle peripheries exhibited a very bright autofluorescent band (Figure A, arrow 1) where the parietal plate made contact with the substratum surface. At the start of an experiment, there was typically a period of ~ 12 h during which the barnacles did not visibly grow. Barnacles expand their bases fairly continuously under consistent laboratory conditions (Burden et al. Citation2012). However, when barnacles were moved from one laboratory or building to another, a period of no growth was often observed for several hours. This may be due to environmental changes, eg temperature and light levels that differ between locations. Barnacles grew laterally at a nearly constant 1–2 μm h−1 and the perimeter of the barnacle eventually advanced beyond the field of view. The remaining images in Figure show the interface at times 12.5, 15, and 18 h after lateral motion of the side plate initiated.
Several additional autofluorescent features were observed, some moving across the image and others appearing, then becoming fixed in place. Beginning ~ 25 μm from the barnacle perimeter and extending inwards, multiple autofluorescent circumferentially striated bands, each 1–3 μm wide, were observed (Figure A, arrow 2). This banded pattern advanced at approximately the same rate as the parietal plate expansion from t = 0 h until t = 12.5 h (Figure B). At the appearance of autofluorescence within a new duct and capillary (Figure B, arrows 3 and 4, respectively) the innermost band stopped moving (Figure B, arrow 5) relative to the expanding shell, while the more peripheral bands continued to expand. The striated bands continued to separate until t = 15 h (Figure C), when a second set of striations appeared, overlapping the initial set (Figure C, arrow 6). The nascent autofluorescent bands had a higher lateral density and a slightly red-shifted emission spectrum compared to the older set of bands. After the appearance of the new bands, the initial striated material became discontinuous as the barnacle grew, leaving fragments (Figure D at t = 8 h, arrow 8).
The new capillary and duct appearing at t = 12.5 h (Figure B, arrows 3 and 4 respectively), and the region within and around the orifice of the duct became autofluorescent over the course of ~ 3 h, beginning at t = 15 h (Figure C, arrow 7). Fluorescence within the duct and capillary structures steadily increased until t = 20 h. Previous experiments revealed that capillary formation can be observed by both optical and fluorescence microscopy and occurs behind the growth front (Burden et al. Citation2012). However, how long the capillary/duct system is in place before autofluorescence is detectable remains unknown. In Video S1 the capillary shifted and flexed after its appearance, then remained stationary for the remainder of the experiment.
Finally, at time t = 18 h (Figure D, arrow 9), a wavefront appeared, advancing towards but not reaching the periphery of the barnacle. This lagging autofluorescent front appears granular, advancing at variable rates, initially slowly relative to the overall rate of expansion. In the final 8 h of the experiment, the front accelerated to the region occupied by the new capillary and duct.
The autofluorescent features described above were grouped into two general spectral ranges. The parietal shell and capillaries/ducts (i–iii, (see section headed 4D confocal microscopy)) exhibited a relatively strong fluorescent signature with a peak emission at ~ 480–500 nm under 402 nm excitation. The particle wavefront (iv, (see section headed 4D confocal microscopy)) exhibited much weaker fluorescence with a peak emission in the range of ~ 410–450 nm under 402 nm excitation. When observed in three dimensions, an additional feature, an underlying but continuous layer located right at the barnacle substratum interface, also exhibited a very weak spectral signature similar to the particle wavefront.
A map of the autofluorescence in three dimensions was constructed; the geometry is depicted in Figure S1A (Supplementary information). Figure S1B resolves autofluorescent features along the z-axis (perpendicular to the interface). The upper left and lower right panels are composite ‘before’ and ‘after’ images of barnacle autofluorescence in the x,y plane over ~ 40 h. Slices through the x,z and y,z planes of the reconstructed images were extracted from the dataset, marked by the yellow horizontal (x,z plane) and vertical (y,z plane) lines intersecting the images in the upper left and lower right panels. A sequence of time-resolved images of the x,z (lower left quadrant) and y,z (upper right quadrant) provide a view into the depth-related fluorescence. Video S2 of the process is presented in the Supplementary material.
The leading edge of the barnacle contains a highly autofluorescent component with a peak emission at ~ 495 nm. Fluorescence is not confined to the surface, but extends in the + z direction, into the organism. The shape of the fluorescent profile of the leading edge changes as the barnacle grows. Starting as a relatively clean vertical boundary in the +z direction (t = -15 h), the profile advances past vertical and becomes slightly less defined (t = 2–6 h) as it advanced beyond the viewable area. It is characterized also by an inwardly curved region 30–50 µm wide under the barnacle leading edge. A thin layer of nearly continuous autofluorescent material is observed directly under the leading edge, extending radially inward towards the center of the barnacle along the substratum interface. The fluorescence of this layer is blue-shifted relative to the other more prominent autofluorescent interfacial components.
Accompanying the expansion of the barnacle perimeter are changes to the striated fluorescent material involving not only the radial spacing and position of the striations as shown in Figure , but also their location within the interface. During the latency period when there were no noticeable changes to the barnacle, the striated material appeared slightly raised from the interface at the substratum. Once the leading edge began to advance, the striated material was displaced and moved towards the substratum interface (t = 0 onward). Figure A and Video S3 show that the lateral advancement of the leading edge of the parietal shell is accompanied by advancement of the raised, striated layer. Some regions show discontinuities forming in the layer closest to the substratum (Figure B and Video S4). Once formed, the discontinuities remain fixed in place (arrow, last three segments of Figure B) while the upper striated layer continues to advance with the side plate (Figure C).
Figure 2. Autofluorescent images highlighting lateral growth of the leading edge with respect to the striated layers. The upper left panel shows autofluorescence at two time points (t = 0 and 7.5 h) with three different locations over which fluorescence was tracked. Lines A, B, and C correspond to cross-sectional x,z planes of fluorescence in panels A, B, and C. Panel A: striated bands show clear separation from underlying fluorescence. Panel B: discontinuities in the striated layers (white arrows). Panel C: leading striated layer advances in synchrony with leading edge of barnacle (white arrows).
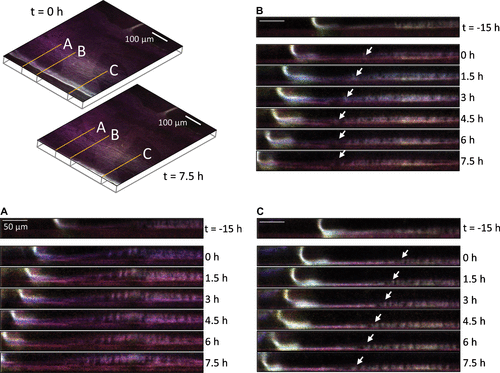
The 3D confocal analysis revealed additional information about the positioning of the capillary ducts and advancing wave of granular particulates. The duct of the capillary opens to the interface at the substratum, and the capillary extends upward into the barnacle (Figure S1B, region 3). The wave of particulate material (Figure S1B, region 4 and Video S2) advances from right to left a few micrometers above the preexisting autofluorescent features in the interface, flowing over and covering the capillary structures (Video S5). The structures observed in this dynamic process were examined ex situ, after removing the side plates and soft tissues.
Optical microscopy and AFM
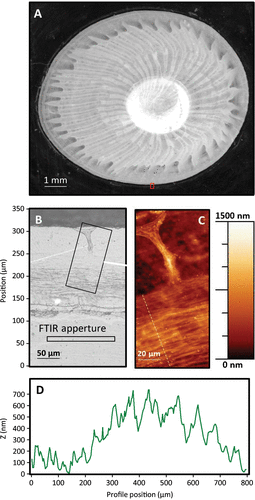
Figure A shows an optical micrograph of a base plate. The analysis region (red rectangle, bottom center) is shown at higher resolution in Figure B. The lower portion of Figure B (between 0 and ~ 110 μm) corresponds to the bare gold surface not covered by the barnacle, while the region at the very periphery of the barnacle (between 125 and 165 μm) is essentially featureless. Banded, wrinkled material can be seen between ~165 and 250 μm, which directly corresponds to autofluorescent striations identified in Figures and S1. The wrinkled region extends to where the capillary duct terminates. The duct connects to a capillary at ~ 300 μm, and above that location the dark region in the optical micrograph corresponds to the leading edge of the calcareous portion of the base plate. AFM microscopy from the marked rectangular region in Figure B is shown in Figure C and confirms the wrinkled topography of the periphery. A cross section of the topographic image, marked by the dashed line in Figure C, is shown in Figure D. The material at the periphery is thicker than that under and near the capillary by 500–600 nm, and the folds or wrinkles show lower slopes towards the interior of the barnacle in the region of the profile positioned between 300 and 700 nm.
Figure 3. (A) Optical micrograph of a barnacle base plate on a gold substratum. The callout region in panel (A) is shown at higher magnification in an optical micrograph (B) and from within the dashed region an AFM image (C). The rectangular regions in (B) represent the microscope aperture size used in IR absorption microscopy, with the aperture path used to create the 2D IR absorption map shown in Figure centered and perpendicular to the long axis of the rectangle.
FTIR microscopy
Spatially resolved IR absorption spectra of the outer, most recent growth regions on barnacle base plates from barnacles on gold substrata were measured. The collection aperture is depicted in Figure B as a solid black rectangle. The resulting line map, depicted in Figure A, shows significant chemical heterogeneity in the interfacial material. Chemical signatures were categorized into five general regions that match the morphological domains described above and are delineated in the optical micrograph on the left in Figure A. Figure B shows peaks at 2,512, 1,795, 881, and 712 cm−1 (marked by arrows), indicating a calcite containing region of the barnacle basis (Anderson & Brečević Citation1991; Manoli et al. Citation1997; Simpson Citation1998; Khalifa et al. Citation2011). Additional absorbance bands consistent with organic components are also observed (Amide I, II and III, CHx, Amide A and OH stretch) (Byler & Susi Citation1986). This spectrum shows deviations from the typical spectra of calcite materials ideally prepared for IR spectroscopy. The large baseline offset from zero indicates light scattering, which may also be a cause of the baseline sloping (Bassan et al. Citation2010). Also, the intensities of the 2,512 and 1,795 cm−1 peaks are usually very weak but appear strong in comparison to the 881 cm−1 peak intensity, possibly due to sample anisotropy. The other three spectra (C–E) look more similar to each other and lack vibrational bands associated with calcite. In addition to the expected organic components (Amide I, II, III, CHx, Amide A), the regions containing autofluorescent striations (D) have large absorbances near 3,500 (region marked by leftmost arrows in (D) and (C) for comparison), and a quartet of peaks at 1,150, 1,110, 1,075, and 1,025 cm−1 (right-most arrows with brackets) while the region containing the capillary and duct (C) and periphery (E) have markedly smaller absorbances at those wavelengths.
Figure 4. (A) 2D IR absorption map of the region denoted in Figure 4 (B), including a reference micrograph to the left. Dotted lines demarcate several regions in the optical micrograph, with representative IR spectra in panels B–E.
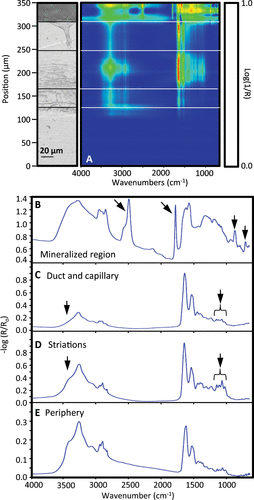
Figure A shows an optical micrograph of a barnacle–substratum interface after decalcification with EDTA. At the periphery, on the right side, a portion of the uppermost, wrinkled interfacial layer was peeled back from the surface, exposing the underlying layer. The chemical compositions of the two distinct layers, determined using transmission-reflection FTIR microscopy (Figure A, 100 × 100 μm collection aperture), are shown in Figure B and 5C. The red spectrum (Figure B) comes from the undisturbed, intact interface, and the purple spectrum (Figure C) was collected from the exposed, underlying layer. The underlying layer material (purple spectrum, Figure C) is consistent with barnacle adhesive protein absorption spectra (Barlow et al. Citation2009; Barlow & Wahl Citation2012). The intact interface (Figure B) contains additional features including the quartet of peaks between 1,000 and 1,200 cm−1, as well as a large shoulder at about 3,450 cm−1. Other features are far more prominent in the spectrum of the intact interface (Figure B), such as peaks at 1,370, 1,300, and 3,100 wavenumbers, but these overlap absorbing regions in the spectrum of the exposed underlying interfacial material, and may not be unique to either layer. Figure D is a difference spectrum resulting from a 1:1 subtraction of 5C from 5B; it is mostly composed of vibrational modes corresponding to the top layer. The absorbance spectrum of Limulus polyphemus α-chitin (Figure E) shares nearly all spectral features with the difference spectrum. The chemical structure of α-chitin is shown in Figure F. Table catalogs the absorbance features found in the barnacle adhesive layer and reference chitin. The two most noticeable differences between the difference spectrum in Figure D and the α-chitin reference are (1) the shoulder on the Amide II band at 1,515 cm−1, which is associated with tyrosine side-chains (Barth & Zscherp Citation2002); and (2) the CH stretch region, with prominent CH2 character between 2,800 and 3,000 cm−1.
Figure 5. (A) Optical micrograph of an etched barnacle base plate on a gold substratum, which has a folded-back portion of the multicomponent adhesive revealing the underlying layer. IR absorption spectra from the red callout (B) and purple callout (C) are shown below. Spectrum (D) is a 1:1 difference spectrum between spectra (B) and (C), and (E) is a reference α-chitin spectrum (Limulus polyphemus). Arrows in (B) and (E) denote absorption features discussed in the text. For reference, panel (F) shows the polysaccharide chitin, depicting a single glycosidic bond between two monomers.
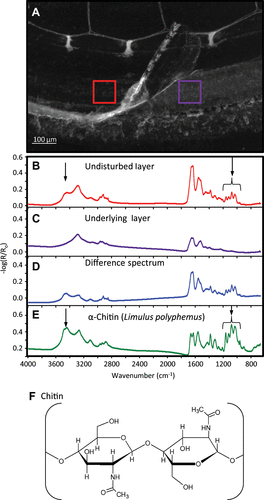
Table 1. Assignments for the main IR absorption spectra features (cm−1) of the organic membrane in Figure 5.
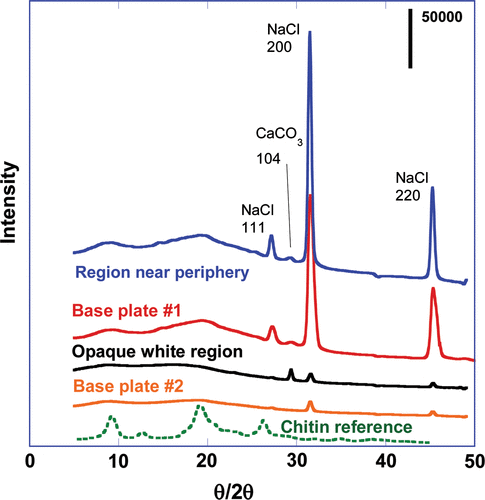
X-ray diffraction
Diffraction patterns from four regions of the barnacle base plate are shown in Figure along with the diffraction pattern of L. polyphemus chitin for comparison. All four regions showed evidence consistent with the presence of sodium chloride (peaks at about 27°, 31.5° and 45.2°), and samples showing stronger diffraction contrast also exhibited a peak consistent with the 104 reflection of calcite (~ 29.3°), strongest in the spectra from the opaque white region. Two broad peaks at about 9° and 19°, seen most prominently in the upper two spectra, are in good agreement with the most intense peaks in the pattern from Limulus chitin.
Figure 6. XRD spectra of barnacle adhesive interface materials and reference chitin.
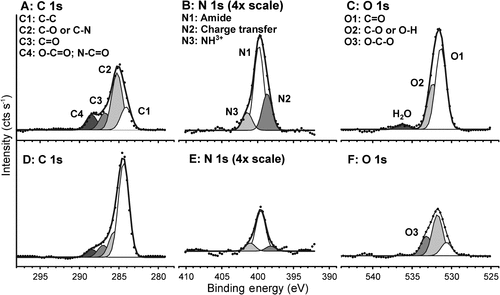
X-ray photoelectron spectroscopy
Spectral scans were acquired along the outermost non-calcified region and above the mineralized region at the periphery of the intact barnacle base plate (corresponding to Figure E and B, respectively). Majority species (80–90 at.%) in both regions were C, O and N (Table ). C/N and C/O ratios for the non-calcified region were consistent with the average amino acid stoichiometries (Table ), whereas the C/N ratio for the mineralized region was significantly higher, indicating the prevalence of additional carbonaceous species. Minority fractions included S with a primary component corresponding to sulfate groups and a small secondary component consistent with cysteine, Cl and Na having binding energies consistent with salt, as well as Ca and Mg with binding energies consistent with carbonates (ie calcite). Also, the presence of P, with binding energy consistent with phosphates, was detected in the outermost non-calcified region at small amounts, ca 0.5 at.%.
Table 2. Elemental compositions (atomic %), as measured by XPS, of different regions of barnacle baseplates.
Table 3. Elemental ratios (at.%) for C, N, O components measured by XPS and theoretical values.
Representative high resolution scans of the C 1s, N 1s and O 1s binding energy regions for the periphery are shown in Figure A–C and calcified regions in Figure D–F. The high resolution scans show that the non-calcified periphery has C 1s binding energies (Figure A) consistent with proteinaceous chemistries (Fears, Clark, et al. Citation2013; Fears, Petrovykh, et al. Citation2013), but with elevated C/N ratios (Table ) suggesting either that there are an abundance of aromatic residues (C/N ratio of Phe = 9, Trp = 11, and Tyr = 9), or that other carbonaceous chemistries are present. The N 1s peak (Figure B) shows the presence of neutral (white) and charged (purple) amide groups, as well as amide groups that are strongly interacting by non-covalent bonds (Fears, Clark, et al. Citation2013; Fears, Petrovykh, et al. Citation2013). The O 1s peak (Figure C) is dominated by species expected for proteins. In contrast, the region above the calcified material exhibit spectra with much greater aliphatic carbon content (Figure D) and of chemical species in the O 1s region consistent with O-C-O (Figure F).
Figure 7. High-resolution X-ray photoelectron spectroscopy of C, N, and O from a barnacle base plate on a glass substratum. XPS detects multiple chemistries in the undisturbed adhesive layer at the periphery (A–C), and the adjacent mineralized region (D–F).
Discussion
The growing interface in A. amphitrite develops in conjunction with a nearly continuous advancement of the side plates consistent with prior measurements (Costlow & Bookhout Citation1956; Thiyagarajan et al. Citation2003). The transition between the lower terminus of the parietal plate and the basis is marked by a brightly fluorescing band of material that curves underneath the shell and rides along the substratum as growth advances. Beneath the curved region is a thin, fairly continuous autofluorescent layer at the substratum surface that extends radially under the barnacle (Figures S1, S2). The lateral advancement of the periphery is accompanied by lateral displacement of a second thick layer with discontinuous autofluorescent features above the first layer. Ex situ optical analysis of the periphery also revealed two layers, and FTIR absorption spectra demonstrated that the uppermost layer was rich in acetal moieties] and free hydroxyl groups, consistent with chitinous chemistries, while the lower layer appeared to be mainly proteinaceous. Confocal microscopy reveals development and expansion of the basal cuticular membrane, as well as stretching of new cuticle above the old cuticle. The new cuticle has features consistent with prior descriptions of pleated, cuticle development in arthropods prior to molting (Bocquet-Védrine Citation1965; Bourget Citation1987). Ex situ FTIR analysis of the growing edge showed peaks corresponding to acetal C-O vibrations indicative of glycosidic bonds (Pearson et al. Citation1960; Socrates Citation2001) and a peak at 3,450 cm−1 corresponding to OH stretching, features characteristic of chitinous cuticle (Figure ). Both the OH stretch and acetal quartet change in intensity over the analyzed region (Figure ). The two chitinous spectral features have fairly low intensity where the most recent duct and capillary system has formed but show significant absorbance increases in the region where the cuticle appears wrinkled. The chitin absorption signature extends to the very periphery of the barnacle, albeit at a lower intensity (Figure E). The chitin of A. amphitrite is consistent with α-chitin, and differs from the report of β-chitin in Austromegabalanus psittacus (Fernandez et al. Citation2002). Both the FTIR and XPS data indicate protein incorporation in the newly developing interface, consistent with the interpretation that the region of the new interface closest to the surface was enriched in protein.
The advancement of the side plates is accompanied by fluorescence changes that suggest deposition of material immediately under the advancing edge of the periphery. Barnacles that have been removed from their substrata at times appear to secrete liquid in the region where the side plates meet the basis, a few micrometers from the edge, but well away from the most recently developed ring of capillaries and ducts. Bourget (Citation1987) describes this region as unattached in all barnacles; in A. amphitrite this region of the membrane is more readily lifted from the substratum (eg Figure ) than the portions of the membrane that are nearer the most recent set of capillary ducts. Nevertheless, there is substantial proteinaceous material remaining on the underlying surface. Prior studies demonstrated both secretory activity and adhesion during barnacle reattachment, before the optical appearance of new ducts in A. amphitrite; it is inferred that this deposit is related to the secretion identified previously (Burden et al. Citation2012) that was described as Barnacle Cement Secretion 1 (BCS1). Those experiments demonstrated that the secretion from the periphery of the barnacle provides some adhesion between barnacle and substratum, while the present experiments show this adhesion is not so great as to limit slip and expansion of cuticular membrane against the substratum during growth. The observations of a viscous nature to the barnacle adhesive surface as described by Sun et al. (Citation2004) and Kavanagh et al. (Citation2005) upon removal from silicones may also be relevant here, although the effect of silicones on the properties of the adhesive proteins is unknown. The spectral features observed by FTIR and XPS are consistent with proteinaceous chemistries. There are multiple proteins associated with the cuticle of Crustacea, including settlement inducing proteins in barnacles (Dreanno et al. Citation2006), but the specific components that could be related to prior biochemical assays of barnacles (Kamino et al. Citation2012), and their relationship to the cuticle membrane, have yet to be identified.
Confocal microscopy showed that the developing cuticle membrane was flexible, and at times raised from the lower substratum (Figures S1 and S2; Video S2). The region between the slightly raised new cuticular membrane and the underlying layer was not autofluorescent. This region is the exuvial space, most probably containing fluids related to the molting process. In arthropods the exuvial space typically contains enzymes that play a role in softening old cuticle, as well as polyphenols that can be oxidized and crosslink to harden the new cuticle (Lindner Citation1984; Andersen Citation2010). Dickinson (Citation2008) reported strong oxidase activity at the periphery of adult barnacle base plates by tetramethylbenzidine (TMB) staining, consistent with this line of reasoning.
At the same time, the change in nature of the cuticular tissue from mobile to fixed in place, against the substratum, is consistent with both enhanced adhesion to the substratum as well as reduced flexibility. In acorn barnacles, molting is known to involve primarily the shedding of the exoskeleton covering the main internal structures of the barnacle body, while the increase in diameter of the basal region is accomplished without shedding of cuticular tissue (Bocquet-Védrine Citation1965; Bourget Citation1987) (Figure F). To expand the base plate, the barnacle first creates a new epicuticle, and then secretes molting fluid from its epidermis that presumably softens the old cuticle beneath the new epicuticle. The nascent cuticle structure is folded, accordion-like, as it contains a larger surface area than the current cuticle. Finally the old epicuticle softens and fractures (Figure B, Video S4), allowing the dense folds of the new cuticle to expand with the growing barnacle. Such fracture has also been noted previously (Bocquet-Védrine Citation1965; Bourget & Crisp Citation1975; Klepal & Barnes Citation1975).
The development of new capillaries, well behind the advancing growth front, is accompanied by bright autofluorescence of components within the capillary ducts. The autofluorescence spreads to the interface and along the entire circumference of the basis at the position of the duct outlet, along what have been identified previously as ‘ecdysal lines’ that form between molts. Proteinaceous secretions from the cement glands are delivered through the capillary network (Saroyan et al. Citation1970; Walker Citation1970; Cheung et al. Citation1977; Kamino Citation2006). The appearance of the autofluorescence in the newly formed duct was associated with the onset of reduced expansion rates within the striated cuticle material near the duct, ie where the band nearest the duct remained in place. The in situ observations of barnacle interface development during uninterrupted growth are consistent with the capillary secretions playing a significant role in adhesion, as has been long accepted. At the same time, the experiments confirm that barnacles employ multiple means of delivering chemistries consistent with proteins to the interface at different times during the growth cycle.
The experiments described in this paper are consistent with the hypothesis that proteins and other molecules used by A. amphitrite as it expands its base plate come from two regions: (1) delivered through the newly developing cuticular membrane and/or at the very periphery (outer 10 μm) of the cuticule; and (2) through capillary duct orifices. Figure confirms that a thin film of proteinaceous material is present at the barnacle periphery, far from the most recent mature adhesive ducts. Both the protein layer and regions within the epicuticle autofluoresce, allowing the demonstration by confocal as well as FTIR microscopy that the underlying protein layer is present before capillary secretion. The present experiments have not identified other glandular or duct structures in this region of the barnacle at that stage of interface development. Thus, the origin appears to be diffuse and associated with construction of the cuticle. This interpretation of the data is consistent with the observations of two distinct secretory events and locations (Burden et al. Citation2012) in reattached barnacles.
The interface develops as a layered structure composed of protein-containing chemistries secreted under cuticular tissue. Despite the many proteins identified as functional components of the barnacle adhesive interface (Kamino Citation2006, Citation2008; Urushida et al. Citation2007), the precise composition of the capillary secretion relative to the entire composition of the adhering interface is not known, nor whether these secretions are the only source of adhesion in the interface. Others are revisiting the possibility of multiple components in the permanent adhesive secretory processes in barnacle cyprids (Aldred et al. Citation2013). Further, the presence of phenolic compounds in the interface does not demonstrate, or even imply, a direct link between phenolic chemistries and barnacle adhesion. However, at a minimum it points to the involvement of these chemistries in the interface building process and that further investigation is needed to clarify their role. Thus the locations of specific functional proteins, their order of appearance, how they interact with other components in the interface, and their relationship to adhesion are important aspects of the barnacle adhesion process that deserve further examination.
The mechanism of formation and mineralization of the expanding calcareous base plate, which resides above the epicuticle layer, is also of interest. This layer advances radially and encases the newly developed adhesive capillaries and ducts. The biomineralization front fills in the space below these structures, then expands into space above them. The calcification appears to involve an agglomeration of particles moving to the leading edge of the base plate rather than a purely surface initiated growth (Newman et al. Citation1967). Calcification proceeds from the epicuticle membrane upward, and the analytical data suggest that the surface in this region is also rich in chitin-like chemistry. Assessing how the epicuticle and associated proteins may aid in the microstructural development and the relationship to shell mineralization (Klepal & Barnes Citation1975; Fernandez et al. Citation2002; Rodriguez-Navarro et al. Citation2006; Khalifa et al. Citation2011), barnacle adhesion and fracture mechanics (Sun et al. Citation2004; Hui et al. Citation2011) is the subject of ongoing research.
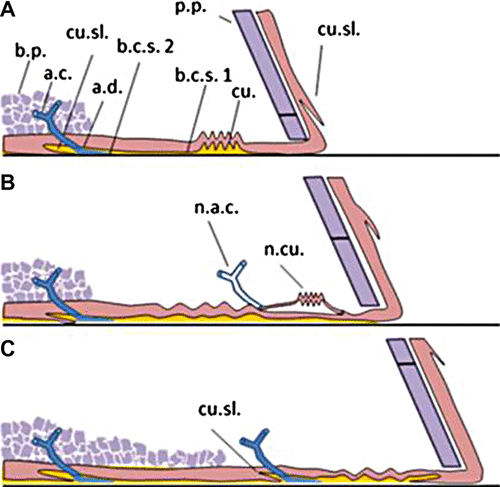
Synthesizing and summarizing the previous research and these latest observations, Figure shows a cross section illustration depicting the barnacle expansion and development of the base plate. The diagram builds on earlier structural models (Bocquet-Védrine Citation1965; Saroyan et al. Citation1970; Walker Citation1970). The figure shows three panels and the sequence of morphological changes observed in situ and confirmed analytically. Panel (A) shows a cross-section of a fully formed ‘growth ring’ at the edge of a barnacle just before ecdysis. In panel (B), the barnacle has begun its molting cycle and formed a new highly folded cuticle near the parietal plate. A capillary has formed adjacent to the nascent cuticle at approximately the same time. In panel (C), the old cuticle has fractured, forming a new ecdysial line. This event is accompanied by the secretion of autofluorescent BCS2 into the interface, as well as an extension of the calcified base plate over the previous ‘growth ring’. The stretched and disrupted chitin remains in the cuticle, forming a flap called a ‘cuticular slip’ (Bocquet-Védrine Citation1965).
Figure 8. Illustration of the growing barnacle periphery, detailing the interface development as observed and interpreted through multiple analytical techniques described in the text. Callouts are: base plate (b.p.), adhesive capillary (a.c.), adhesive duct (a.d.), cuticular slip (cu.sl.), parietal plate (p.p.), cuticle (cu.), barnacle cement secretion 1 (b.c.s.1), barnacle cement secretion 2 (b.c.s.2), new adhesive capillary (n.a.c.), new cuticle (n.cu.).
Supplemental material
Figure S1. Time lapse autofluorescent profile images of barnacle growth. (A) Geometry of the experiment showing a representative stack of confocal images and orientation of axes relative to the barnacle. (B) Composite spectral image of barnacle imaged at t = -15 h, where t = 0 is the start of radial growth of the barnacle leading edge. Region 1: leading edge of barnacle; region 2: striated fluorescence material. The yellow horizontal and vertical lines represent the x,z plane and y,z plane of the reconstructed fluorescent volume (shown in (A)), respectively. The + z direction (into the barnacle) is directed out of the page. (C) Time sequence showing autofluorescent barnacle development at a fixed y,z plane (vertical line in upper left pane). Development of a new duct filled with autofluorescent material is shown beginning at the 14 h time interval. (D) Time sequence showing autofluorescent barnacle development at a fixed x,z plane (horizontal line in upper left pane). Advancement of the barnacle leading edge (1) is present at time intervals spanning −15 to 8 h, after which the leading edge progresses outside the field of view. (E) Final autofluorescent composite image captured at t = 24 h showing highly fluorescent material within the new capillary and duct (3). Also present is a band of fluorescent particulate material (region 4) that advances toward the leading edge as barnacle growth continues. Numerical values correspond to time intervals (in hours). Depth (z-axis) in x,z and y,z planes is 9 µm. Note the axial orientation within each panel is indicated.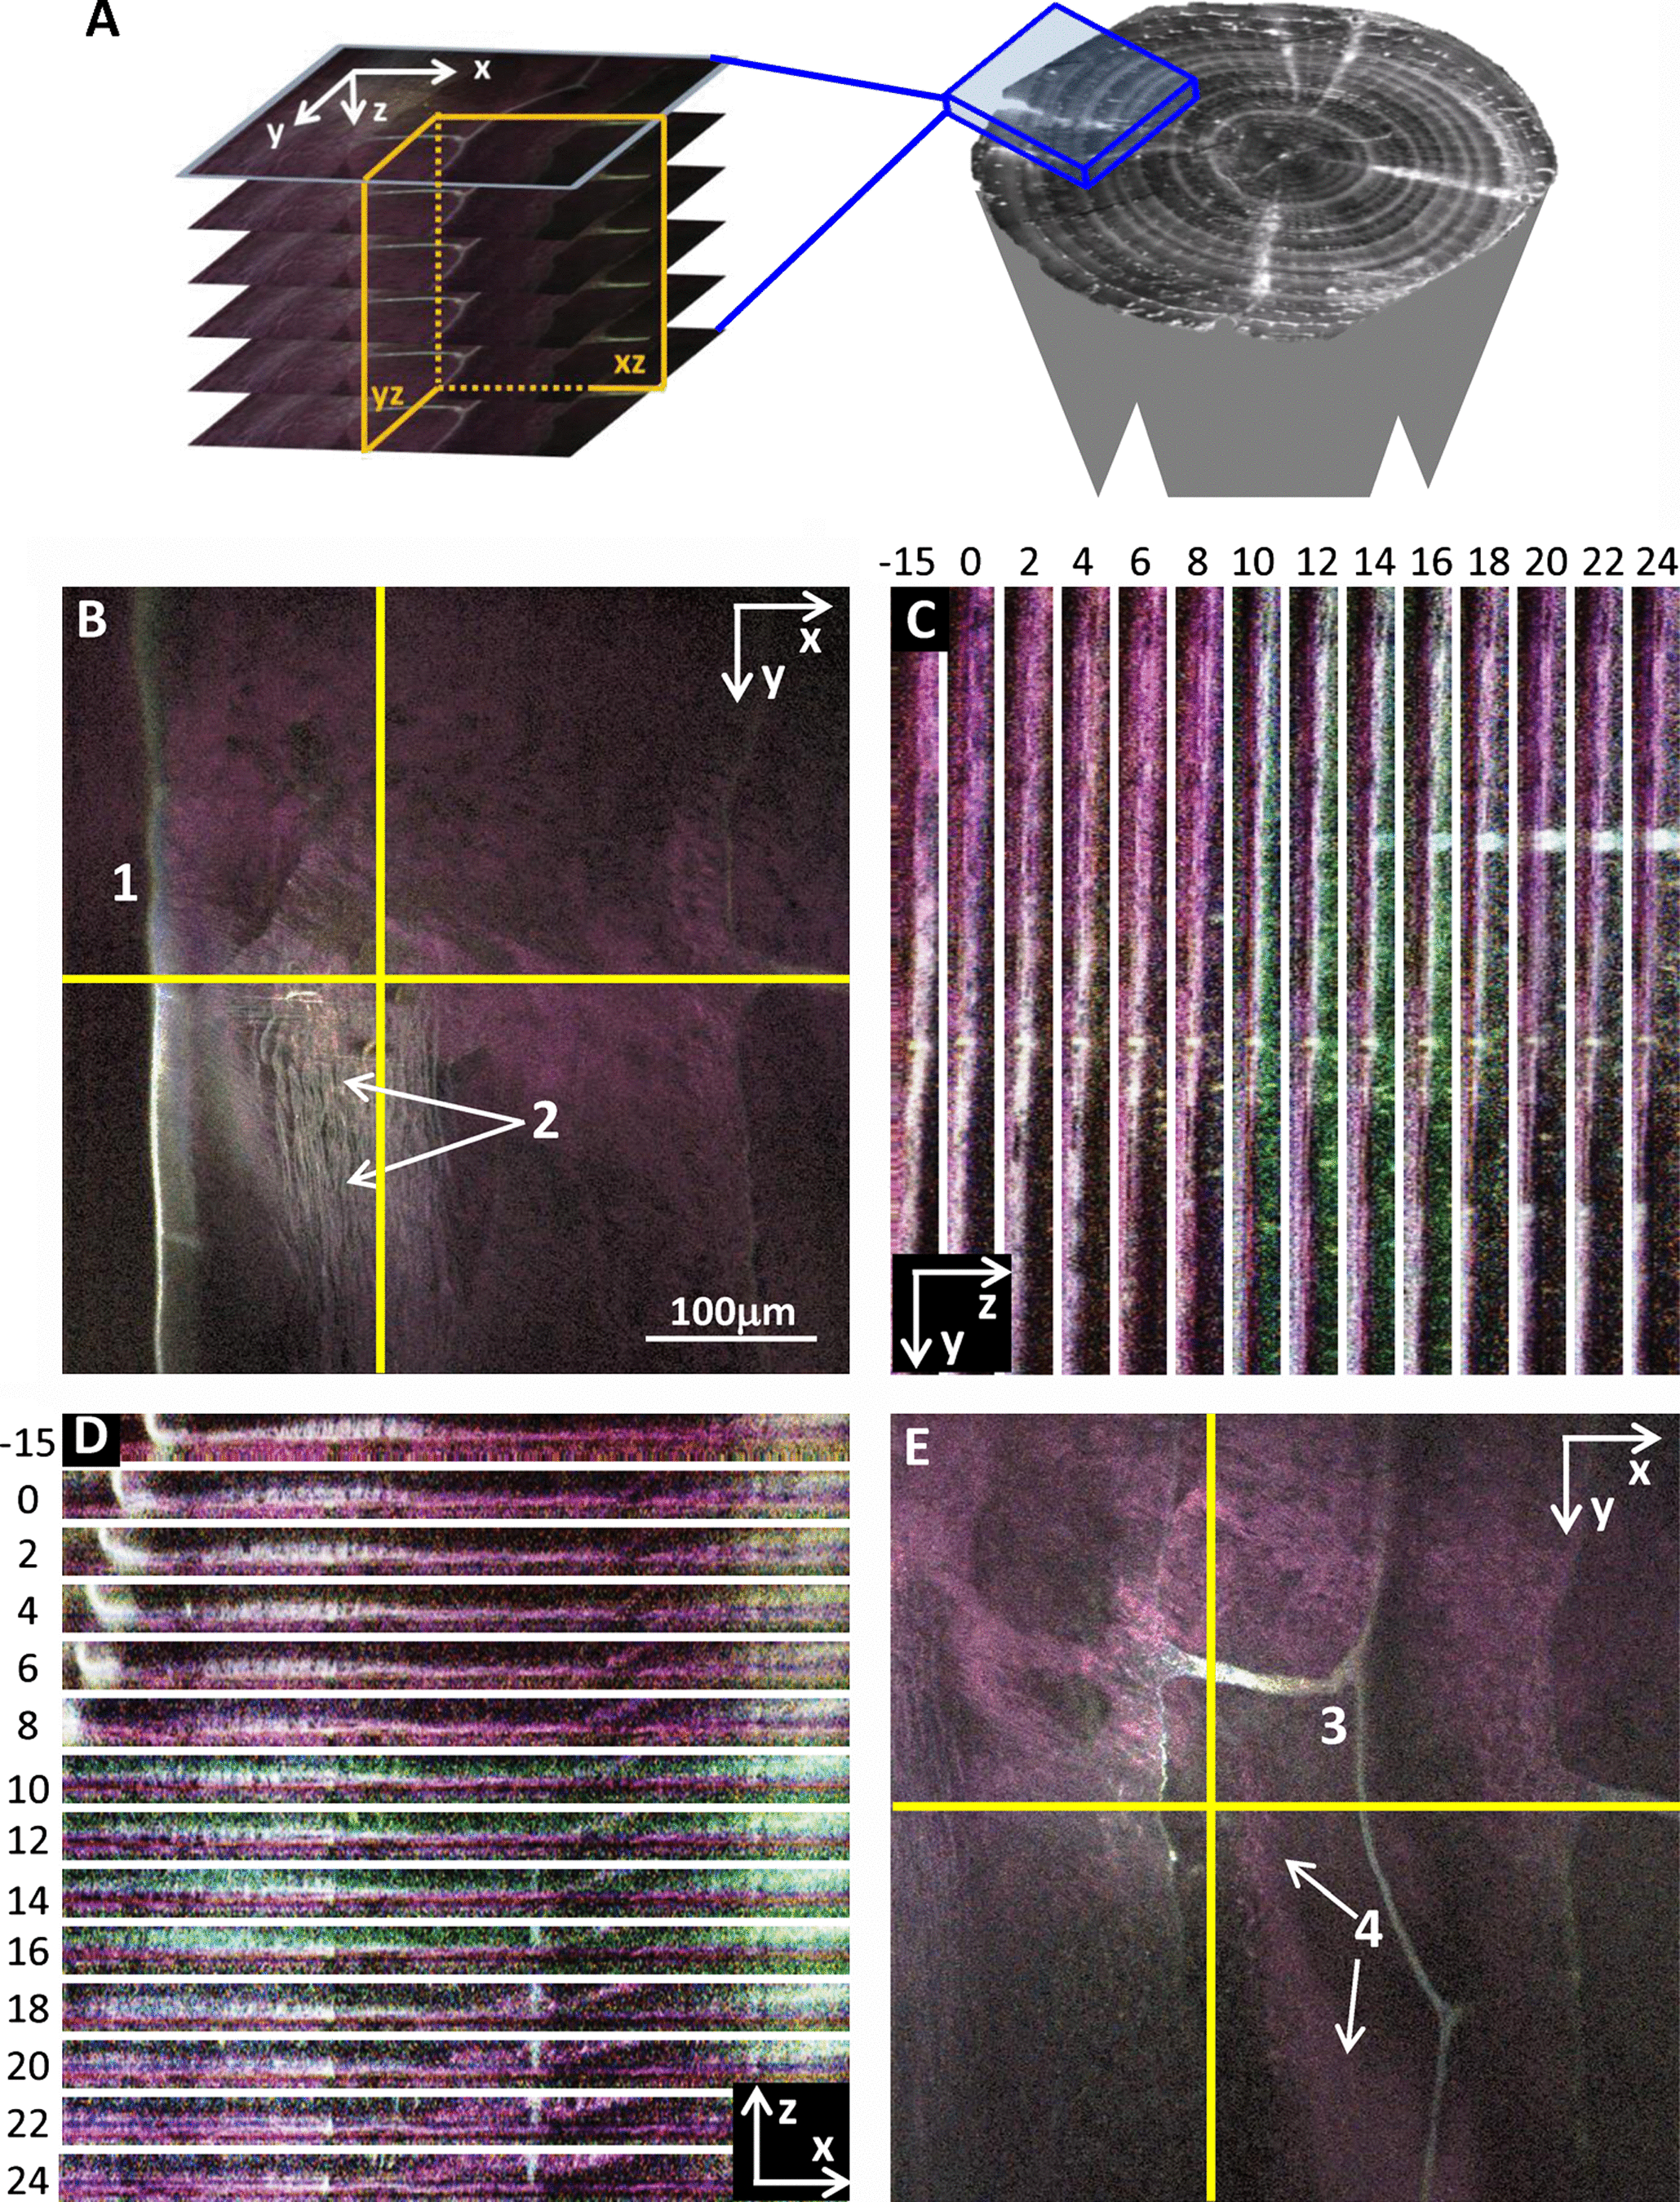
Video_5.mov
Download QuickTime Video (1.9 MB)Video_4.mov
Download QuickTime Video (554.8 KB)Video_3.mov
Download QuickTime Video (566 KB)Video_2.mov
Download QuickTime Video (2.1 MB)Video_1.mov
Download QuickTime Video (2.1 MB)Supplementary figure 1
Download PDF (654.1 KB)Acknowledgements
DKB was supported through a National Research Council Post-Doctoral Associateship. This work was supported by The Office of Naval Research (ONR) through the Naval Research Laboratory Basic Research Program and also the ONR Coatings Program [grants N0001413WX20750 to KJW; and N00014-11-1-0180 and N00014-12-1-0365 to DR].
Related Research Data
References
- Aldred N, Gohad NV, Petrone L, Orihuela B, Liedberg B, Ederth T, Mount A, Rittschof D, Clare AS. 2013. Confocal microscopy-based goniometry of barnacle cyprid permanent adhesive. J Exp Biol. 216:1969–1972.10.1242/jeb.084913
- Andersen FA, Brečević L. 1991. Infrared spectra of amorphous and crystalline calcium carbonate. Acta Chem Scand. 45:1018–1024.10.3891/acta.chem.scand.45-1018
- Andersen SO. 2010. Insect cuticular sclerotization: a review. Insect Biochem Mol Biol. 40:166–178.10.1016/j.ibmb.2009.10.007
- Anderson DT. 1994. Barnacles structure, function, development and evolution. London: Chapman & Hall.
- Barlow DE, Dickinson GH, Orihuela B, Rittschof D, Wahl KJ. 2009. In situ ATR-FTIR characterization of primary cement interfaces of the barnacle Balanus amphitrite. Biofouling. 25:359–366.10.1080/08927010902812009
- Barlow DE, Wahl KJ. 2012. Optical spectroscopy of marine bioadhesive interfaces. Ann Rev Phys Chem. 5:229–251.10.1146/annurev-anchem-061010-113844
- Barth A, Zscherp C. 2002. What vibrations tell us about proteins. Quart Rev Biophys. 35:369–430.10.1017/S0033583502003815
- Bassan P, Kohler A, Martens H, Lee J, Byrne HJ, Dumas P, Gazi E, Brown M, Clarke N, Gardner P. 2010. Resonant Mie scattering (RMieS) correction of infrared spectra from highly scattering biological samples. Analyst. 135:268–277.10.1039/b921056c
- Blomsterberg M, Glenner H, Hoeg JT. 2004. Growth and molting in epizoic pedunculate barnacles genus Octolasmis (Crustacea : Thecostraca : Cirripedia : Thoracica). J Morph. 260:154–164.10.1002/(ISSN)1097-4687
- Bocquet-Védrine J. 1965. Étude du tégument de la mue chez le cirripède opercule Elminius modestus Darwin [Study of the integument and molting of the barnacle Elminius modestus Darwin]. Arch Zool Exp Gén. 105:30–76.
- Bourget E. 1987. Barnacle shells: composition, structure, and growth. In: Southward AJ, editor. Crustacean issues: barnacle biology. Vol. 5. Rotterdam: AA Balkema; p. 267–285.
- Bourget E, Crisp DJ. 1975. An analysis of the growth bands and ridges of barnacle shell plates. J Marine Biol Assn UK. 55:439–461.10.1017/S0025315400016052
- Burden DK, Barlow DE, Spillmann CM, Orihuela B, Rittschof D, Everett RK, Wahl KJ. 2012. Barnacle Balanus amphitrite adheres by a stepwise cementing process. Langmuir. 28:13364–13372.10.1021/la301695 m
- Byler DM, Susi H. 1986. Examination of the secondary structure of proteins by deconvolved FTIR spectra. Biopolymers. 25:469–487.10.1002/(ISSN)1097-0282
- Cardenas G, Cabrera G, Taboada E, Miranda SP. 2004. Chitin characterization by SEM, FTIR, XRD, and 13C cross polarization/mass angle spinning NMR. J Appl Poly Sci. 93:1876–1885.10.1002/(ISSN)1097-4628
- Cheung PJ, Ruggieri GD, Nigrelli RF. 1977. New method for obtaining barnacle cement in liquid-state for polymerization studies. Marine Biol. 43:157–163.10.1007/BF00391263
- Clare AS, Ward SC, Rittschof D, Wilbur KM. 1994. Growth increments of the barnacle Balanus amphitrite amphitrite Darwin (cirripedia). J Crustacean Biol. 14:27–35.10.2307/1549052
- Costlow JD, Bookhout CG. 1953. Moulting and growth in Balanus improvisus. Biol Bull. 105:420–433.10.2307/1538459
- Costlow JD, Bookhout CG. 1956. Molting and shell growth in Balanus amphitrite niveus. Biol Bull. 110:107–116.10.2307/1538971
- Darwin C. 1854. A monograph on the sub-class Cirripedia with figures of all the species: the Balanidae (or sessile Cirripedes), The Verrucidae, etc., etc., etc. London: Ray Society.
- Deschamps JR. 2013. Characterization of chitin preparations using powder and film X-ray diffraction methods. Powder Diffr. 28:44–48.10.1017/S0885715612000978
- Dickinson GH. 2008. Barnacle cement: a polymerization model baesd on evolutionary concepts [PhD thesis]. Beaufort, NC: Duke University, University Program in Ecology.
- Dreanno C, Kirby RR, Clare AS. 2006. Smelly feet are not always a bad thing: the relationship between cyprid footprint protein and the barnacle settlement pheromone. Biol Lett. 2:423–425.10.1098/rsbl.2006.0503
- Ehrlich H, Maldonado M, Spindler K-D, Eckert C, Hanke T, Born R, Goebel C, Simon P, Heinemann S, Worch H. 2007. First evidence of chitin as a component of the skeletal fibers of marine sponges. Part 1. Verongidae (Demospongia: Proifera). J Exp Zool B. 308:347–356.10.1002/(ISSN)1552-5015
- Fears KP, Clark TD, Petrovykh DY. 2013. Evaluating protocols and analytical methods for quantifying peptide adsorption on surfaces. Biointerphases. 8:1–20.
- Fears KP, Petrovykh DY, Clark TD. 2013. Resodie-dependent adsorption of model oligopeptides on gold. J Am Chem Soc. 135:15040–15052.10.1021/ja404346p
- Fernandez MS, Vergara I, Oyarzun A, Arias JI, Rodriguez R, Wiff JP, Fuenzalida VM, Arias JL. 2002. Extracellular matrix molecules involved in barnacle shell mineralization. In: Aizenberg J, McKittrick JM, Orme CA, editors. Biological biomimetic materials-properties to function. Vol. 724. Warrendale: Materials Research Society; p. 3–9.
- Focher B, Naggi A, Torri G, Cosani A, Terbojevich M. 1992. Structural differences between chitin polymorphs and their precipitates from solutions – evidence from CP-MAS 13C-NMR. FT-IR and FT-Raman spectroscopy. Carbohyd Polym. 17:97–102.
- Fyhn UEH, Costlow JD. 1976. Histochemical study of cement secretion during intermolt cycle in barnacles. Biol Bull. 150:47–56.10.2307/1540588
- Holm ER, Kavanagh CJ, Orihuela B, Rittschof D. 2009. Phenotypic variation for adhesive tenacity in the barnacle Balanus amphitrite. J Exp Marine Biol Ecol. 380:67.
- Holm ER, Orihuela B, Kavanagh CJ, Rittschof D. 2005. Variation among families for characteristics of the adhesive plaque in the barnacle Balanus amphitrite. Biofouling. 21:121–126.10.1080/08927010512331344188
- Horcas I, Fernandez R, Gomez-Rodriquez JM, Colchero J, Gomez-Herrero J, Baro AM. 2007. WSXM: a software for scanning probe microscopy and a tool for nanotechnology. Rev Sci Instrum. 78:013705.10.1063/1.2432410
- Hui CY, Long R, Wahl KJ, Everett RK. 2011. Barnacles resist removal by crack trapping. JRoy Soc Int. 8:868–879.10.1098/rsif.2010.0567
- Kamino K. 2006. Barnacle underwater attachment. In: Smith AM, Callow JA. editors. Biological adhesives. Heidelberg: Springer; p. 145–166.
- Kamino K. 2008. Underwater adhesive of marine organisms as the vital link between biological science and material science. Marine Biotechnol. 10:111–121.10.1007/s10126-007-9076-3
- Kamino K. 2013. Mini-review: barnacle adhesives and adhesion. Biofouling. 29:735–749.10.1080/08927014.2013.800863
- Kamino K, Nakano M, Kanai S. 2012. Significance of the conformation of building blocks in curing of barnacle underwater adhesive. FEBS J. 279:1750–1760.10.1111/j.1742-4658.2012.08552.x
- Kavanagh CJ, Quinn RD, Swain GW. 2005. Observations of barnacle detachment from silicones using high-speed video. J Adhesion. 81:843–868.10.1080/00218460500189331
- Khalifa GM, Weiner S, Addadi L. 2011. Mineral and matrix components of the operculum and shell of the barnacle Balanus amphitrite: calcite crystal growth in a hydrogel. Crystal Growth Des. 11:5122–5130.10.1021/cg2010216
- Klepal W, Barnes H. 1975. The structure of the wall plate in Chthamalus depressus (Poli). J Exp Marine Biol Ecol. 20:265–285.10.1016/0022-0981(75)90087-8
- Lacombe D. 1970. A comparative study of the cement glands in some balanid barnacles (Cirripedia, Balanidae). Biol Bull. 139:164–179.10.2307/1540134
- Lacombe D, Liguori VR. 1969. Comparative histological studies of the cement apparatus of Lepas anatifera and Balanus tintinnabulum. Biol Bull. 137:170–180.10.2307/1539940
- Lindner E. 1984. The attachment of macrofouling invertebrates. In: Costlow JD, Tipper RC, editors. Marine biodeterioration: an interdisciplinary study. Annapolis (MD): US Naval Institute; p. 183–201.10.1007/978-1-4615-9720-9
- Manoli F, Koutsopoulos S, Dalas E. 1997. Crystallization of calcite on chitin. J Cryst Growth. 182:116–124.10.1016/S0022-0248(97)00318-7
- Michels J, Gorb SN. 2012. Detailed three-dimensional visualization of resilin in the exoskeleton of arthropods using confocal laser scanning microscopy. J Microsc. 245:1–16.10.1111/j.1365-2818.2011.03523.x
- Newman WA, Zullo VA, Wainwright SA. 1967. A critique on recent concepts of growth in Balanomorpha (Cirripedia, Thoracica). Crustaceana. 12:167–178.10.1163/156854067X00594
- Nicklisch SCT, Waite JH. 2012. Mini-review: the role of redox in Dopa-mediated marine adhesion. Biofouling. 28:865–877.10.1080/08927014.2012.719023
- Pearson FG, Marchessault RH, Liang CY. 1960. Infrared spectra of crystalline polysaccharides. V. Chitin. J Polym Sci. 43:101–116.
- Rodriguez-Navarro AB, CabraldeMelo C, Batista N, Morimoto N, Alvarez-Lloret P, Ortega-Huertas M, Fuenzalida VM, Arias JI, Wiff JP, Arias JL. 2006. Microstructure and crystallographic-texture of giant barnacle (Austromegabalanus psittacus) shell. J Struct Biol. 156:355–362.10.1016/j.jsb.2006.04.009
- Saroyan JR, Lindner E, Dooley CA. 1970. Repair and reattachment in the barnacle as related to their cementing mechanism. Biol Bull. 139:333–350.10.2307/1540088
- Schindelin J, Arganda-Carreras I, Frise E, Kaynig V, Longair M, Pietzsch T, Preibisch S, Rueden C, Saalfeld S, Schmid B, et al. 2012. Fiji: an open-source platform for biological-image analysis. Nat Meth. 9:676–682.10.1038/nmeth.2019
- Simpson LJ. 1998. Electrochemically generated CaCO3 deposits on iron studied with FTIR and Raman spectroscopy. Electrochim Acta. 43:2543–2547.10.1016/S0013-4686(97)10167-0
- Socrates G. 2001. Infrared and Raman characteristic group frequencies. Chichester: Wiley.
- Stewart RJ, Ransom TC, Hlady V. 2011. Natural underwater adhesives. J Poly Sci B-Poly Phys. 49:757–771.10.1002/polb.22256
- Sun YJ, Guo SL, Walker GC, Kavanagh CJ, Swain GW. 2004. Surface elastic modulus of barnacle adhesive and release characteristics from silicone surfaces. Biofouling. 20:279–289.10.1080/08927010400026383
- Thiyagarajan V, Harder T, Qiu J-W, Qian P-Y. 2003. Energy content at metamorphosis and growth rate of the early juvenile barnacle Balanus amphitrite. Marine Biol. 143:543–554.10.1007/s00227-003-1077-9
- Urushida Y, Nakano M, Matsuda S, Inoue N, Kanai S, Kitamura N, Nishino T, Kamino K. 2007. Identification and functional characterization of a novel barnacle cement protein. FEBS J. 274:4336–4346.10.1111/j.1742-4658.2007.05965.x
- Walker G. 1970. Histology, histochemistry and ultrastructure of cement apparatus of three adult sessile barnacles, Elminius modestus, Balanus balanoides and Balanus hameri. Marine Biol. 7:239–248.10.1007/BF00367494
- Wendt DE, Kowalke GL, Kim J, Singer IL. 2006. Factors that influence elastomeric coating performance: the effect of coating thickness on basal plate morphology, growth and critical removal stress of the barnacle Balanus amphitrite. Biofouling. 22:1–9.10.1080/08927010500499563
- Zill S, Frazier SF, Neff D, Quimby L, Carney M, Dicaprio R, Thuma J, Norton M. 2000. Three-dimensional graphic reconstruction of the insect exoskeleton through confocal imaging of endogenous fluorescence. Microsc Res Tech. 48:367–384.10.1002/(ISSN)1097-0029