
 ?Mathematical formulae have been encoded as MathML and are displayed in this HTML version using MathJax in order to improve their display. Uncheck the box to turn MathJax off. This feature requires Javascript. Click on a formula to zoom.
Abstract
A combination of Fourier-transform infrared (FTIR) spectroscopy, multivariate analysis and conventional microbiological assays were utilized to characterize and differentiate membrane biofouling formed in the presence of antiscalants. Based on the FTIR spectra of biofouled reverse osmosis membranes obtained after incubating with antiscalants and H. aquamarina (as model microorganism), it was found that the biofouling intensity and composition was dependent on the type of antiscalants used. The growth of the bacterium was also highly affected by the type of antiscalants as shown by the colony forming unit (CFU) counts. By combining the techniques of principle component analysis (PCA) and FTIR, it was demonstrated that the biofouling was more intense and composed of proteins, polysaccharides and lipids, when polymer antiscalant was used. By applying PCA-FTIR with CFU counts, faster prediction of the effect of antiscalants on biofouling was made possible.
Introduction
The membrane filtration technique is being adopted worldwide as an environmentally friendly and energy efficient technique in the desalination industry as compared to thermal desalination techniques (Tang et al. Citation2009, Citation2011; Sun et al. Citation2016). However, the performance of membranes, which includes permeate flux and rejection, is affected by the membrane fouling and scaling. To prevent mineral scaling on reverse osmosis (RO) membranes, antiscalants are added to suppress mineral scale formation. The most common antiscalants for calcium sulfate (CaSO4) include phosphonates and organic polymers (Shih et al. Citation2006). In RO systems, phosphonates, however, tend to hydrolyze to orthophosphate and react with calcium ions to form calcium orthophosphate, which is insoluble (Antony et al. Citation2011). Therefore, most of the commercial antiscalants for RO membranes are organic polymer-based chemicals, such as poly acrylic acid (PAA), polymethacrylic acid (PMAA), and poly maleic acid (PMA).
The use of polymer-based inhibitors has shown satisfactory performance in preventing membrane scaling (Shih et al. Citation2006). However, little research has been performed on their biodegradability. Due to the presence of microorganisms in seawater, these antiscalants may act as an energy/carbon source and their biodegradation will not only reduce their efficiency to control membrane scaling, but they will also become a source of enhanced microbial growth causing membrane biofouling. In preliminary research, the strain of Halomonas aquamarina was isolated from Arabian Gulf seawater and identified using the matrix assisted laser desorption ionization – time of flight mass spectrometry (MALDI-TOF MS) technique. The strain was identified with a score of 2.02, which is interpreted as reliable at genus level identification and probable species level identification as per the manufacturer’s (Bruker Daltonics, Bremen, Germany) instructions. The strain was tested for the ability to use antiscalants as a carbon/energy source by providing growth medium containing only one of the target antiscalants as a carbon source. The antiscalants focused on the included monomers of acrylic and maleic acids and PAA. It was found that H. aquamarina was able to grow in an antiscalant containing medium with specific growth rates (h−1) of 0.076 (acrylic acid; AA), 0.088 (maleic acid; MA) and 0.115 (PAA), which indicated that the strain was able to use these antiscalants as a carbon/energy source for its growth. Furthermore, it has also been shown in the literature that the antiscalants can enhance membrane biofouling either through their assimilation as a source of carbon (Vrouwenvelder et al. Citation2000) or phosphorus (Sweity et al. Citation2013) by microorganisms or through altering membrane surface properties (hydrophobicity) that favor biofouling (Sweity et al. Citation2015). Thus, it can be concluded from these studies that there is a need to develop certain screening methods to quickly evaluate antiscalants and obtain early information about their biofouling potential before their utilization at the industrial scale.
Conventionally, membrane fouling and antifouling studies are conducted in a membrane filtration setup. Depending upon the type of fouling under investigation, the experiments are usually conducted from few hours to weeks and the setup mandates inclusion of high-pressure pumps, flow meters, pressure gauges and membrane filtration cells, which makes it a time consuming and costly methodology. In recent research, a method of quantifying biofilm formation using microbiology-based assays was proposed (Lutskiy et al. Citation2015). The suggested methodology was successfully applied to quantify the early stage of biofilm formation on RO and nanofiltration (NF) membranes. The effect of an antimicrobial polypeptide (nisin) on biofouling was recently studied using similar methodology (Jung et al. Citation2018). Therefore, it can be concluded that such assays are useful for evaluating the performance of membranes coated with anti-microbial materials to give early information about the performance of modified membranes without the use of complex filtration setups. Similarly, such assays can further be utilized to study the factors affecting microbial growth/viability (eg antiscalants), a critical step in biofouling.
There are variety of microscopic methods that can be used to evaluate biofouling, such as epifluorescence, confocal laser scanning, atomic force, nuclear magnetic resonance and electron microscopy. However, disadvantages include the inability to obtain information about biofilm composition, the fact that these methods are labor intensive, and are based on critical specimen preparation procedures (Nguyen et al. Citation2012). On the other hand, Fourier-transform infrared (FTIR) spectroscopy is a reliable, cheaper and quicker analytical technique (Al-Juboori and Yusaf, Citation2012; Amir et al. Citation2013), suitable for the detection and identification of functional groups in organic compounds or in the biofilm layer on the membrane (Al-Degs et al. Citation2011; Gelaw et al. Citation2014). FTIR relies on the measurement of characteristic peaks associated with certain functional groups. The technique is known as a ‘fingerprint analytical technique’ for the identification of compounds as it is nearly impossible to obtain the same spectrum for two different compounds (Al-Degs et al. Citation2011). It is a rapid and non-destructive technique and, therefore, is good for qualitative analysis of membrane fouling. In addition, analytical information can be extracted from overlapped FTIR spectra by using multivariate analysis (principle component analysis; PCA) and multivariate calibration (Al-Ghouti et al. Citation2008, Citation2010). A combination of FTIR and multivariate calibration has been successfully applied for various purposes such as fuel adulteration (Al-Ghouti et al. Citation2008), and determining the viscosity index and the base number of motor oils (Al-Ghouti et al. Citation2010). However, its application in membrane science is seldom reported. Gelaw et al. (Citation2014) used FTIR and multivariate analysis (soft independent modeling of the class analogy model; SIMCA) to investigate membrane fouling. These techniques helped them to differentiate between fouled and cleaned membrane and to determine the best cleaning protocol for removal of organic foulants. PCA is also a type of multivariate analysis that helps to reduce data redundancy. The technique is used for identification of a smaller number of uncorrelated variables from a larger set of data which helps to emphasize variation in the dataset. These uncorrelated variables are known as principal components (PCs). The PCs are the new coordinates and are numbered as per the percentage of variance in the real data they explain, and they help to maximize variances between the clusters and minimize within the clusters. Thus, PCA can be combined with FTIR to differentiate between the fouling layers on a membrane receiving different treatments.
The goal of the present study was to evaluate the effect of antiscalants on biofilm formation on RO membranes using relatively faster and efficient methodology. Therefore, FTIR spectroscopy with multivariate analysis (PCA) and a microbiologically based assay were employed in this research. It is expected that the results will help to develop the application of FTIR with PCA in membrane science and to offer simple, rapid and cost-effective methods to investigate membrane biofouling.
Methodology
Medium preparation
Mineral salt medium (MSM) was prepared as (g l−1): 4 ammonium nitrate, 2 disodium hydrogen phosphate, 0.53 potassium dihydrogen phosphate, 0.17 potassium sulfate, 0.1 Mg.SO4.7H2O, 20 agar, and 35 NaCl. Trace element solutions (1 ml in 1 l of medium) were prepared as (g l−1), 0.1 EDTA, 0.042 ZnSO4, 0.178 MnSO4, 0.05 H3BO3, and 0.1 NiCl2. Four carbon sources were used separately as (1 g l−1); glucose (G + MSM), AA (AA + MSM), MA (MA + MSM), and PAA (PAA + MSM).
Inoculum preparation
The strain H. aquamarina strain was inoculated in Luria Bertani (LB) medium containing (g l−1); 10 tryptone, 5 yeast extract, 10 NaCl and 15 agar. After incubation for 24 h at 37 °C in a shaker set at 250 rpm, the bacterial culture was used for inoculum preparation in sterile distilled water.
RO membrane
Polyamide TFC (thin film composite) RO (Energy Saving Polyamide – ESPA 2) membrane was acquired from Hydranautics Inc. (Oceanside, CA, USA). Membranes were stored at 4–8 °C in deionized (DI) water. The membrane samples were cut into desired sizes, thoroughly washed with running DI water and then stored in DI water at room temperature for 24 h before an experiment. Initial characteristics of the membrane include: pure water flux (5.1 ± 0.1 l m−2 h bar−1), surface roughness (74.98 ± 5.60 nm), and salt rejection (99.0 ± 0.1%).
Biofilm growth assay
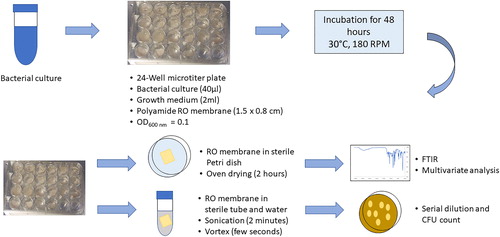
Polyamide TFC RO membranes (∼1.5 × 0.8 cm) were first rinsed with 70% ethanol and distilled water and were subsequently placed at the bottom of a 24-well microtiter plate in such a way that the active polyamide surface faced the medium. Four MSM liquid media were prepared as explained in above, with different carbon sources: glucose, AA, MA or PAA. MSM liquid medium without any carbon source was also prepared. Two ml of each medium was added into each well followed by the addition of 40 µl of inoculum to finally achieve OD600 nm = 0.1. The microtiter plate was then incubated for 48 h at 30 °C at 180 rpm (). The negative controls included MSM (no carbon source) with bacterial cells and MSM (containing either acrylic or maleic or PAA or glucose) without bacterial cells. The positive control included MSM with glucose as a carbon source and bacterial cells.
Figure 1. Qualitative and quantitative analysis of biofilm formation conducted in a 24-well microtiter plate (modified from Lutskiy et al. Citation2015; Jung et al. Citation2018).
Qualitative analysis of biofilm
Qualitative analysis of biofilm formed on RO membranes was done through FTIR spectroscopy (Perkin Elmer 400 FTIR instrument). RO membranes were transferred to sterile Petri dishes and subjected to oven drying for 2 h at 35 °C. The membranes were then subsequently subjected to FTIR analysis [Spectrum 400 FTIR from PerkinElmer using Universal Attenuated Total Reflectance (UATR)] and spectra of 4,000–400 cm−1 were obtained.
Quantitative analysis of bacterial cells in biofilm (serial dilution)
Quantitative analysis of the bacterial cells in biofilms formed on RO membranes was done through measuring colony forming unit (CFU) counts as previously described by Lutskiy et al. (Citation2015). Briefly, RO membranes after incubation were transferred to centrifuge tubes containing 5 ml of sterile water. The tubes were subjected to sonication for 2 min followed by vortexing for few seconds. This step was done to ensure biofilm detachment from the RO membranes. The detached bacterial cells were then serially diluted and plated on LB medium. After incubation for 48 h at 30 °C, CFU counts were made and the viable number of bacteria were then determined.
Principle component analysis (PCA)
The application of mathematical and statistical methods to improve the chemical measurement processes and to extract more useful information from chemical measurement data is generally known as chemometrics (Kansiz et al. Citation1999). Extraction of information from chemical and physical measurement data is more applicable to spectroscopic techniques as it produces a large amount of data often with multi-dimensional complications. The most commonly used multivariate statistical technique for the extraction of information and interpretation of the variance in a multispectral dataset is PCA. The PCA for clustering of the variables was done using The Unscrambler X (v10.5, Camo Analytics, Magnolia, TX, USA) following the singular value decomposition (SVD) algorithm and XLSTAT 2016 (MS Excel 2016, Microsoft, Redmond, WA, USA). In the present case, the variables were the medium used, ie a positive control, AA + MSM, PAA + MSM, MA + MSM and negative controls, and the observations include the spectral intensity for wavenumbers (cm−1).
The basic equation used in PCA in a matrix notation is EquationEquation 1(1)
(1) :
(1)
(1)
where X denotes the data matrix with (n) observations (transmittance/absorbance in FTIR spectra) in rows and variables (media type, eg glucose, PAA) in columns, W is a coefficient matrix which is determined by PCA and Y represents the matrix of scores. The singular value decomposition of S is calculated using EquationEquation 2(2)
(2) :
(2)
(2)
where L and U are the matrix of eigenvalues and eigenvectors of S respectively. W is calculated using EquationEquation 3(3)
(3) :
(3)
(3)
The correlation between the ith factor with the jth variable can be calculated using EquationEquation 4(4)
(4) :
(4)
(4)
Thus, uij is the element of U (matrix of eigenvectors), li is the element of L (diagonal matrix of eigenvalues) and sjj is a diagonal matrix of S. This correlation is known as factor loadings (Jackson, Citation2003).
Results
Qualitative analysis of biofouled membranes
FTIR analysis
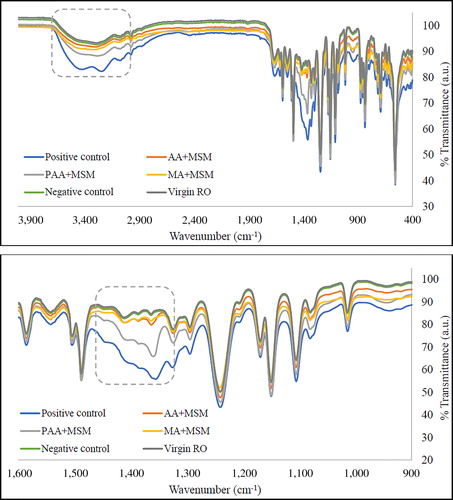
shows the FTIR results of RO membranes exposed to media containing different carbon sources and H. aquamarina as a bacterial strain. A higher similarity among all FTIR spectra and the absence of any peak shifts shows that there was no interaction between the RO membrane and the biofilm layer and thus biofouling did not cause any obvious structural changes on the RO membrane surface. However, through comparison with the negative controls and virgin RO membrane (pure RO membrane surface), a decrease in the percentage transmittance at specific wavenumbers shows that the formation of biofilm increased after the addition of antiscalants. Because the biofilm present on the RO membrane is subjected to IR radiations, the molecules present in the biofilm will absorb the radiation. The amount of radiation absorbed by the molecules is directly proportional to the number of molecules present in the biofilm or the intensity of the biofilm (Wolf et al. Citation2002). This result can also be explained through Beer-Lambert law, which states that the absorbance is directly proportional to the thickness and concentration of the sample (Stuart, Citation2004; Salido et al. Citation2017) as shown in EquationEquation 5(5)
(5) :
(5)
(5)
where A is the absorbance, ε is molar absorptivity, c is the concentration and l is the path length of the sample.
Figure 2. FTIR spectra of RO membranes after exposure to different media in the presence of H. aquamarina (incubation: 48 h at 30 °C; concentration: 1g l−1). Virgin RO – pure RO membrane surface; Negative control – MSM (no carbon source) with bacteria and MSM + carbon source (acrylic/maleic/poly acrylic acid/glucose) without bacteria; Positive control – glucose in MSM; AA + MSM – acrylic acid in MSM; PAA + MSM – poly acrylic acid in MSM; MA + MSM – maleic acid in MSM.
The absorbance (A) is related to transmittance (T) via EquationEquation 6(6)
(6) :
(6)
(6)
Therefore, the lower the percentage transmittance is, the higher the absorbance will be and consequently, the concentration/thickness of the biofilm will be high. Similar changes in the intensity of the FTIR spectra of the biofilm have also been obtained from different regions of the biofouled RO membranes (feed, middle and brine regions) and the increase in peak intensity for the RO membrane obtained from the brine region was also correlated with the relatively higher intensity of biofouling (Khan et al. Citation2015).
shows various peaks and their assignments from the literature. The broad regions at 2,900–3,300 and 900–1,200 cm−1 represent polysaccharides. In these regions, vibrations result from stretching of the C-OH and C-O-C bond (glycoside bond) (Jin et al. Citation2013). Absorbance in these peaks was also observed in the biofilm produced by Pseudomonas aeruginosa (Nivens et al. Citation2001). In addition, stretching vibrations of the C-O of carbohydrates, P-O-P and C-O-P of the polysaccharides of the cell wall and symmetrical stretching of the P = O of phosphate groups in nucleic acids characterize these polysaccharide regions (Karadenizli et al. Citation2007). The peaks at 2,955 and 2,930 cm−1 correspond to C-H asymmetric stretching of the -CH3 and > CH2 in fatty acids, whereas the peaks at 2,870 and 2,850 cm−1 represents C-H symmetric stretching of the -CH3 and > CH2 in fatty acids. In addition, peaks at 1,240 and 1,085 cm−1 have been assigned to P = O asymmetric and symmetric stretching of DNA, RNA and phospholipids in the literature. The protein component of the biofilm can be seen through the peaks at 3,200 cm−1, which results from N-H stretching of amide A in proteins and peaks at 1,650, 1,540, and 1,310–1,240 cm−1 represent the amide I, II and III components of proteins, respectively. The C = O bond in the peptide group resulted in the amide I peak, whereas, both N-H bending and C-N stretching combine to give the amide II peak (Long et al. Citation2009).
Table 1. Peak assignments to characterize biofilm layerTable Footnote*.
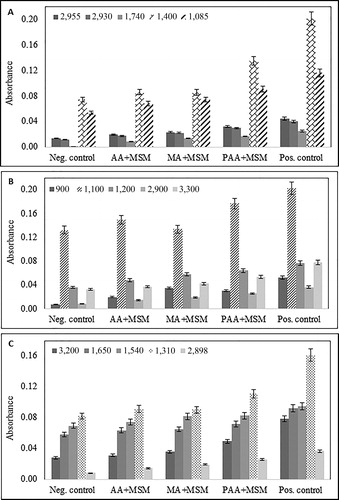
Based on the peak assignments in , peaks were selected that represent protein, polysaccharides and the lipids/fatty acid components of the biofilm to show an increase in the absorbance in FTIR spectra. clearly shows that the absorption increased with the addition of antiscalants, which corresponds to the increased biofilm formation on RO membranes. The t-test was also conducted which showed that the mean absorbance of biofouled membranes at various wavenumbers was significantly different from the negative control at 95% confidence level. Nevertheless, the absorbance obtained for MA (MA + MSM) at 1,100, 1,650 and 1,310 cm−1 and at 1,540 and 1,310 cm−1 for AA (AA + MSM), were not significantly different from the negative control at 95% confidence level. This could be attributed to relatively less biofilm formation when monomer antiscalants were used. Therefore, it can be concluded that biofilm formation increased after the addition of antiscalants, in which PAA caused most intense biofouling on RO membranes.
Figure 3. Increase in absorbance for selected peaks representing: (A) fatty acids and phospholipids, (B) polysaccharides, (C) protein components of the biofilm layer. Neg. control – MSM (no carbon source) with bacteria, and MSM + carbon source (acrylic/maleic/poly acrylic acid/glucose) without bacteria; Pos. control – glucose in MSM; AA + MSM – acrylic acid in MSM; PAA + MSM – poly acrylic acid in MSM; MA + MSM – maleic acid in MSM.
Classification using principal component analysis
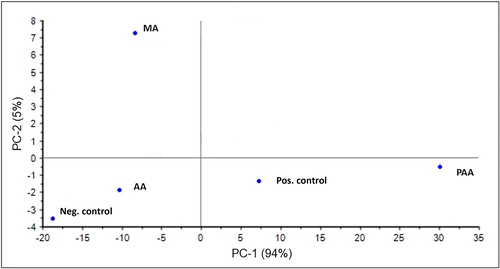
PCA was carried out for FTIR spectra of biofilm formed on RO membranes as a result of addition of antiscalants and glucose (as a positive control). PCA helped to cluster the variables (positive control, AA + MSM, MA + MSM, PAA + MSM and negative control in this case) based on their scores in PC1 and PC2. As shown in , PC1 and PC2 represent 96% of the data variance. Biofilm spectra obtained for PAA and glucose were found to be positively correlated to PC1 and negatively correlated to PC2, whereas the biofilm spectra obtained for AA and the negative control were negatively correlated to both principle components. The biofilm spectra obtained for MA is the only variable that was found to be positively correlated to PC2 and negatively to PC1. Briefly, three clusters can be obtained based on PCA, ie cluster 1 (PAA and glucose), cluster 2 (AA and the negative control) and cluster 3 (only MA) as shown in . Hence, the biofilm spectra that correspond to biofilm intensity as well as composition (polysaccharides/proteins/lipids or phospholipids) are similar for the variables qualifying for the same cluster, for example, PAA and glucose under cluster 1. On the other hand, variables qualifying for different clusters are more different from each other, for example AA (cluster 2) and MA (cluster 3). Since PCA helps to maximize the differences between the two clusters and minimize within the cluster, such clustering can help to understand the variability among various classes of antiscalants and can help to differentiate their effect on membrane biofouling.
Figure 4. Clustering of variables obtained through PCA using The Unscrambler (V10.5).
Component wise analysis of biofilm using PCA
Protein component. PCA was done for the peaks representing the protein component of biofilm in XLSTAT 2016. The biplot in shows that the two factors or PCs (F1 and F2) represent 99.9% of the variance in the data. The data showed that biofilm spectra obtained from PAA and the positive control (previously categorized as cluster 1 using SVD-PCA) are positively correlated to F1 and negatively to F2, whereas spectra obtained for MA, AA and the negative control are positively correlated to both F1 and F2 and hence can be categorized as one cluster. The biplot shows that peaks of 3,200 and 1,468 cm−1 have a high loading value for the negative control, AA and MA spectra and correspond to N-H stretching of amide A in proteins and C-H deformation of > CH2 in lipid proteins. On the other hand, peaks of 2,898, 1,650, 1,540, and 720 cm−1 have higher loading values for the biofilm obtained as a result of PAA and glucose (positive control). These peaks mainly represent C-H stretching of ≥ C-H of amino acids, protein secondary structures amide I, amide II and C-H rocking of > CH2 in fatty acids and proteins.
Figure 5. Biplot obtained for (A) the proteins; (B) the fatty acids and phospholipids; (C) the polysaccharide components of the biofilm using XLSTAT (V2016).
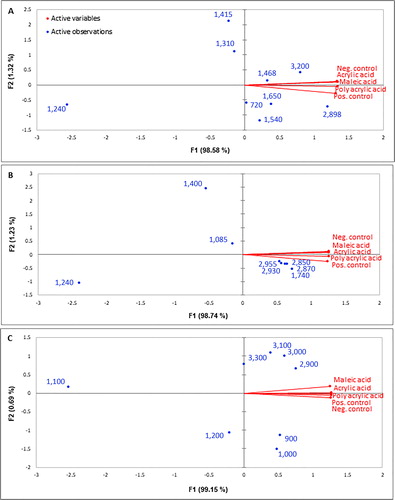
Lipids/phospholipid component. The biplot obtained for peaks corresponding to lipids or the phospholipid component of biofilm is shown in . The results clearly show that the lipid component of biofilm has negligible loading values for the negative control, AA and MA, whereas several peaks (2,955, 2,930, 2,850, 2,870, 1,740 cm−1) have high loading values for biofilm spectra obtained in the presence of PAA and glucose (positive control).
Polysaccharide component. The biplot of polysaccharides results from PCA give somewhat contrasting results as compared to other two components. shows that peaks such as at 3,300, 3,100, 3,000 and 2,900 cm−1 have higher loading values for biofilm spectra obtained for AA and MA as opposed to both the positive and negative controls and the PAA spectra.
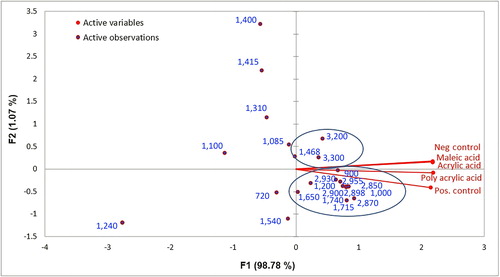
Biofilm – combining all components. A biplot was also obtained combining all three components of biofilm. shows that spectra obtained for the negative control, MA and AA are positively correlated to both F1 and F2 representing 99.85% of the variance, whereas PAA and glucose (positive control) spectra are negatively correlated to F2 and positively to F1. Since none of the variables are negatively correlated to F1, these will have lower loading values. Two classes can be observed considering a positive correlation to F1; the first cluster, comprising 3,300 (polysaccharide), 3,200 and 1,468 cm−1 (proteins), has more influence on MA, AA and the negative control spectra. The second cluster, comprising 2,930, 2,870, 1,715, 1,740, 2,850 cm−1 corresponding to the lipid component, 900 and 2,900 cm−1 to the polysaccharide component and 2,898 cm−1 to the protein component, has more loading values for PAA and the glucose biofilm spectra. Thus, it can be concluded that in the case of intense biofouling, ie when glucose and PAA were used as a carbon source, the biofilm was mainly comprised of lipids/phospholipids, polysaccharides and protein. On the other hand, in the case of relatively less intense biofouling formed after the addition of acrylic and MAs (monomers), the biofilm was comprised of only two components, ie polysaccharides and proteins. The information about biofilm composition can be used in mitigating biofouling as some researchers aim to reduce/degrade/remove certain components of the biofilm present in abundance, such as polysaccharides (Nagaraj et al. Citation2017).
Figure 6. Clustering of the biofilm components obtained in the presence of different carbon sources.
Quantitative analysis of bacterial cells in biofilm
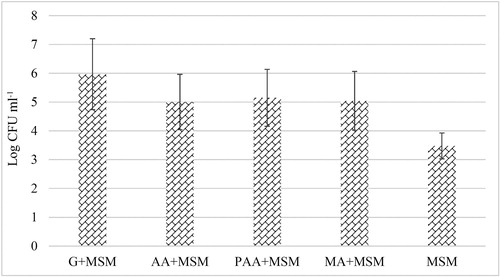
The membrane biofouling formed in response to different carbon sources was also quantitatively analyzed through the plate count method to estimate the number of viable bacterial cells in the biofilm layer. The results () showed that log CFU ml−1 was in the following decreasing order: glucose > PAA > MA > AA. The CFU count results are consistent with the FTIR results as the spectral intensity also varied in the same fashion. Interestingly, the bacterial counts in the presence of only MSM (without any carbon source) were also observed, which shows that bacterial cells were able to sustain in the absence of any carbon source. However, addition of antiscalants increased the CFU counts, which shows the potential of microorganisms to use antiscalants as a carbon/energy source and enhance their growth and biofouling in membrane systems.
Figure 7. CFU counts obtained from biofouled RO membranes.
Discussion
Membrane biofouling has been reported as a major problem in NF and RO membranes and contributes > 45% of all types of membrane fouling. Biofouling starts with initial attachment of microorganisms because of the formation of conditioning layer on the membrane, followed by their rapid multiplication and growth by feeding on the nutrients and organic substances in the feed water. This issue is where the presence of antiscalants can make a difference in the intensity of biofouling. Previous studies have reported the effect of antiscalants on the membrane properties that enhance the microorganisms’ attraction to the membrane surface as well as the formation of the conditioning layer. The presence of biodegradable antiscalants such as those used in this study will act as an additional carbon source for microorganisms, resulting in more intense biofouling. Vrouwenvelder et al. (Citation2000) noted that there is a correlation between the antiscalants’ assimilable organic carbon (AOC) and the biofouling of RO membranes. Therefore, it was suggested that antiscalants with the least or negligible AOC values were chosen in order to reduce their effect on biofouling. In another study (Sweity et al. Citation2013), it was observed that addition of poly acrylate and poly phosphonate antiscalants changed the surface properties of RO membranes by increasing the contact angle to 49 ± 1.3 from 21 ± 5.8, which made the membrane more hydrophobic; this in turn promotes biofouling. Furthermore, the surface charge of the RO membrane became less negative as a result of addition of poly phosphonate antiscalants. Other than changing membrane surface properties that promote biofouling, poly phosphonate antiscalants also provided an additional source of phosphorus for enhanced microbial growth. Both antiscalants had a higher deposition coefficient, which means that they aided in the initial attachment of microorganisms to RO membrane (Sweity et al. Citation2013).
Research has also shown that there was sharp decline in permeate flux as a result of more intense biofouling when poly acrylate based antiscalants were used in the feed water compared to poly phosphonate based antiscalants (Sweity et al. Citation2015). Scanning electron microscopy (SEM) and confocal laser scanning microscopy (CLSM) images also showed that the biofilm thickness was greater in the presence of poly acrylate based antiscalants. This could be due to higher extracellular polymeric substance (EPS) production and secretion as a result of phosphorus – limiting conditions when these antiscalants were used. However, uptake of oxygen, phosphorus and nitrogen was more in the case of poly phosphonate based antiscalants, attributed to the higher growth rates of microorganisms in these types of antiscalants (Sweity et al. Citation2015). While previous work deals with the nutritional contribution of antiscalants to biofouling and the influence of antiscalants on membrane properties and biofouling enhancement, in this work, a method for quick screening of antiscalants for their effect on biofouling has been proposed and tested. The use of antiscalants in membrane-based technologies is important to obtain better performance. Nevertheless, their use needs to be monitored to minimize their impact on biofouling.
EPS are secreted by microorganisms, and help them to further enhance additional attachment and growth on the surface of the membrane (Al-Juboori and Yusaf, Citation2012). EPS are mainly composed of polysaccharides, nucleic acids, lipids/phospholipids and proteins. EPS also exhibit certain functional groups such as carboxylic, phenolic, hydroxylic, and phosphoric groups and several non-polar groups like the hydrophobic groups in carbohydrates, aromatics and aliphatics in proteins. The presence of these functional groups aided in the characterization of biofouling on RO membrane using FTIR in this research. It has been reported that EPS comprised 50–80% of the total organic matter and protein in biofilms. Many researchers have attempted to characterize EPS in biofilms. Jiao et al. (Citation2010) used FTIR to characterize the EPS extracted from mid-development and mature stage biofilm. The presence of peaks at 1,300–900 and 1,700–1,500 cm−1 showed the presence of polysaccharides, nucleic acids and proteins. The variation in spectral shape as well as in intensity helped in obtaining information about the composition and quantity of EPS produced at different stages of biofilm formation. Thus, it was noted that the amounts of protein and carbohydrates were higher for the biofilm reaching mature stages. The ratio of carbohydrate to protein was found to be between 3 and 6, which was considered very high compared to ratios of 0.2–1.7 cited in the literature (Prolund et al. Citation1996; Bura et al. Citation1998; Liu and Fang, Citation2002; Sheng et al. Citation2005). These results show that the composition of EPS and the biofilm layer may vary to a great extent, which will have its implications on the performance of the membrane system, cleaning efficiency and other factors. These factors include type of substrate (source of carbon and the ratio of carbon to nitrogen), the growth phase of the microorganisms involved, the solution composition and chemistry (eg dissolved oxygen, pH and ionic strength), physico-chemical conditions (like shear rates and retention times) and the presence of toxic substances (drugs or heavy metals) (Rinzema et al. Citation1988; Jia et al. Citation1996; Drews et al. Citation2006; Sheng and Yu, Citation2006; Ozturk et al. Citation2010). Sheng et al. (Citation2006) reported that the production of cell mass was highest in the presence of succinate followed by malonate, propionate, acetate, butyrate and benzoate. However, EPS production was almost in the opposite order, ie it was highest for benzoate and acetate followed by butyrate, propionate, succinate and malonate. Therefore, EPS secretion is increased by microorganisms during stress conditions (Sheng et al. Citation2006). In this research, it was also noted that both biofilm composition and intensity varied with the type of carbon source in the following decreasing order: glucose > PAA > MA > AA.
Generally, polysaccharides and proteins are considered to be major components of membrane fouling (Kristensen et al. Citation2008). Therefore, most studies focus on determining EPS concentration through measuring the carbohydrate and protein content only. The carbohydrates, being more hydrophilic, tend to contribute more in fouling propensity over its counterparts (Yigit et al. Citation2008; Li et al. Citation2012). The organic matter content of the biofilm formed on a membrane has been studied and it was found that proteins and carbohydrates were major constituents of the biofilm layer (Lee et al. Citation2009). Although PCA showed that protein and polysaccharides were dominant components in the biofilm layer in this study, it also showed that lipids and phospholipids are also important constituents, especially in the case of intense biofouling, ie when glucose and PAA are used as carbon sources. Biofilms containing lipids and phospholipids such as glycosphingolipids are known to be stronger than others (Gutman et al. Citation2014a). EPS containing these lipids help in primary attachment and the recalcitrance of the biofilm produced, contributing significantly to the cohesive strength of the biofilm on RO membranes (Bereschenko et al. Citation2010) and have also been found to produce rigid layers on polyamide RO membrane surfaces (Gutman et al. Citation2014b). Furthermore, the microorganisms known to produce lipid-containing EPS, such as Sphingomonas, are primary colonizers in the biofilm layer in desalination systems (Bereschenko et al. Citation2010). The EPS produced by secondary colonizers are usually exposed to the cleaning agents and shear stress of seawater, and therefore washed away. Hence, the EPS containing lipids and other adhesive constituents produced by primary colonizers needs to be targeted to combat biofouling (Nagaraj et al. Citation2018).
The composition of EPS can also affect the physical structure of the biofilm (Mayer et al. Citation1999; Ma et al. Citation2006) such as pores and water channels in the internal structure of the film. The reduction in porosity and water passage channels may then affect membrane water permeability and rejection leading to a lower membrane flux and performance (Chen and Stewart, Citation2002; Chang and Halverson, Citation2003; Herzberg et al. Citation2009). However, it is not known how the composition of EPS affects the physical structure of the biofilm.
Knowledge about the composition of biofilm is also important in order to understand the efficiency of biofouling control and treatment strategies, as it was found that certain chemicals like sodium dodecylsulfate (SDS) and ethylenediaminetetraacetic acid (EDTA) were successful in removing more polysaccharides than proteins, and many organic components of the biofilm were still found in the cleaned membranes (Al-Ashhab et al. Citation2017). Thus, the information about the biofilm layer and its composition can also help in developing target specific cleaning and control strategy. Interestingly, combination of FTIR with multivariate data analysis was also used for choosing the best cleaning strategy for membrane biofouling. The classification results helped to differentiate between cleaned and biofouled membranes as well as between different cleaning strategies. Thus, a combination of FTIR with multivariate data analysis can help in obtaining microscopic information about the biofilm layer components and in identifying control and cleaning measures. Furthermore, a relatively less time-consuming and cost-effective method can also help in quick screening and evaluation of antiscalants for their role in biofouling. Similarly, this method can also be extended to obtain quick preliminary information about modified membranes regarding their efficiency in biofouling control.
Conclusions
Antiscalants play a vital role in reducing membrane scaling and optimizing membrane performance. However, their presence was found to enhance membrane biofouling on RO membrane systems, consistent with previous studies (Vrouwenvelder et al. Citation2000; Sweity et al. Citation2013, Citation2015). Therefore, initial screening of these antiscalants before their application at the industrial level is important to understand their biofouling potential. In this research, an easy and quick methodology was applied to perform such screening. The suggested methodology combines FTIR with multivariate data analysis and conventional microbiological assays to test the effect of antiscalants on biofouling. A combination of FTIR and PCA helped to classify antiscalants based on their membrane fouling potential and to characterize biofilm components. Both the spectral intensity and CFU counts showed that biofouling was more intense in the presence of PAA followed by MA and AA. The results of this research can help to add more in-depth information about the role of antiscalants on biofouling of membranes. Furthermore, the suggested methodology can also be utilized for preliminary testing of the anti-biofouling potential of modified membranes.
Acknowledgement
The findings achieved herein are solely the responsibility of the authors. Many thanks to Mr Fathy Atia and Ms Muneera (Central Laboratory Unit – QU) for their efforts in FTIR analysis. Special thanks to Ms Dana A. Da’na and Ms Shazia Bibi for their assistance in the laboratory work.
Disclosure statement
No potential conflict of interest was reported by the authors.
Additional information
Funding
References
- Al-Ashhab A, Sweity A, Bayramoglu B, Herzberg M, Gillor O. 2017. Biofouling of reverse osmosis membranes: effects of cleaning on biofilm microbial communities, membrane performance, and adherence of extracellular polymeric substances. Biofouling. 33:397–409. doi: 10.1080/08927014.2017.1318382
- Al-Degs YS, Al-Ghouti M, Salem N. 2011. Determination of frying quality of vegetable oils used for preparing falafel using infrared spectroscopy and multivariate calibration. Food Anal Methods. 4:540–549. doi: 10.1007/s12161-011-9201-9
- Al-Ghouti M, Al-Degs YS, Amer M. 2008. Determination of motor gasoline adulteration using FTIR spectroscopy and multivariate calibration. Talanta. 76:1105–1112. doi: 10.1016/j.talanta.2008.05.024
- Al-Ghouti M, Al-Degs YS, Amer M. 2010. Application of chemometrics and FTIR for determination of viscosity index and base number of motor oils. Talanta. 81:1096–1101. doi: 10.1016/j.talanta.2010.02.003
- Al-Juboori RA, Yusaf T. 2012. Biofouling in RO system: mechanisms, monitoring and controlling. Desalination. 302:1–23. doi: 10.1016/j.desal.2012.06.016
- Amir RM, Anjum FM, Khan MI, Khan MR, Pasha I, Nadeem M. 2013. Application of Fourier transform infrared (FTIR) spectroscopy for the identification of wheat varieties. J Food Sci Technol. 50:1018–1023. doi: 10.1007/s13197-011-0424-y
- Antony A, Low JH, Gray S, Childress AE, Le-Clech P, Leslie G. 2011. Scale formation and control in high pressure membrane water treatment systems: a review. J Membr Sci. 383:1–16. doi: 10.1016/j.memsci.2011.08.054
- Bereschenko LA, Stams AJ, Euverink GJ, Van Loosdrecht MC. 2010. Biofilm formation on reverse osmosis membranes is initiated and dominated by Sphingomonas spp. Appl Environ Microbiol. 76:2623–2632. doi: 10.1128/AEM.01998-09
- Boubakri A, Bouguecha S. 2008. Diagnostic and membrane autopsy of Djerba Island desalination station. Desalination. 220:403–411. doi: 10.1016/j.desal.2007.01.043
- Bura R, Cheung M, Liao B, Finlayson J, Lee BC, Droppo IG, Leppard GG, Liss SN. 1998. Composition of extracellular polymeric substances in the activated sludge floc matrix. Water Sci. Technol. 37:325–333. doi: 10.2166/wst.1998.0657
- Chang WS, Halverson LJ. 2003. Reduced water availability influences the dynamics, development, and ultrastructural properties of Pseudomonas putida biofilms. J Bacteriol. 185:6199–6204. doi: 10.1128/JB.185.20.6199-6204.2003
- Chen X, Stewart P. 2002. Role of electrostatic interactions in cohesion of bacterial biofilms. Appl Microbiol Biotechnol. 59:718–720. doi: 10.1007/s00253-002-1044-2
- Dixit V, Cho BK, Obendorf K, Tewari J. 2014. Identifications of household’s spores using mid infrared spectroscopy. Spectrochim Acta A Mol Biomol Spectrosc. 123:490–496. doi: 10.1016/j.saa.2013.11.053
- Drews A, Vocks M, Iversen V, Lesjean B, Kraume M. 2006. Influence of unsteady membrane bioreactor operation on EPS formation and filtration resistance. Desalination. 192:1–9. doi: 10.1016/j.desal.2005.04.130
- Gelaw TK, Guell C, Ferrando M, Lamo CSD. 2014. Use of attenuated total reflectance infrared microspectroscopy combined with multivariate analysis to study membrane fouling. J. Food Eng. 143:69–73. doi: 10.1016/j.jfoodeng.2014.06.032
- Gutman J, Herzberg M, Walker SL. 2014a. Biofouling of reverse osmosis membranes: positively contributing factors of Sphingomonas. Environ Sci Technol. 48:13941–13950. doi: 10.1021/es503680s
- Gutman J, Kaufman Y, Kawahara K, Walker SL, Freger V, Herzberg M. 2014b. Interactions of glycosphingolipids and lipopolysaccharides with silica and polyamide surfaces: adsorption and viscoelastic properties. Biomacromolecules. 15:2128–2137. doi: 10.1021/bm500245z
- Herzberg M, Kang S, Elimelech M. 2009. Role of extracellular polymeric substances (EPS) in biofouling of reverse osmosis membranes. Environ Sci Technol. 43:4393–4398. doi: 10.1021/es900087j
- Jackson JE. 2003. A user’s guide to principle components. Hoboken, NJ: Wiley.
- Jia XS, Furumai H, Fang HHP. 1996. Extracellular polymers of hydrogen-utilizing methanogenic and sulfate-reducing sludges. Water Res. 30:1439–1444. doi: 10.1016/0043-1354(96)00028-0
- Jiao Y, Cody GD, Harding AK, Wilmes P, Schrenk M, Wheeler KE, Banfield JF, Thelen MP. 2010. Characterization of extracellular polymeric substances from acidophilic microbial biofilms. Appl Environ Microbiol. 76:2916–2922. doi: 10.1128/AEM.02289-09
- Jin L, Ong SL, Ng HY. 2013. Fouling control mechanism by suspended biofilm carriers’ addition in submerged ceramic membrane bioreactors. J Membr Sci. 427:250–258. doi: 10.1016/j.memsci.2012.09.016
- Jung Y, Alayande AB, Chae S, Kim IS. 2018. Applications of nisin for biofouling mitigation of reverse osmosis membranes. Desalination. 429:52–59. doi: 10.1016/j.desal.2017.12.003
- Kansiz M, Heraud P, Wood B, Burden F, Beardall J, McNaughton D. 1999. Fourier Transform Infrared microspectroscopy and chemometrics as a tool for the discrimination of cyanobacterial strains. Phytochemistry. 52:407–417. doi: 10.1016/S0031-9422(99)00212-5
- Karadenizli A, Kolayli F, Ergen K. 2007. A novel application of Fourier-transformed infrared spectroscopy: classification of slime from staphylococci. Biofouling. 23:63–71. doi: 10.1080/08927010601143524
- Karime M, Bouguecha S, Hamrouni B. 2008. RO membrane autopsy of Zarzis brackish water desalination plant. Desalination. 220:258–266. doi: 10.1016/j.desal.2007.02.040
- Khan MT, Hong PY, Nada N, Croue JP. 2015. Does chlorination of seawater reverse osmosis membranes control biofouling? Water Res. 78:84–97. doi: 10.1016/j.watres.2015.03.029
- Krishnamurthy K, Tewari J, Irudayaraj J, Demirci A. 2010. Microscopic and spectroscopic evaluation of inactivation of staphylococcus aureus by pulse UV light and infrared heating. Food Bioprocess Technol. 3:93–104. doi: 10.1007/s11947-008-0084-8
- Kristensen JB, Meyer RL, Laursen BS, Shipovskov S, Besenbacher F, Poulsen CH. 2008. Antifouling enzymes and the biochemistry of marine settlement. Biotechnol Adv. 26:471–481. doi: 10.1016/j.biotechadv.2008.05.005
- Lee J, Jung JY, Kim S, Chang IS, Mitra SS, Kim IS. 2009. Selection of the most problematic biofoulant in fouled RO membrane and the seawater intake to develop biosensors for membrane biofouling. Desalination. 247:125–136. doi: 10.1016/j.desal.2008.12.018
- Li J, Yang F, Liu Y, Song H, Li D, Cheng F. 2012. Microbial community and biomass characteristics associated severe membrane fouling during start-up of a hybrid anoxic-oxic membrane bioreactor. Bioresour Technol. 103:43–47. doi: 10.1016/j.biortech.2011.09.079
- Liu H, Fang HH. 2002. Extraction of extracellular polymeric substances (EPS) of sludges. J Biotechnol. 95:249–256. doi: 10.1016/S0168-1656(02)00025-1
- Long G, Zhu P, Shen Y, Tong M. 2009. Influence of extracellular polymeric substances (EPS) on deposition kinetics of bacteria. Environ Sci Technol. 43:2308–2314. doi: 10.1021/es802464v
- Lutskiy MY, Avneri-Katz S, Zhu N, Itsko M, Ronen Z, Arnusch CJ, Kasher R. 2015. A microbiology-based assay for quantification of bacterial early stage biofilm formation on reverse osmosis and nanofiltration membranes. Sep Purif Technol. 141:214–220. doi: 10.1016/j.seppur.2014.12.003
- Ma L, Jackson KD, Landry RM, Parsek MR, Wozniak DJ. 2006. Analysis of Pseudomonas aeruginosa conditional psl variants reveals roles for the psl polysaccharide in adhesion and maintaining biofilm structure post attachment. J Bacteriol. 188:8213–8221. doi: 10.1128/JB.01202-06
- Mayer C, Moritz R, Kirschner C, Borchard W, Maibaum R, Wingender J, Flemming HC. 1999. The role of intermolecular interactions: studies on model systems for bacterial biofilms. Int J Biol Macromol. 26:3–16. doi: 10.1016/S0141-8130(99)00057-4
- Nagaraj N, Skillman L, Xie Z, Jiang S, Ho G, Li D. 2017. Investigation of compounds that degrade biofilm polysaccharides on reverse osmosis membranes from a full-scale desalination plant to alleviate biofouling. Desalination. 403:88–96. doi: 10.1016/j.desal.2016.06.002
- Nagaraj V, Skillman L, Li D, Ho G. 2018. Review: Bacteria and their extracellular polymeric substances causing biofouling on seawater reverse osmosis desalination membranes. J Environ Manage. 223:586–599. doi: 10.1016/j.jenvman.2018.05.088
- Nguyen T, Roddick FA, Fan L. 2012. Review: Biofouling of water treatment membranes: a review of the underlying causes, monitoring techniques and control measures. Membranes (Basel). 2:804–840. doi: 10.3390/membranes2040804
- Nivens DE, Ohman DE, Williams J, Franklin MJ. 2001. Role of alginate and its O acetylation in formation of Pseudomonas aeruginosa microcolonies and biofilms. J Bacteriol. 183:1047–1057. doi: 10.1128/JB.183.3.1047-1057.2001
- Ozturk S, Aslim B, Suludere Z. 2010. Cadmium (II) sequestration characteristics by two isolate of Synechocystis sp. in terms of exopolysaccharide (EPS) production and monomer composition. Bioresource Technol. 101:9742–9748. doi: 10.1016/j.biortech.2010.07.105
- Prolund B, Palmgren R, Keiding K, Nielsen PH. 1996. Extraction of extracellular polymers from activated sludge using a cation exchange resin. Water Res. 30:1749–1758. doi: 10.1016/0043-1354(95)00323-1
- Rabiller-Baudry M, Gouttefangeas F, Le Lannic J, Rabiller P. 2012. Coupling of SEM-EDX and FTIR-ATR to (quantitatively) investigate organic fouling on porous organic composite membranes. Current Microscopy Contributions to Advances in Sciences and Technology, Formatex Research Center.
- Rinzema A, van Lier J, Lettinga G. 1988. Sodium inhibition of acetoclastic methanogens in granular sludge from a UASB reactor. Enzyme Microb Technol. 10:24–32. doi: 10.1016/0141-0229(88)90094-4
- Salido EM, Servalli LN, Gomez JC, Verrastro C. 2017. Phototransduction early steps model based on Beer-Lambert optical law. Vision Res. 131:75–81. doi: 10.1016/j.visres.2016.12.012
- Sheng GP, Yu HQ. 2006. Relationship between the extracellular polymeric substances and surface characteristics of Rhodopseudomonas acidophila. Appl Microbiol Biotechnol. 72:126–131. doi: 10.1007/s00253-005-0225-1
- Sheng G-P, Yu H-Q, Yu Z. 2005. Extraction of extracellular polymeric substances from the photosynthetic bacterium Rhodopseudomonas acidophila. Appl Microbiol Biotechnol. 67:125–130. doi: 10.1007/s00253-004-1704-5
- Sheng GP, Yu HQ, Yue Z. 2006. Factors influencing the production of extracellular polymeric substances by Rhodopseudomonas acidophila. Int Biodeter Biodegr. 58:89–93. doi: 10.1016/j.ibiod.2006.07.005
- Shih W-Y, Gao J, Rahardianto A, Glater J, Cohen Y, Gabelich CJ. 2006. Ranking of antiscalant performance for gypsum scale suppression in the presence of residual aluminum. Desalination. 196:280–292. doi: 10.1016/j.desal.2006.04.001
- Stuart HB. 2004. Spectral analysis. Chapter 3. In: Infrared spectroscopy: fundamentals and applications. Hoboken (NJ): John Wiley and Sons Ltd. p. 57.
- Sun Y, Yaoyao F, Peng L, Xia H. 2016. Effects of online chemical cleaning on removing biofouling and resilient microbes in a pilot membrane bioreactor. Int Biodeter Biodegr. 112:119–127. doi: 10.1016/j.ibiod.2016.05.010
- Sweity A, Oren Y, Ronen Z, Herzberg M. 2013. The influence of antiscalants on biofouling of RO membranes in seawater desalination. Water Res. 47:3389–3398. doi: 10.1016/j.watres.2013.03.042
- Sweity A, Zere TR, David I, Bason S, Oren Y, Ronen Z, Herzberg M. 2015. Side effects of antiscalants on biofouling of RO membranes in brackish water desalination. J Membr Sci. 481:172–187. doi: 10.1016/j.memsci.2015.02.003
- Tang CY, Chong TH, Fane AG. 2011. Colloidal interactions and fouling of NF and RO membranes: a review. Adv Colloid Interface Sci. 164:126–143. doi: 10.1016/j.cis.2010.10.007
- Tang C, Kwon YN, Leckie JO. 2009. The role of foulant-foulant electrostatic interaction on limiting flux for RO and NF membranes during humic acid fouling–theoretical basis, experimental evidence, and AFM interaction force measurement. J Memb Sci. 326:526–532. doi: 10.1016/j.memsci.2008.10.043
- Vrouwenvelder JS, Manolarakis SA, Veenendaal HR, Van der Kooij D. 2000. Biofouling potential of chemicals used for scale control in RO and NF membranes. Desalination. 132:1–10. doi: 10.1016/S0011-9164(00)00129-6
- Xu P, Bellona C, Drewes JE. 2010. Fouling of nanofiltration and reverse osmosis membranes during municipal wastewater reclamation: membrane autopsy results from pilot-scale investigations. J Membr Sci. 353:111–121. doi: 10.1016/j.memsci.2010.02.037
- Yigit NO, Harman I, Civelekoglu G, Koseoglu H, Cicek N, Kitis M. 2008. Membrane fouling in a pilot-scale submerged membrane bioreactor operated under various conditions. Desalination. 231:124–132. doi: 10.1016/j.desal.2007.11.041
- Wolf G, Crespo JG, Reis MAM. 2002. Optical and spectroscopic methods for biofilm examination and monitoring. Rev Environ Sci Biotechnol. 1:227–251. doi: 10.1023/A:1021238630092