
Abstract
Biofouling accumulation on ships’ submerged surfaces typically occurs during stationary periods that render surfaces more susceptible to colonization than when underway. As a result, stationary periods longer than typical port residence times (hours to days), often referred to as lay-ups, can have deleterious effects on hull maintenance strategies, which aim to minimize biofouling impacts on ship operations and the likelihood of invasive species transfers. This experimental study tested the effects of different lay-up durations on the magnitude of biofouling, before and after exposure to flow, using fouling panels with three coating treatments (antifouling, foul-release, and controls), at two sites, and a portable field flume to simulate voyage sheer forces. Control panels subjected to extended stationary durations (28-, 45- and 60-days) had significantly higher biofouling cover and there was a 13- to 25-fold difference in biofouling accumulation between 10-days and 28-days of static immersion. Prior to flume exposure, the antifouling coating prevented biofouling accumulation almost entirely at one site and kept it below 20% at the other. Foul-release coatings also proved effective, especially after flume exposure, which reduced biofouling at one site from >52% to <6% cover (on average). The experimental approach was beneficial for co-locating panel deployments and flume processing using a consistent (standardized) flow regime on large panels across sites of differing conditions and biofouling assemblages. While lay-ups of commercial vessels are relatively common, inevitable, and unavoidable, it is important to develop a better understanding of the magnitude of their effects on biofouling of ships’ submerged surfaces and to develop workable post-lay-up approaches to manage and respond to elevated biofouling accumulation that may result.
Introduction
Vessel biofouling is a long-standing operational problem for the maritime shipping industry and has come under renewed and increasing scrutiny as a vector of nonindigenous species (Davidson et al. Citation2016). Its impact on vessel propulsion is well documented, whereby significantly more power and fuel consumption are required to maintain speed as biofouling increases on hull surfaces (Townsin Citation2003; Schultz et al. Citation2011). Vessel biofouling also reduces maneuverability and affects intakes and internal seawater systems, requiring earlier and more frequent maintenance and asset management costs than would otherwise be needed (Grandison et al. Citation2011). In addition, vessel biofouling has a long history and widespread potency as a transfer mechanism (vector) of introduced species, often ranked the highest for vector strength in different locations throughout the world (Eldredge and Carlton Citation2002; Hewitt and Campbell Citation2010; Ruiz et al. Citation2011; Davidson et al. Citation2018). Sampling of ships over the last two decades confirms that the vector remains active (Coutts and Taylor Citation2004; Davidson et al. Citation2009; Sylvester et al. Citation2011; Ashton et al. Citation2016), despite significant investment and application of preventive biofouling measures in the maritime industry (Dafforn et al. Citation2011). As a result, new strategies and policies are being advanced to reduce biofouling-mediated introductions from ships (International Maritime Organization (IMO) Citation2011; Scianni et al. Citation2019; New Zealand Government Citation2014).
While many factors can affect the magnitude of biofouling and risk of species transfer (Davidson et al. Citation2018), vessel lay-ups or extended stationary (idle) periods in a bay or port can cause high biofouling and are an increasing focus of management and policy. These extended idle periods are associated with increased biofouling colonization of vessels because (1) colonization occurs primarily during periods of vessel inactivity rather than when a vessel is underway; (2) hydrodynamic forces that remove biofouling are not occurring; and (3) antifouling (AF) and foul-release (FR) coatings are designed to function under normal movement speeds and conditions rather than in the absence of vessel movement. A period of inactivity often provides a major mismatch between a ship’s typical operational profile and the conditions under which its AF or FR coating was intended to work. While there is long-standing theoretical support for stationary period as a risk factor, with some evidence from sampled ships (e.g. Visscher Citation1928; Lewis et al. Citation2006; Davidson, McCann, Fofonoff, et al. Citation2008; Sylvester et al. Citation2011), the multi-factorial nature of ship biofouling and variation in biofouling among ships obscures potential threshold levels for acceptable (low-risk) durations of idle or lay-up periods (Inglis et al. Citation2010).
Commercial ships are idle or laid-up during periods of unemployment or under-employment in the shipping fleet or as a function of decommissioning when ships reach the end of their life cycle (Davidson, McCann, Fofonoff, et al. Citation2008). Idle periods and lay-ups are differentiated by whether or not a vessel is powered- and manned-down for a period (lay-up) or remains at operational levels until called into service again (idle period). These stationary periods (the terms are used interchangeably here) typically occur at anchorage and vessels can remain stationary for weeks or months at a time until they are re-deployed to a shipping service. Lay-ups of commercial ships can occur in pulses, as during the global recession of 2009 when steep declines in trade resulted in large fleets of unemployed ships (Floerl and Coutts Citation2009). Some vessels, such as naval ships, military support or supply ships, cable laying ships, and construction barges can remain stationary in ports or anchorages for weeks or months as part of their typical operational schedule. Since 2008, ships arriving to California have submitted an annual Hull Husbandry Reporting Form (HHRF, now part of an annual vessel reporting form), in which they report the durations and locations of lay-ups and other idle periods. This data set is rare and possibly unique to the state as a means of understanding trends in behavior of visiting vessels (Scianni et al. Citation2019). Vessels reported over 7,800 total arrivals to California following idle periods of ten days or greater between 2011 and 2015, with no biofouling management occurring between being idle and arriving in California. These include 6,047 arrivals with 10–20 day lay-ups, 1,159 with 20–30 day lay-ups, 396 with 30–45 day lay-ups, and 210 with 45+ day stationary periods. These vessels were stationary in temperate and tropical locations across the six populated continents of the world prior to arrival in California, with notable hotspots in East Asia, the West Coast of North America, Europe, and the Gulf and East Coast of the US.
It is not clear what these lay-up durations mean in terms of nonindigenous species transport and introduction risk, although it is reasonable to infer that vessels with longer and more frequent lay-ups present a higher risk than vessels without such lay-ups. Quantitative information on the effect of lay-up is not well advanced, however, and could provide a better understanding of the difference between port durations (hours/days) vs durations typical of lay-ups (weeks/months), as well as identifying thresholds for remediation by vessel operators or for policy. The goal of this study was to experimentally evaluate the relationship between stationary duration and biofouling accumulation to determine some quantitative characteristics of transfer risk after lay-ups. Specifically, replicate steel panels with commercial vessel coatings applied by industry coating experts were used to test the effect of immersion time (analogous to stationary duration) and coating type on biofouling accumulation. Each panel was then subjected to 10 min of 11.75 knot current speeds in a flume to test the subsequent effect of water movement on short-term retention of biofouling on panels, as a proxy for vessel movement.
Methods
The experimental study was carried out at two sites, one each on the East Coast (Chesapeake Bay) and West Coast (San Francisco Bay) of the USA. In the summer of 2017, fouling panels were deployed at Cape Charles marina (37.2648 N, 76.0177 W) on the eastern shore of the lower Chesapeake Bay. Cape Charles is a historic fishing and boating harbor with commercial docking space used primarily by barges. Its docks are colonized by a marine biofouling community consisting of oysters, barnacles, tubeworms, bryozoans, sponges, hydroids and a diversity of associated mobile fauna. The salinity in the harbor during the study was 24ppt to 28ppt. The following year, the same protocols were followed at the US Army Corps of Engineers dock in Sausalito California (37.86464 N, 122.49442 W), on the northwest shore of San Francisco Bay. The docks in this part of San Francisco Bay are dominated by bryozoans and ascidians and the salinity was 28ppt to 32ppt throughout that deployment.
Rectangular steel panels of 113cm2 area (8.9 cm × 12.7 cm × 0.25 cm) were assigned to one of three coating treatments, viz AF, FR, and a control. All panels had a barrier anti-corrosion coating applied to the front and back surfaces (Intershield® 300, AkzoNobel) and no other coating was added for the control panels. A commercial AF self-polishing copolymer coating (Interswift® 6800HS, AkzoNobel) and a foul-release coating (Intersleek® 1100SR, AkzoNobel) each widely used by contemporary in-service ships, were applied on top of the anti-corrosion coating on the front face and edges of panels for their respective treatments. Coatings were applied by the commercial manufacturer and ‘aged’ for six weeks in separate tanks of artificial seawater (potable water plus Instant Ocean™) per treatment-type. The saltwater aging step was recommended by the manufacturer to provide time for leaching (especially the A/F coating) and surface conditioning. The artificial seawater ensured no biological colonization of panels occurred prior to the experiment and the water was exchanged weekly.
At the end of the six-week aging process, eight panels of each coating treatment were affixed to a large PVC backing plate (an array). A total of 18 backing plates were deployed for 144 panels per site (3 treatments × 6 soak durations × 8 replicates). On the day of first deployment, all 18 arrays (for a single site) were suspended from a floating dock 1 m below the surface in Chesapeake and San Francisco Bays. Deployment began on 28 August 2017 in Chesapeake Bay and 31 July 2018 in San Francisco Bay. One array of each coating treatment was retrieved after 3-, 6-, 10-, 28-, 45- and 60-days post-deployment. This range of soak times is representative of ships’ stationary durations during typical port visits or longer lay-ups. On each retrieval day, an array was taken from its submerged location under the dock and placed in a large tank of ambient seawater. Individual panels were removed from the backing plate and photographed. After several images were taken, the panel was inserted into a flume and subjected to 10 min of flow held within a range of 11.5 to 12 knots as indicated by a knot meter located 10 cm upstream of the leading edge of the panels. Flow is an important determinant of biofouling retention on ships by applying shear forces to organisms during transit (Coutts, Piola, Hewitt, et al. Citation2010). Organism attachment strengths and drag forces contribute to variation in dislodgement of species in flow conditions (Clarke Murray et al. Citation2012). Coatings are also engineered to integrate seawater interactions, vessel movement, and water flow into their performance by releasing, leaching, or ablating components of the coating (for many AF coatings) or reducing biofouling retention on minimally adhesive surfaces (for FR coatings; Dafforn et al. Citation2011). After the 10-min flume duration, panels were re-photographed and voucher specimens were taken of any organisms that remained that could not be identified in the field.
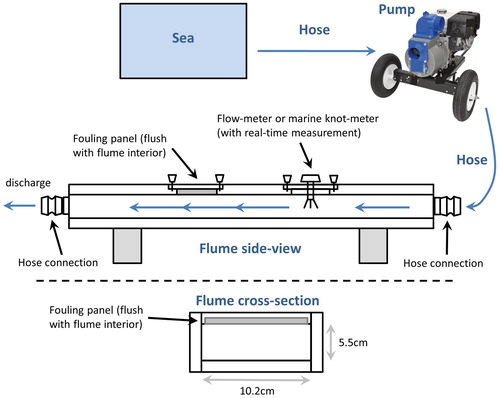
The flume consisted of a 37,800 GPH pump, a 1.8 m long PVC flume with knot meter and hatch to fit panels, and 10 cm diameter hoses that connected the pump to the water source and the flume to the pump (). The knot meter had digital speed display and speed transducer with paddle-wheel, which was flush-mounted so the paddles were the only item protruding into the flume chamber (Raymarine i50 speed instrument display, model E70058; Raymarine through-hull low-profile shorty speed transducer, model E26008; speed range 0.1–40 knots, sensitivity 0.1 knots). The flume was constructed from a section of 4-inch ID schedule 40 PVC pipe. Gentle ramps were inset into one side of the pipe to intensify flow and allow a flat deck to be mounted with a hatch for panel insertion and the knot meter. The deck and hatch were composed of FR4 epoxy-glass laminate sheet, and the finished assembly was bonded and encapsulated in fiberglass-epoxy. Connectors for 4-inch hoses were of the camlock or lever-lock variety. Cross-sectional area of the flow-path in the vicinity of the plate hatch was vertically constrained by ramps such that velocities between 7-knots and 16-knots could be attained by adjusting the revolutions-per-minute (rpm) of the 12 horse-power gasoline-powered pump. There were also bypass valves built into the flume to allow water diversion during transitions between panels without turning the pump off. The custom design and portability of the flume allowed for co-location of deployed panels and panel processing on the dock during each retrieval day. A sequenced workflow of panel collection > photographing > flume > photographing was set up to process each array of eight replicate panels per coating treatment on each day.
Figure 1. Diagrammatic representation of the flume design. Water was pumped from the sea by a 37,800GPH pump placed on a marina dock. Large hoses and their couplings connected the water source to the pump and flume. The flume was 1.8 m long and 10.2 cm × 5.5 cm in cross-section in the area of the panel chamber. Flume input and output including connecting hoses were 10.2 cm in diameter. The flume hatch allowed panels to be installed flush with the interior walls and a flow/knot meter provided real-time flow data. Control valves at the couplings for the discharge hose allowed flow to be diverted and regulated during panel swaps.
Panels were analyzed for percentage cover of bare space and biofouling macroorganisms using a point count method. A grid of 100 superimposed crosshair points was placed over each panel’s image to determine cover of colonizing organisms per panel. Identity of colonizing species was determined in the field when possible and by the collection of voucher specimens for laboratory and taxonomic expert determinations. Voucher specimens were only collected from post-flume panels so as not to disturb biofouling assemblages before panels were inserted into the flume. A three-way analysis of variance (ANOVA) was used to test for differences among sites, immersion durations, and coatings for both pre- and post-flume cover of biofouling. Single-factor ANOVAs, Tukey’s post hoc tests, and t-tests were also used to compare different levels within significant factors.
Results
Biofouling accumulation increased markedly on the control panels between 10 and 28 days of immersion at both sites (F5,90 = 3269.44, p < 0.001). Control panels had a significantly higher extent of biofouling after immersion for 28 days, when biofouling exceeded 85% cover (on average), and was largely saturated with biofouling by day 45 (). Panels soaked for 10 days or fewer had < 10% cover of macrofouling (on average <6.5% for each coating treatment). Well-developed biofouling assemblages in Chesapeake Bay were dominated by low-profile (<4mm vertical height) hard-bodied polychaetes, barnacles, and bryozoans. Prominent species included the serpulid Hydroides dianthus, the spirorbid Paradexiospira sp., and the sabellid Parasabella microphthalma (all polychaetes); the barnacles Amphibalanus amphitrite, A. improvisus, and A. eburneus; and the bryozoans Amathia sp. Biflustra tenuis and Schizoporella variabilis (). By contrast, San Francisco assemblages had high vertical profile and multi-layered species of bryozoans and ascidians, many of which extended >5cm in height from the panel surface. Dominant species included the arborescent bryozoans Bugula neritina and Bugula stolonifera; and the solitary ascidians Ciona savignyi, Ciona robusta, Molgula sp. and Ascidia sp.
Figure 2. Biofouling cover on settlement panels with varying in-water durations and different coatings. The mean percentage cover of biofouling and the SD are shown for panels (n = 8 per treatment) under static conditions (i.e. before being subjected to the flume). The control panels showed a substantial increase in biofouling after immersion for 10 days. The A/F coating maintained low levels of biofouling accumulation under static conditions at both sites. The F-R coating had a notable accumulation at the West Coast site under static conditions.
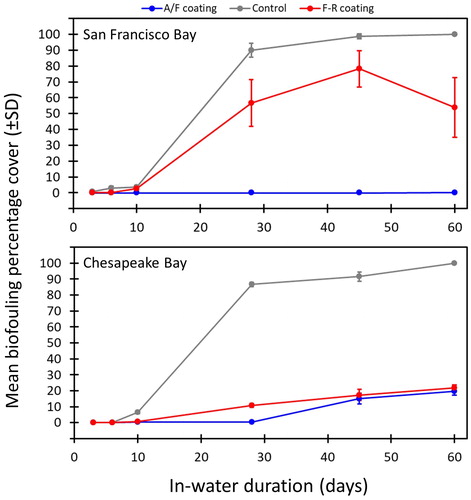
Table 1. Species occurrence on biofouling panels after being subjected to the flume.
The coated panels, experiencing the same ambient propagule pressure as control panels, had substantially lower biofouling accumulation than the controls (F2,285 = 50.76, p < 0.001). The controls diverged from coated panels after six days of immersion time in Chesapeake Bay and differed significantly from them by the tenth day (Tukey’s post hoc test; ). Significant differences among coated panels and controls only emerged after 28 days in San Francisco Bay. The AF coating (A/F) had the least accumulation throughout the study and was almost completely effective (for deterring macroorganisms) in San Francisco Bay for all immersion durations (). In Chesapeake Bay, it was also completely effective for panels submerged for up to 28 days, but macrofouling accumulated on AF panels after immersion for 45 days, most often consisting of barnacles and Amathia sp. (a stoloniferous bryozoan).
FR panels in Chesapeake Bay had more biofouling on day 28 compared to AF panels (t-test, t = −8.85, p < 0.001), but the two treatments did not differ after 45- and 60-day durations (t-tests, both p > 0.5; ). The FR coating accumulated substantially more biofouling under static conditions in San Francisco Bay, although these larger-sized organisms (compared to Chesapeake species) were sometimes able to colonize the backing (PVC) plate to gain a ‘foothold’ on these panels.
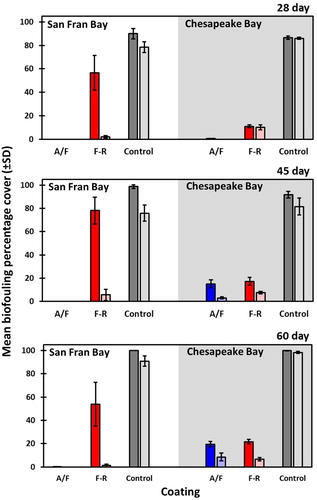
The most pronounced effect of the flume treatment occurred for FR panels submerged for 28-, 45- and 60-days at the West Coast site (). In each instance, the flume effect reduced biofouling that had exceeded 50% cover (on average) per panel to < 6% cover (representing > 90% reduction of the original biofouling that occurred under static conditions). Significant but much smaller magnitude reductions in biofouling also occurred for the AF and control panels subjected to flume conditions. For example, 45-day AF panels had reductions in biofouling from 15.1% to 3.1% cover (). Interestingly, flume conditions often had the effect of ejecting the internal body parts of large solitary ascidians from control panels, but the outer tunic of those species remained. Due to their high initial vertical profile, these organisms could have received localized flume flow rates higher than indicated since the knot meter was upstream as opposed to directly below the plate hatch. The overall cover of biofouling remained higher than 75% (on average) on control panels after flume conditions compared to <10% and <8.5% for FR and AF panels, respectively.
Figure 3. Effect of water movement on biofouling cover. The mean (and SD) biofouling percentage cover is shown for panels pre- and post-flume exposure after submergence for 28-, 45-, and 60-days. The AF fouling coating (A/F) is shown in dark blue (pre-flume) and light blue (post-flume); the FR coating (F-R) is shown in red (pre-flume) and pink (post-flume); control panels are shown in dark and light grey (pre- and post-flume, respectively). West Coast (San Francisco Bay) and East Coast (Chesapeake Bay) sites are shown on the left and right sides of each plot.
For coated panels, remnant colonies or individuals that were retained on post-flume panels were typically low-profile species that endured flume conditions. In San Francisco Bay, major reductions in biofouling cover from pre- to post-flume () typically included the loss of larger (and taller) solitary ascidians, but small patches of colonial species (Diplosoma listerianum, Botryllus schlosseri, Botrylloides violaceus) occasionally remained along with encrusting bryozoans Membranipora sp. and Watersipora sp (). Chesapeake Bay’s F-R panels also lost biofouling post-flume, but Hydroides dianthus (serpulid polychaete) and bryozoans (Cryptosula pallasiana, Schizoporella variabilis, and Biflustra tenuis) proved somewhat tenacious colonizers.
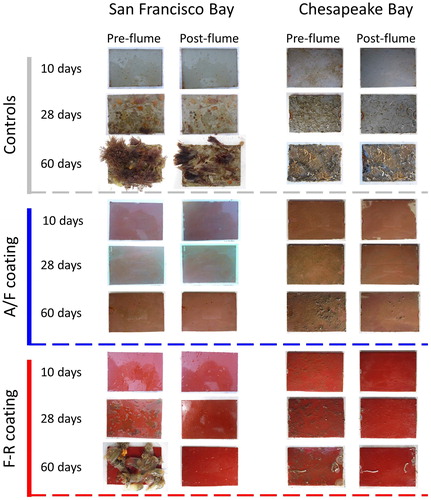
Figure 4. Photographs of biofouling panels before- and after-flume processing. Representative examples of panels for 10-, 28- and 60-days immersion periods are shown by coating treatment (controls, A/F, and F-R). Paired images show the same panel before (left) and after (right) being subjected to the flume.
Discussion
Idle periods are not rare events in the maritime shipping industry. In California alone, > 1,000 idle periods per year (≥ 10 days) are reported by vessels arriving in a recent 5-year period, with potential consequences for biofouling accumulation and species transfers by such vessels. They pose problems for coating selection for vessels with predictable idle periods (Houghton and Gage Citation1979) and affect coating performance for vessels experiencing unpredictable idle and lay-up durations. In this experiment, control panels from both coasts highlighted the rapid increase in biofouling colonization after 10 days of static immersion. Biofouling colonization was minimal across coating treatments and control panels for durations of 3–10 days that slightly exceed routine port residence times of hours to days for in-service ships. Initial conditioning biofilms and more mature slimes developed over the first 10 days and incipient macrofouling colonizers began to appear on control panels, including hydroids and bryozoans in Chesapeake Bay and Bugula species (bryozoans) and colonial ascidians in San Francisco Bay. After immersion for 28 days, there was a 13- to 25- fold increase in biofouling accumulation on the control panels compared to the 10-day panels. Multi-layered communities developed at both sites as primary space was saturated with colonizers, although with quite different assemblages of animals. This temporal progression of biofouling cover and community development aligns with other experimental studies using FR coatings that recorded step-increases in accumulation between 14- and 28-day immersed panels (Hunsucker et al. Citation2016). The present study’s experimental data suggest vessels with lay-ups >10 days can accumulate significant biofouling cover, representing an inflection point for biofouling magnitude that is relevant for management strategies to optimize vessel performance and reduce risks of species invasions.
Minimizing biofouling on the submerged surfaces of ships aims to provide operational and environmental benefits (Abbott et al. Citation2000; Dafforn et al. Citation2011; Schultz et al. Citation2011; Davidson et al. Citation2016). The primary approach is to apply effective modern coatings that inhibit settlement or retention of organisms to maintain a smooth surface, which in turn reduces fuel consumption and greenhouse gas emissions and limits the number of species in transit that can lead to biological invasions. This experimental study highlighted the efficacy of such modern coatings for reducing biofouling colonization relative to controls, albeit for brand new coatings near the peak of their performance, which may be expected to decline with age of the coating. Under static conditions, the AF coating served to maintain macrofouling cover near zero for up to 28-days immersion for both sites, and 45- and 60-days immersion in San Francisco Bay. However, there was an increase in macrofouling cover on 45- and 60-days AF panels in Chesapeake Bay, although the overall coverage remained <20% of the accumulation recorded on controls. The taxa that occurred on those Chesapeake AF panels were primarily the stoloniferous bryozoan Amathia sp. (formerly Bowerbankia), an unidentified campanularid hydroid, and recently settled striped barnacles Amphibalanus amphitrite. Surprisingly, the absence of biofouling on San Francisco Bay’s AF panels meant that the arborescent bryozoan Bugula neritina and encrusting Watersipora sp., which are common ship foulers and somewhat copper tolerant (Piola and Johnston Citation2006, Citation2009), were unable to settle, despite being dominant space occupiers on controls and also occurring on the FR panels at that site.
The duration of a ship’s in-service period is strongly correlated with its AF coating efficacy (Thomason Citation2010) and both manufacturer guidelines and environmental policies strongly urge end-users to renew coatings to ensure they do not operate outside their coatings’ intended service age (International Maritime Organization (IMO) Citation2011; California State Lands Commission Citation2017; New Zealand Government Citation2018). Studies of in-service ships have shown that biofouling increasingly occurs on submerged surfaces after ∼ 400 days (Inglis et al. Citation2010; Sylvester et al. Citation2011). This timeline is substantially lower than the service duration of marine coatings, including those used in this study. The occurrence of biofouling relatively early in the service life of coatings (about one-fifth of the duration) is related to accumulation on niche areas of vessels and a range of other factors experienced by ships that can undermine coating efficacy. While this experiment provides a measure of the magnitude of effect that new AF coatings can have for reducing biofouling colonization, this type of experimental approach could also be used to test a more expansive range of coating ages (and types) to better understand the effect of time and ‘wear’ on efficacy. This could meet a critical need for assessing operational performance and invasion risk, for both industry and environmental interests, given the profile of coating ages for ships arriving in California in recent years that includes 35% of vessels with coatings less than one-year-old but 20% with coatings older than three years (Brown et al. Citation2017).
Unlike controls and AF treatments, which largely followed the same patterns at both sites, FR panels differed substantially between sites under static conditions. Biofouling accumulation in San Francisco Bay was extensive for the three longest soak durations of FR treatments (ranging from 31% to 95% cover among replicates), though it should be noted that the adjacency of the backing plate appeared to provide the ‘foothold’ for assemblages to spread to some adjacent panels. In Chesapeake Bay, FR panels were colonized by the serpulid polychaete Hydroides dianthus, unidentified campanularid hydroids, and bryozoans (Biflustra tenuis, Schizoporella variabilis, Amathia sp.), but an equivalent extent of biofouling cover did not occur (). Exposure to flume conditions, however, produced more equitable outcomes for the performance of FR coated panels at both sites. This outcome reflects the underlying mechanism of FR coatings to create such minimal surface tension for colonizers, whereby subsequent vessel movement, even at the lower end of vessel typical speeds, is sufficient to greatly reduce biofouling retention on surfaces (Anderson et al. Citation2003; Callow and Callow Citation2011). Average biofouling cover for FR treatments (28-, 45- and 60-day durations) at both sites was reduced by flow to <10% and the magnitude of flow impact on biofouling was most clearly demonstrated for FR panels in San Francisco Bay (). West Coast FR panels that had substantial cover of Bugula spp. (bryozoans), botryllid ascidians, and large-bodied solitary ascidians (Ciona savignyi, Ciona robusta, and Ascidia sp.) were wiped clear. Indeed, the remnant biofouling that remained on San Francisco Bay panels, mainly consisting of underlying encrusting bryozoan species (Membranipora, Watersipora and Schizoporella spp.), had a lower percentage cover compared to Chesapeake Bay’s equivalent treatments (). It may be the case that FR coatings more easily aid the removal of biofouling accumulated in static conditions (atypical of ships’ hulls) compared with dynamic biofouling growth (Hunsucker et al. Citation2016).
The flume speed of 11.5–12 knots falls on the lower end for in-service ships, although there are many that report this operational tempo and the average “typical speed” for California’s commercial arrivals in 2015 was 14.25 knots (Brown et al. Citation2017). While percentage cover of biofouling typically declines with increasing speed, there are not many examples of ‘before and after’ effects of voyages on already established biofouling communities on ships (Lewis et al. Citation2004; Davidson, McCann, Fofonoff, et al. Citation2008), especially for commercial vessels and without a plethora of other potentially confounding factors. In field experiments (using uncoated panels), the magnitude of the effect of speed on biofouling can be relatively minor (Coutts, Piola, Hewitt, et al. Citation2010; Coutts, Piola, Taylor, et al. 2010), which aligned with this study’s pre- and post-flume results for control panels from both sites ( and ). The viability of various organisms may be affected by continuous flow in the range of 5 to 15 knots, but the assemblage is usually not displaced from uncoated surfaces to any large degree. Speeds of 18 knots have had much larger effects (Coutts, Piola, Hewitt, et al. Citation2010), while the present study demonstrated the strong magnitude of effect that coatings combined with water flow can have.
This experiment was limited to standardized flume speeds that do not characterize the range of boundary layer sheer forces experienced by biofouling on real ships, as well as flow durations during voyages (just 10 min in this case). The approach proved reliable, nonetheless, for providing a consistent flow regime on large panels with a range of taxonomic composition and vertical profiles for biofouling communities. This required a powerful pump to move water at sufficient velocity while also necessitating quite short distances between the flume and the water source (the sea in this case), which made floating docks ideal for this purpose. Although the flume system had bulky components, its portability was invaluable for conducting this study at sites with contrasting conditions, which could be expanded to a broader range of sites and different biofouling assemblages. Co-location of the flume and the panel deployment sites promoted minimal handling of panel communities between retrieval and flume processing, which was especially important for foul-release coated panels in this study that had to be handled very delicately between transitions from underwater to photographic and flume processing.
Conclusions
Ships experience a broad spectrum of conditions during their service life that contributes to the dynamism of biofouling communities that colonize and develop on their submerged surfaces. Significant and costly efforts are made via coatings, in-water cleaning, dry-docking, and other maintenance regimes to minimize such biofouling accumulation, to both optimize vessel operations and minimize invasions. Lay-ups provide an important interruption to the typical operational tempo of commercial ships and represent a risk factor for biofouling accumulation that undermines hull husbandry strategies. Idle periods and lay-ups are not uncommon, as indicated by thousands of these stationary periods of 10 days or longer by commercial vessels arriving at California ports in recent years. Spikes in idle and lay-up periods can also occur across the commercial fleet during global events such as economic crises or pandemics. Static biofouling accumulation on control panels in this study provides some justification for scrutiny of vessels (by operators and regulators) that undergo idle periods of that duration or longer. Effective coatings provide strong resistance to these lay-up effects but are still undermined by static conditions, and their diminished efficacy is likely to compound as coatings age and wear and lay-up periods accumulate for individual vessels. This can have significant deleterious effects on propulsion, fuel costs, and greenhouse gas emissions, while exacerbating invasion risk (Davidson et al. Citation2016). Increasingly, when lay-ups occur it can be difficult to comply with a growing regulatory focus that promotes biofouling management best practice and clean hull standards. Vessel operators should be cognizant of lay-ups as a biofouling risk factor and the possible scrutiny that comes with it. While lay-ups of commercial vessels are inevitable and unavoidable, it is important to develop a better understanding of the risks of biofouling accumulation using experimental approaches that can control for the range of conditions vessels experience, while practicable and environmentally friendly post-lay-up strategies are needed to monitor and manage any excessive biofouling that can develop (Davidson, McCann, Sytsma, et al. Citation2008; Scianni and Georgiades Citation2019).
Acknowledgements
The authors are sincerely grateful to the Cape Charles marina harbormaster, Charlie Farlow, for permission to conduct this work at their site and their staff and patrons for their accommodation of this work and interest in the findings of this study. Similarly, the authors thank Marty Plisch at the US Army Corps of Engineers dock in Sausalito for providing an excellent, secure platform for fieldwork in San Francisco Bay. The authors are very grateful to the coating experts at International Paint/AkzoNobel for their advice and discussions on panel preparation and their application of the coatings for this research, particularly Phillip Jones, Robert Boiston, Harry Joyce and David Stark. The authors also thank several colleagues at SERC and CSLC for contributing to discussions, field trips, and taxonomic expertise during this study, including Natasha Gray-Hitchcock, Stacey Havard, Erica Keppel, Kirsten Larson, and Whitney McClees.
Disclosure statement
No potential conflict of interest was reported by the author(s).
Additional information
Funding
References
- Abbott A, Abel PD, Arnold DW, Milne A. 2000. Cost-benefit analysis of the use of TBT: the case for a treatment approach. Sci Total Environ. 258:5–19. doi:10.1016/S0048-9697(00)00505-2
- Anderson C, Atlar M, Callow M, Candries M, Milne A, Townsin RL. 2003. The development of foul-release coatings for seagoing vessels. J Marine Design Operat. B4:11–23.
- Ashton GV, Davidson IC, Geller J, Ruiz GM. 2016. Disentangling the biogeography of ship biofouling: barnacles in the Northeast Pacific. Global Ecol Biogeogr. 25:739–750. doi:10.1111/geb.12450
- Brown C, Dobroski N, Nedelcheva R, Scianni C, Thompson J. 2017. 2017 biennial report on the California marine invasive species program. California State Lands Commission, Marine Invasive Species Program, Sacramento, CA.
- California State Lands Commission. 2017. Guidance document for: biofouling management regulations to minimize the transfer of nonindigenous species from vessels arriving at California ports. California Code of Regulations, Title 2, Section 2298.1 et seq. California State Lands Commission, Marine Invasive Species Program, Sacramento, CA.
- Callow JA, Callow ME. 2011. Trends in the development of environmentally friendly fouling-resistant marine coatings. Nat Commun. 2:244. doi:10.1038/ncomms1251
- Clarke Murray C, Therriault TW, Martone PT. 2012. Adapted for invasion? Comparing attachment, drag and dislodgment of native and nonindigenous hull fouling species. Biol Invasions. 14:1651–1663. doi:10.1007/s10530-012-0178-0
- Coutts ADM, Piola RF, Hewitt CL, Connell SD, Gardner J. 2010. Effect of vessel voyage speed on survival of biofouling organisms: implications for translocation of non-indigenous marine species. Biofouling. 26:1–13. doi:10.1080/08927010903174599
- Coutts ADM, Piola RF, Taylor MD, Hewitt CL, Gardner J. 2010. The effect of vessel speed on the survivorship of biofouling organisms at different hull locations. Biofouling. 26:539–553. doi:10.1080/08927014.2010.492469
- Coutts ADM, Taylor MD. 2004. A preliminary investigation of biosecurity risks associated with biofouling on merchant vessels in New Zealand. NZ J Mar FW Res. 38:215–229. doi:10.1080/00288330.2004.9517232
- Dafforn KA, Lewis JA, Johnston EL. 2011. Antifouling strategies: history and regulation, ecological impacts and mitigation. Mar Pollut Bull. 62:453–465. doi:10.1016/j.marpolbul.2011.01.012
- Davidson I, Brown CW, Sytsma MD, Ruiz GM. 2009. The role of containerships as transfer mechanisms of marine biofouling species. Biofouling. 25:645–655. doi:10.1080/08927010903046268
- Davidson IC, McCann LD, Fofonoff PW, Sytsma MD, Ruiz GM. 2008. The potential for hull-mediated species transfers by obsolete ships on their final voyages. Divers Distrib. 14:518–529. doi:10.1111/j.1472-4642.2008.00465.x
- Davidson IC, McCann LD, Sytsma MD, Ruiz GM. 2008. Interrupting a multi-species bioinvasion vector: the efficacy of in-water cleaning for removing biofouling on obsolete vessels. Mar Pollut Bull. 56:1538–1544. doi:10.1016/j.marpolbul.2008.05.024
- Davidson I, Scianni C, Hewitt C, Everett R, Holm E, Tamburri M, Ruiz G. 2016. Mini-review: assessing the drivers of ship biofouling management-aligning industry and biosecurity goals. Biofouling. 32:411–428. doi:10.1080/08927014.2016.1149572
- Davidson IC, Scianni C, Minton MS, Ruiz G. 2018. A history of ship specialization and consequences for marine invasions, management and policy. J Appl Ecol. 55:1799–1811. doi:10.1111/1365-2664.13114
- Eldredge LG, Carlton JT. 2002. Hawaiian marine bioinvasions: a preliminary assessment. Pac Sci. 56:211–212. doi:10.1353/psc.2002.0012
- Floerl O, Coutts A. 2009. Potential ramifications of the global economic crisis on human-mediated dispersal of marine non-indigenous species. Mar Pollut Bull. 58:1595–1598. doi:10.1016/j.marpolbul.2009.08.003
- Grandison C, Piola R, Fletcher L. 2011. A review of marine growth protection system (MGPS) options for the Royal Australian Navy. DSTO-TR-2631. Defence Science and Technology Organisation, Melbourne, Australia.
- Hewitt CL, Campbell M. 2010. The relative contribution of vectors to the introduction and translocation of marine invasive species. Report to the Department of Agriculture, Fisheries and Forestry, Canberra, Australia.
- Houghton DR, Gage SA. 1979. Biology in ships. Trans Inst Mar Eng. 91:189–198.
- Hunsucker JT, Hunsucker KZ, Gardner H, Swain G. 2016. Influence of hydrodynamic stress on the frictional drag of biofouling communities. Biofouling. 32:1209–1221. doi:10.1080/08927014.2016.1242724
- Inglis GJ, Floerl O, Ahyong S, Cox S, Unwin M, Ponder-Sutton A, Seaward K, Kospartov M, Read G, Gordon D, et al. 2010. The biosecurity risks associated with biofouling on international vessels arriving in New Zealand: summary of the patterns and predictors of fouling. Report to the Ministry of Agriculture and Forestry, Biosecurity New Zealand, Wellington, NZ.
- International Maritime Organization (IMO). 2011. International Maritime Organization: guidelines for the control and management of ships’ biofouling to minimize the transfer of invasive aquatic species. Marine Environment Protection Committee. Annex 26, Resolution MEPC.207 (62). International Maritime Organization, London, UK.
- Lewis PN, Bergstrom DM, Whinam J. 2006. Barging in: a temperate marine community travels to the Sub-Antarctic. Biol Invasions. 8:787–795. doi:10.1007/s10530-005-3837-6
- Lewis PN, Riddle MJ, Hewitt CL. 2004. Management of exogenous threats to Antarctica and the sub-Antarctic Islands: balancing risks from TBT and non-indigenous marine organisms. Mar Pollut Bull. 49:999–1005. doi:10.1016/j.marpolbul.2004.07.001
- New Zealand Government. 2014. Craft risk management standards: biofouling on vessels arriving to New Zealand. New Zealand Ministry for Primary Industries, Wellington, NZ.
- New Zealand Government. 2018. Guidance document for the craft risk management standard for biofouling. GD CRMS-Biofoul. New Zealand Ministry for Primary Industries, Wellington, NZ.
- Piola RF, Johnston EL. 2006. Differential tolerance to metals among populations of the introduced bryozoan Bugula neritina. Mar Biol. 148:997–1010. doi:10.1007/s00227-005-0156-5
- Piola RF, Johnston EL. 2009. Comparing differential tolerance of native and non-indigenous marine species to metal pollution using novel assay techniques. Environ Pollut. 157:2853–2864. doi:10.1016/j.envpol.2009.04.007
- Ruiz GM, Fofonoff PW, Steves B, Foss SF, Shiba SN. 2011. Marine invasion history and vector analysis of California: a hotspot for western North America. Divers Dist. 17:362–373. doi:10.1111/j.1472-4642.2011.00742.x
- Schultz MP, Bendick JA, Holm ER, Hertel WM. 2011. Economic impact of biofouling on a naval surface ship. Biofouling. 27:87–98. doi:10.1080/08927014.2010.542809
- Scianni C, Georgiades E. 2019. Vessel in-water cleaning or treatment: identification of environmental risks and science needs for evidence-based decision making. Front Mar Sci. 6:647.
- Scianni C, Ceballos Osuna L, Dobroski N, Falkner M, Thompson J, Nedelcheva R. 2019. 2019 biennial report on the California marine invasive species program. California State Lands Commission, Marine Invasive Species Program, Sacramento, CA.
- Sylvester F, Kalaci O, Leung B, Lacoursiere-Roussel A, Clarke-Murray C, Choi FM, Bravo MA, Therriault TW, MacIsaac HJ. 2011. Hull fouling as an invasion vector: can simple models explain a complex problem? J Appl Ecol. 48:415–423. doi:10.1111/j.1365-2664.2011.01957.x
- Thomason JC. 2010. Fouling and shipping: data-mining the world’s largest antifouling archive. In: Durr S, Thomason JC, editors. Biofouling. Oxford: Blackwell; p. 207–216.
- Townsin RL. 2003. The ship hull fouling penalty. Biofouling. 19:9–15. doi:10.1080/0892701031000088535
- Visscher JP. 1928. Nature and extent of fouling of ships’ bottoms. Bullet Bur Fish. 43:193–252.