
Abstract
Temporal and spatial resolution of chemical imaging methodologies such as X-ray tomography are rapidly increasing, leading to more complex experimental procedures and fast-growing data volumes. Automated analysis pipelines and big data analytics are becoming essential to effectively evaluate the results of such experiments. Offering those data techniques in an adaptive, streaming environment can further substantially improve the scientific discovery process by enabling experimental control and steering based on the evaluation of emerging phenomena as they are observed by the experiment. Pacific Northwest National Laboratory (PNNL)'s Chemical Imaging Initiative (CII, http://imaging.pnnl.gov/) has worked since 2011 towards developing a framework that allows users to rapidly compose and customize high-throughput experimental analysis pipelines for multiple instrument types. The framework, named “Rapid Experimental Analysis” (REXAN) Framework [Citation1], is based on the idea of reusable component libraries and utilizes the PNNL-developed collaborative data management and analysis environment “Velo” to provide a user-friendly analysis and data management environment for experimental facilities. This article will discuss the capabilities established for X-ray tomography, review lessons learned, and provide an overview of our more recent work in the Analysis in Motion Initiative (AIM, http://aim.pnnl.gov/) at PNNL to provide REXAN capabilities in a streaming environment.
Introduction
Chemical imaging experiments provide a powerful platform to answer challenging scientific questions about the structure and composition of advanced materials and biological samples. A key research driver is, however, the quest to understand and possibly control the formation of chemical and biological materials. To this end, the field is developing increasingly complex experimental methods that provide higher spatial and temporal resolution, as well as utilizing multi-modal approaches to gain broader insights during any one experiment. These technological developments, while highly scientifically valuable, are posing a number of significant challenges for their user communities.
First and foremost, the increasing data rates and volumes are overwhelming existing data analysis approaches. To date, most research groups have developed their own data analysis approaches, often involving a significant amount of manual work. Unfortunately, most groups lack the expertise to adapt their techniques to the demands of big data processing. The impact of efforts from the experimental user facilities and computer science community to address this issue has been severely limited due to the heterogeneity in analytic approaches in the user communities for each instrument, as well as the large number of instruments for which such solutions would be needed. Approaches so far have included the prescriptive introduction of a single analysis pipeline per instrument or the development of one-off customized solutions. The former is often not palatable to the user communities, as it does not necessarily represent the best analytical solution and cannot be adapted and changed by the users. The latter is not a scalable approach, given the large number of currently existing analysis solutions. Our research suggests that an alternative approach could provide significant benefits. We showed that most analytical processes can be disassembled into a series of basic mathematical and image manipulation functions; these basic functions are often similar between different solutions and could indeed be reused, if offered in an easily composable form. To this end, we developed the concept of REXAN, a library of rapid experimental analytical methods suited for big data processing that can be composed into a large variety of different analytical pipelines.
A further challenge is posed by the increasingly complex experimental techniques that require extensive expertise to collect the scientific observations that they can enable. Streaming data analysis, the evaluation and interpretation of data as it is collected by the instrument, can hereby provide significant help, enabling scientists to adapt their instrument settings based on emerging results during the experiment to optimize their scientific output. This method opens the opportunity for experimental steering of chemical and biological processes due to data-analysis-driven condition and process adaptation.
In the following sections, we will describe how REXAN was used to build a tool—BioFilmViewer—for the fast analysis of X-ray tomography results for biofilm samples, as well as a brief overview of the MSIQuickView tool for the interactive analysis of spectroscopy data. We will follow this with observations on lessons learned from our three-year operational use of these tools and a description of our newest research efforts.
Use Case Example: BioFilmViewer
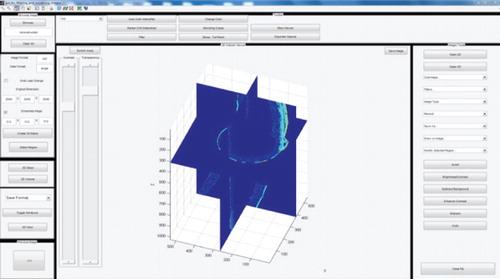
Understanding the interactions of structured communities known as “biofilms” and other complex matrixes is possible through the X-ray micro tomography imaging of the biofilms. Feature detection and image processing for this type of data focuses on efficiently identifying and segmenting biofilms and bacteria in the datasets. The datasets are very large and, in the past, required manual interventions due to low contrast between objects and high noise levels. Furthermore, the scientists used a large variety of different, incompatible tools to manipulate the data, as each offered a unique set of capabilities. The plethora of tools, the remaining level of manual intervention, and the inability of some of the tools to cope with large data volumes made the data analysis process extremely time-consuming, often taking weeks or months. Analysis during the experimental cycle was impossible. Thus, new software was required for the effectual interpretation and analysis of the data during the experiment. REXAN was used to facilitate data transfer and utilize the capabilities of the already existing powerful visualization and analytical tools, including MATLAB, ImageJ, Paraview, Chimera, Vaa3D, Cell Profiler, Icy, BioimageXD, and Drishti, as well as to provide new functionalities such as read/write capability with multiple popular file formats, downsampling large datasets to generate quick-views on low-power computers, and processing and generating high-quality images and videos [Citation1–Citation3]. These capabilities have been wrapped into a new interactive software toolkit, the BioFilmViewer (see ).
Implementation Basic Tool
REXAN includes several Graphical User Interfaces (GUIs) that enable the scientists to process and visualize the acquired data by transparently accessing the underpinning statistical, mathematical, or scientific back-end processes. Unlike commercial packages equipped with an overwhelming number of functionalities, the GUIs we created only include the required functionalities for a limited range of visualization and analysis options, which primarily results in a minimal learning curve for the user to utilize the software effectively.
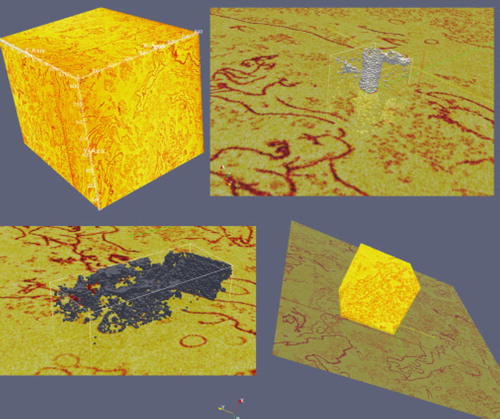
The underpinning software takes advantage of other existing open-source, third-party software, which allows the user to utilize functions from different applications through one analytical tool. Direct communication is enabled between the different software packages wherever possible. BioFilmViewer provides a platform to combine and test the useful functionalities of multiple open-source software without worrying about the input data format, data transfer across multiple software, and data size. It enables scientists to identify the useful capabilities and build their own automatic pipelines later on. The capabilities, accepted file formats, and benefits of BioFilmViewer are described in detail elsewhere [Citation1, Citation2]. Using REXAN, a pipeline with near-real-time offsite data transfer, visualization and analysis was set up which enabled the scientists to quickly validate their experiments and perform more experiments. They were able to focus on the actual science rather than worrying about data transfer or having to reach PNNL to perform even basic exploration of the data. Users at PNNL were able to generate the visualizations and other tasks locally and provide immediate feedback to the offsite scientists. In addition, the BioFilmViewer platform enables an easy interaction with the ISA-3D package, also written in MATLAB. ISA 3D has been extensively used to quantitatively analyze textural parameters showing microscale heterogeneity of biofilms and volumetric parameters generating the size and morphology of biomass [Citation4]. A particular focus of the work was the inclusion of open-source, highly scalable solutions that support parallel processing like Paraview [Citation5]. The software, in combination with the simplified REXAN GUIs, enables experimental scientists to easily view extremely large multidimensional datasets. shows the visualization and segmentation of Shewanella bacterium data in Paraview.
Additional Capabilities: Quantification of Biofilms
Extraction of quantitative parameters such as the biofilm porosity and the mean distance of biomass from channels, which describe the physical structure of the biofilm, will help to compare biofilm properties, identify the environmental variables impacting biofilm growth and development, and help monitor the biofilm growth. The biofilm porosity and mean distance of biomass from channels are being calculated in three different ways: (1) performing the computations on the original gray-scale voxel data using the existing ISA-3D software package [Citation4, Citation6]; (2) using ISA-3D on the voxel data set segmented using the threshold obtained using the Otsu algorithm; and (3) using in-house codes to perform semi-automated segmentation of the channels and biofilm external boundaries with subsequent generation of triangulated channel and biofilm surfaces via the marching cubes algorithm [Citation7]. These surfaces allow a high-quality computation of porosity and biomass spatial distribution relative to biofilm channels which could be utilized as the “gold standard” when comparing them to the more rapidly obtained ISA-3D results that do not require manual segmentation.
Use Case Example: MSI QuickView
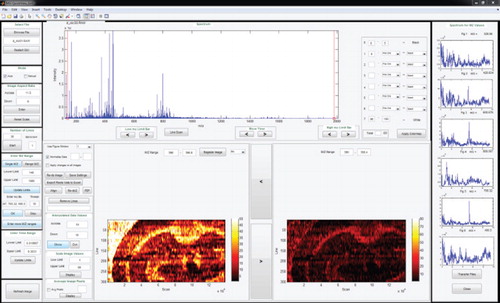
Mass spectrometry imaging (MSI) enables simultaneous spatially resolved analyses of numerous ionizable molecules on a sample surface. Nanospray desorption electrospray ionization (nano-DESI) is a relatively novel, highly sensitive, new ambient MSI technique that relies on localized liquid extraction of molecules from surfaces followed by soft nanoelectrospray ionization. Imaging experiments are performed by moving the sample under the nano-DESI probe in lines and acquiring the MSI data in a continuous manner. The mixture of high sensitivity of nano-DESI combined with high mass and spatial resolution contribute to the complexity and size of nano-DESI MSI data sets that are large in size. Existing tools could only be used post-experiment and handle no more than 100 KB of data at a time; however, the data sets collected regularly exceed several gigabytes. In addition, the new imaging method lends itself to experimental steering approaches, if results could be analyzed in real time. MSI QuickView () was designed to process, query, visualize, and analyze the nano-DESI MSI data (or any other MSI data acquired in a similar fashion), both in real time and in bulk for several experiments at a time. The software offers the user the ability to adapt m/z range limits or maximum intensity limits during the analysis process and does not require breakdown binning of the data. The application functions are accessible through user-friendly REXAN Graphical User Interfaces (GUIs). MSI QuickView provides near-real-time feedback during experimental acquisition, efficient methods to visualize and analyze entire data sets, and saves thousands of ion images onto a single PDF file for quick, convenient visualization and sharing of images. The software has several post-processing capabilities, including hierarchical clustering of ion images and a semi-automated approach to register 2D ion slices into 3D images.
MSI QuickView provides a user-friendly platform for more efficient analysis and visualization of large volumes of spatial and spectral resolution mass spectrometry datasets. Real-time visualization provides immediate feedback on the progress of live experiments, which allows the researcher to validate the quality of the experiment and make modifications if necessary. Users can compare different imaging datasets at once and quickly scroll through entire datasets. The dataset can also be saved as ion images to a single, multipage PDF file. This is a more efficient approach in terms of storing and sharing the images. MSI QuickView is developed in MATLAB, which is an easier scripting language for quick modifications. MSI QuickView has been successfully used for the quantification and visualization of several experiments [Citation8–Citation15].
Lessons Learned
In developing tools using REXAN and in the operational use of these tools, we made a number of important observations that shaped our future research.
The development of BioFilmViewer, MSI QuickView, and a number of other tools based on REXAN demonstrated that significant components of the analytical pipelines could be reused for different projects. The availability of the REXAN library enabled us to cut our average development time from many months to weeks. New capabilities and improvements requested by one team could often provide benefits to others at little extra cost. Remaining development and maintenance costs can be reduced and shared amongst teams, thus reducing the burden further.
Customized user interfaces made the complex capabilities easily accessible to novice users. The provided software solutions cut analysis times significantly for researchers, in the case of BioFilmViewer from potentially weeks to minutes, for MSI QuickView from hours to seconds, whilst allowing them to manipulate significantly larger data sets in that time period. Near-real-time analysis was readily adopted and led to improved scientific output through well-informed experimental steering choices.
While automated pipelines could help to speed up the analysis process considerably and ease the burden on the scientist, none of our users were completely satisfied with the results. The introduction of a limited range of interactive steering capabilities for the analysis process significantly improved the usefulness of the results for users. New features ranged from simple adaptation of thresholds to choices for additional analytical capabilities for regions of interest in the data. Adaptive steering of the analysis process was identified as a clear requirement for future developments.
The tools provided enabled the processing of much larger data volumes in shorter time periods, but (e.g., in the case of X-ray tomography) were not enough to provide real-time feedback during the experiment. With even higher data rates and volumes on the horizon for this and other experimental techniques, we need to find other approaches that can utilize available HPC capabilities even more strongly to gain the required speed-up and throughput. At the same time, we want to get feedback from the data analysis as early as possible, to provide users with enough time for their analytical or experimental steering tasks.
All of the users were very happy with the increased speed in initial data analysis, but pointed out that the subsequent interpretation of the data can still take months or years and remains highly manual. At times, an earlier interpretation, possibly at the time of the experiment, would have led them to make different choices in their experimental steering. Therefore, the ability to provide candidate interpretations of the experimental results as they are emerging was identified as another important research direction.
Current and Future Work
We utilized our experiences gained in the Chemical Imaging initiative to define a set of research targets that could also have a significant impact beyond the analysis of experimental data. As part of the Analysis in Motion (AIM) initiative, we are planning to develop an interactive streaming analysis and decision taking environment for high velocity data; chemical imaging is one of our core application areas for this work. Use cases for the framework are characterized by:
The velocity and volume of the data prohibiting storage for later analysis;
Critical decisions based on the analysis and interpretation of the data, which have to be taken while the data is still being collected;
Events of interest in the data that are so rare and diverse that they prohibit the use of fully automated solutions;
Analytics needing tacit knowledge from the expert user for sufficient accuracy;
Acquisition of new scientific knowledge which requires dynamic adaptation of data collection and analysis based on human judgment and intuition.
In its first year, AIM has developed a high throughout streaming infrastructure that can support data streams of upward of 600,000 messages per second, where each message would be, e.g., a single image. The infrastructure is running on a number of dedicated nodes on our local PNNL Institutional Computing facility (PIC). The core focus of the research work is the development of fast, iterative mathematical functions (similar to REXAN) that can be flexibly combined into analytical pipelines. New in this work is the addition of inductive and deductive reasoning components that aid the streaming classification and interpretation of the emerging results, including support for the early identification of emerging phenomena. Furthermore, a significant part of our research is concentrating on enabling collaborative analysis between several scientists and the analysis system. We are not only aiming to enable users to adapt and steer the analysis and data collection in near-real time, but are investigating how we can capture and utilize the users' expert knowledge to improve the analysis process at runtime to maximize the scientific output for the researcher.
For the year one test case in Nuclear Magnetic Resonance (NMR) analysis, we were able to develop an interactive analytical environment that allowed us to identify components in complex biological samples with high accuracy in a fraction of the scans normally used while eliminating the cumbersome, post-experimental manual spectra fitting process. We have just embarked on our year two research tasks, which will see an expansion of our mathematical tool box as well as increased user interaction capabilities. Furthermore, we will be moving on to higher data rate use cases to test the scalability of infrastructure and algorithms.
Summary
Reusing analytical components across multiple analytical pipelines for a wide range of experiments can be beneficial, as suggested by the initial tests with REXAN. Furthermore, the approach of using component libraries helps mathematical and computer scientists quickly develop basic analytical pieces for the instrument scientists, which can then be optimized for functionality, data volume, and speed.
Operational use of the tools highlighted the fact that the users required the capability to steer their analysis and data acquisition during the experiment to optimize their scientific results. New methods are under development to provide such capabilities in a high-velocity data environment, such as synchrotron-based experiments.
Funding
The research described in this paper is part of the Chemical Imaging Initiative, the Analysis in Motion Initiative and a DOE Early Career Award at PNNL. It was conducted under the Laboratory Directed Research and Development Program at PNNL, a multiprogram national laboratory operated by Battelle for the U.S. Department of Energy.
References
- M. Thomas, 3D imaging of microbial biofilms: Integration of synchrotron imaging and an interactive visualization interface, Engineering in Medicine and Biology Society (EMBC), 2014 36th Annual International Conference of the IEEE, Chicago, IL, August 28 (2014).
- K.K. van Dam, Velo and REXAN: Integrated data management and high speed analysis for experimental facilities, 2012 IEEE 8th International Conference on E-Science (E-Science), Chicago, IL, October 9 (2012).
- R.E. Jacob, PLoS One 8(6), e65874 (2013).
- H. Beyenal, J Microbiol Methods 59(3), 395–413 (2004).
- J. Ahrens, B. Geveci, and C. Law, ParaView: An end-user tool for large-data visualization. The Visualization Handbook, Elsevier, Burlington, MA, p. 717 (2002).
- H. Beyenal, Z. Lewandowski, and G. Harkin, Biofouling 20(1), 1–23 (2004).
- W. Lorensen and H. Kline, Comput Graph 21, 163–169 (1987).
- I. Lanekoff, Anal Chem 85(20), 9596–603 (2013).
- I. Lanekoff, Anal Bioanal Chem (in press).
- I. Lanekoff, Microscopy and Microanalysis 19(S2), 680–681 (2013).
- I. Lanekoff, Anal Chem 84(19), 8351–6 (2012).
- I. Lanekoff, Anal Chem 85(2), 882–9 (2013).
- I. Lanekoff, M. Thomas, and J. Laskin, Anal Chem 86(3), 1872–80 (2014).
- M. Thomas, Conf Proc IEEE Eng Med Biol Soc. 2012, 5545–8 (2012).
- I. Lanekoff, Analyst 139(14), 3528–32 (2014).