
Abstract
It is increasingly recognized that ecosystems provide varied services that should be considered in land management decisions. One of the challenges in the valuation of landscapes is that they often provide multiple services that combine into one social–ecological system. In this article we show how overlaps of those services can be measured, visualized, and explained. The results from a case study conducted in a rural community in northern Namibia show that in some landscapes, services are intertwined. We draw on a practice approach and ethnographic data to explain this finding and argue that services are related within places and fields of action. More specifically, we show that material services such as the provision of food and income form a unified whole with nonmaterial or “cultural” services such as beauty and social interaction and are often experienced simultaneously.
Research for this article is funded by the German Federal Ministry of Education and Research (BMBF) and is part of The Future Okavango (TFO) project on anthropogenic influences and cultural dimensions of environmental uses in the Okavango catchment (www.future-okavango.org).
This is an Open Access article. Non-commercial re-use, distribution, and reproduction in any medium, provided the original work is properly attributed, cited, and is not altered, transformed, or built upon in any way, is permitted. The moral rights of the named author(s) have been asserted.
The aim of the ecosystem service (ES) framework is to make the varied benefits ecosystems provide explicit and to include them in policymaking (de Groot, Wilson, and Boumans Citation2002; Boyd and Banzhaf Citation2007; Bateman et al. Citation2011; Chan, Satterfield, and Goldstein Citation2012). The Millennium Ecosystem Assessment (MA) classifies ecosystem services into four categories: provisioning, regulating, supporting, and cultural (MA Citation2005). Provisioning services contribute directly to human well-being and include food, fuel, fiber, and fresh water. Regulating services are the benefits people obtain from the regulation of ecosystem processes, including air quality maintenance, climate regulation, and water purification. Supporting services, such as soil formation and photosynthesis, are necessary for the production of all other ecosystem services (MA 2005; The Economics of Ecosystems and Biodiversity (TEEB) 2010; UK National Ecosystem Assessment (UK NEA) Citation2011; Daniel et al. Citation2012). In addition to these material benefits, the MA includes cultural ecosystem services, defined as “the nonmaterial benefits people obtain from ecosystems through spiritual enrichment, cognitive development, reflection, recreation, and aesthetic experiences” (MA 2005, 40).
There are two distinct ways to include the benefits ecosystems provide in land management (Shukdev Citation2009; TEEB 2010). One may be termed the scientific approach and the other the local perspective. In the scientific approach each service is first defined and measured (e.g., the amount of food provided or CO2 stored). A value is attached to these quantities by estimating their market prices or the prices people claim they are willing to pay for a service (Costanza et al. Citation1997, Citation2011). By summing these estimates, one arrives at an overall monetary value of a landscape at current market conditions, or for the individual(s) concerned. This approach is rooted in economic thinking and has been subject to criticism. While some have argued that the seemingly objective estimates of economic value are unrealistic and vary with the valuation methods applied (Spangenberg and Settele Citation2010), others criticize the lack of socioecological and political complexity they imply (Kumar and Kumar Citation2008; Norgaard Citation2010). To deal with these concerns, some authors have called for a stronger inclusion of local communities and stakeholders in the identification and valuation of ES, and for more attention to be paid to cultural ecosystem services (Chan et al. Citation2012; Chan, Satterfield, and Goldstein Citation2012; Daniel et al. Citation2012). To translate this concern into a research agenda, the second approach, which we call the local perspective, proposes asking people directly which services they perceive, value, and utilize.
This requires a terminological common ground between local communities and science. To that end, Termorshuizen and Opdam have introduced the term landscape services, which refers to material or nonmaterial conditions arising from ecosystems or human-built structures that have the potential to enrich human life (Termorshuizen and Opdam Citation2009; Opdam Citation2013). This conceptualization thus goes beyond the MA, to include the “built environment” (Raymond et al. Citation2009) such as schools, churches, and shops. Typologies of values landscapes provide have been developed and validated in different contexts (Brown and Reed Citation2000; Brown and Kyttä Citation2014). A key aim of recent approaches in landscape analysis is to overcome the nature–culture divide by acknowledging the active role humans play while interacting with landscapes, and the influence landscapes themselves have on the construction of identity and the self (Ingold Citation2000; Stephenson Citation2010). Landscapes, in this view, are arenas of human interaction that are constantly contested, reinterpreted, and reworked by people through time (Bender Citation1996; Dakin Citation2003; Stephenson Citation2008). Building on these ideas, we use the term landscape unit to refer to entities such as rivers, forests, or areas of settlement that people consider to be meaningful spatial units. The criteria of meaningfulness associated with these landscape units reflect local perspectives, and do not necessarily include ecological or functional homogeneity.
To identify which services a landscape unit provides to its users, participatory mapping is widely used (Brown, Montag, and Lyon Citation2012; Lowery and Morse Citation2013; Plieninger et al. Citation2013). Mapping allows researchers to identify which unit provides which services and how those services overlap in space. One of the interesting questions in this regard is whether and how material and nonmaterial services overlap in subsistence economies in the global south. So far, few studies have addressed this question empirically to show how they form a social–ecological system.
Ramirez-Gomez, Brown, and Fat (2013) mapped provisioning, cultural, and income generation services with indigenous communities in Suriname. The study indicates that members of the communities perceive these services as overlapping: The seed-finch birds of the savannah, for example, are assigned a cultural significance for their complex songs, while at the same time representing opportunities to generate income through tourism and wildlife trade (Ramirez-Gomez, Brown, and Fat Citation2013, 16). Fagerholm et al. (Citation2012, 428) quantify the co-occurrence of pairs of services in rural Tanzania using correlation measures. They find that “the material and nonmaterial landscape service indicators show a rather low spatial relationship. A strong correlation is found only between livestock keeping and beautiful places and free time (r = 0.68/0.64), co-existing mainly in the settlement areas.”
While those and other studies (Nielsen-Pincus Citation2011; Plieninger et al. Citation2013) provide evidence for the relationships between certain services, they often fall short in explaining those overlaps. This is partly due to their focus on perceptions of landscapes rather than on the practices underlying processes of valuation. Human values can be defined as a person's or group's moral conceptions of what is desirable in life (Eiss and Pedersen Citation2002). Graeber (Citation2001) approaches values by asking how people make use of their creative energy. In doing so, he shifts away from meanings and contemplations and puts practices at center stage. Graeber's approach shows interesting parallels with attempts to conceptualize human–landscape relationships as transactional. The transactional concepts emphasize the roles humans play as active participants in their environment who engage in reciprocal human–landscape transactions that shape both humans and landscapes. From this perspective, landscape perceptions are not simply a product of a unilateral flow of information, but rather are created by human thinking, feeling, and acting within ever-changing landscapes (Ittelson Citation1973; Zube Citation1987; Brown and Kyttä Citation2014). To include this understanding in our case study from rural Namibia, we combine a participatory mapping of landscape services with an ethnographic analysis of daily routines to show (1) which material and nonmaterial services local actors assign to the landscapes that surround them; (2) to what degree those services overlap in space; and (3) how spatial overlaps can be explained.
Methods
Study Area
The first author conducted ethnographic fieldwork in the northern Namibian village of Mahahe during four months of 2011. Mahahe is a rural community of about 50 households, situated 50 km east of the town of Rundu. As in most other rural communities of the Namibian Kavango region, the majority of the inhabitants of Mahahe depend on the use of natural resources such as fish, wild fruits, timber, and grasses and on their agricultural activities to sustain their daily livelihoods (Eirola, Bradley, and Laitinen Citation1990; Pröpper Citation2009). Transect walks, participant observation, and semistructured interviews allowed us to classify this environment into 10 landscape units according to different uses people associate with them (Figure ). The landscape units cover an area of approximately 35 km2 with the village of Mahahe at the center. This represents the area most informants predominately use in their everyday activities, as many distances are covered by foot. The suggested units were approved by informants in member checks.
Figure 1 Landscape units of Mahahe (scale 1:60,000).
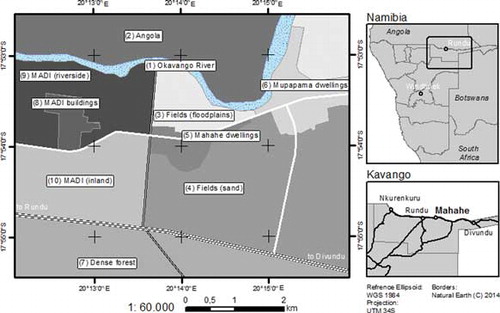
In the north, the village of Mahahe is adjacent to the Okavango River (1), which marks the political administrative border with Angola (2). Many villagers depend on subsistence farming and cultivate nonirrigated fields situated in the floodplains (3), as well as inland on sandy soils (4). Between the floodplains and the sandy and sparsely wooded area inland lie the dwellings of Mahahe (5). The local school and a small clinic are located 2 km east of Mahahe in the neighboring village of Mupapama (6), accessible by a gravel road. A few kilometers south of the villages, a tarred road, the Trans-Caprivi Highway, divides the areas used for agriculture from dense forest areas (7). The Mashare Agricultural Development Institute (MADI) is adjacent to Mahahe in the west. MADI is a governmental organization that aims to provide agricultural training and information to farmers (buildings categorized as (8)). The fenced premises of the institute, used for grazing of the institute's livestock, are divided by the gravel road into one area at the riverside (9) and another inland (10), both covered by forest and bushy vegetation.
Approaching Landscape Services through Ethnography
During fieldwork the first author lived in Mahahe, where everyday activities such as fetching water, shopping, and walks through the village brought him into contact with many inhabitants and offered the possibility of informal conversations and observations. During the first weeks of his research, a local research assistant introduced him to about 30 households in Mahahe and helped to explain the aim of the research. To prepare and contextualize the participatory mapping, 29 informants (14 women and 15 men) were interviewed regarding their interaction with landscapes and species in everyday life. The nonprobability sampling procedure was opportunistic, and the sample consisted of people from the households visited who had shown an interest in participating. All interviews were conducted with a research assistant in the local languages RuKwangali and RuSambyu. The researcher established close social relationships with 10 informants and was invited to accompany them during work routines such as plowing, fishing, and fetching grass, as well as in social activities including family dinners and visits of relatives. Those data were analyzed on the spot, with the question in mind, “In what ways can landscapes contribute to what is locally perceived as a good life?” Based on the analysis, a preliminary categorization of landscape services was drawn up that takes into account categories that were raised by locals, such as “physical training,” and is informed by insights from current literature (e.g., Brown and Reed Citation2000; MA 2005; Costanza et al. Citation2007). The preliminary list was discussed and validated with informants, finally arriving at 13 categories (see Table ). To analyze the relationships between categories that are typically classified as provisioning services in literature and those labeled as “cultural” we classified the categories as material and nonmaterial services.
Table 1. Services probed in the participatory mapping
Participatory Mapping of Landscape Services
For the landscape mapping, we selected 16 informants from the core sample of 29, striving for an “ethnographic sample,” heterogeneous in social categories including gender, age, and ethnicity (Werner and Bernard Citation1994). Approximately 30% of the 50 households of Mahahe are represented in this sample. The sample consists of eight female and eight male permanent inhabitants, with the youngest being 18 years of age and the oldest 92 years (mean age 44.3 years, standard deviation 22.4), and includes representatives of all major ethnic groups (Nyemba, Kwangali, Sambyu, Gciriku, and Mbukushu). With the exception of two elderly persons, all informants are involved in multiple economic activities including agriculture, fishing, and gathering of fruits, firewood, and plants.
The mapping exercise was conducted individually in personal interviews using the following procedure: First, the researcher presented a satellite image (size: A0; 841 × 1189 mm) to the informant showing a map extract with Mahahe at the center (the section is the same as the extract in Figure ). To ensure the respondent understood the map, the researcher and the assistant helped to orient the interviewee by cooperatively identifying the informant's house and other landmarks.
Second, rolls of round stickers (diameter: 10 mm) in different colors were given to the informant to mark landscape services. The first author explained that each of the 13 colors represented one service. We then asked the informant, category by category, where each service could be found (see Table ). The number of stickers per category was not limited. Once a category was mapped, we asked the informant in which way she or he perceived the specific locations as beneficial and whether a specific ecological or human-made structure was marked. The interviews lasted between 30 and 90 minutes, and without exception the respondents navigated confidently on the map.
Data Analysis
After each mapping session, we digitized the spatial positions of the informant's stickers, as well as the respective attribute data. In a first step of the data analysis the 10 landscape units were compared using a number of well-established social landscape metrics (Brown and Reed Citation2012). They include intensity, richness, diversity, and the value dominance of services for each landscape unit. Here, intensity refers to the total number of points set by respondents within a given unit. Richness shows the proportion of the 13 services represented in a landscape unit. Diversity refers to the distribution of services within the respective landscape unit, calculated using the Shannon diversity index (SDI) (Brown and Reed Citation2012; Plieninger et al. Citation2013). The index equals zero if only one category of services is mapped in a given landscape unit and reaches its maximum if all categories are represented in a unit with the same number of points (Fagerholm et al. Citation2012). Here, the highest possible value for the SDI is 2.565. Finally, the value dominance index quantifies the difference between the landscape service with the highest number of points and that with the second highest point count within a landscape, expressed as a fraction of the highest point count. The index equals zero if there is no difference between the first and second count, and 1 where there is only one service in the respective landscape unit (Brown and Reed Citation2012).
In a second step of the analysis, the Kernel Density tool implemented in ArcGIS 10.1 allows the visualization of the spatial concentration of landscape services (Nielsen-Pincus Citation2011; Sherrouse, Clement, and Semmens Citation2011; Fagerholm et al. Citation2012). It calculates the density of services in raster cells within a definable search radius (Silverman Citation1986). The surface value is the highest at the location of a given point and diminishes with increasing distance from that point, reaching zero at the distance from the center point that equals the search radius. Representing the local scale of the assessment, a cell size of 50 m and a search radius of 300 m were selected. The output value is provided for each cell in points per square kilometer.
To measure the relationships between all services, in a third step we calculated a Jaccard similarity coefficient. The coefficient is defined on the basis of the 16 individual mappings and measures the proportion of times two services co-occur out of the times that any of the two occurs in a landscape unit. Consider the following two services A and B that have been mapped for the five landscapes units a–e as either occurring (1) or not occurring (0): A(a1,b0,c1,d1,e0); B(a1,b0,c0,d1,e0). In this example the coefficient would be PM = 2/3, since two services occur in two (a, d) of the three landscape units in which any of the services occurs.
Results
Defining Local Landscape Services
Altogether, the 16 respondents mapped 667 points representing landscape services. Thus, each informant marked on average 41.7 places (standard deviation 9.3 points; minimum 30; maximum 64). The highest number of points was set by the respondents for the category food (116), followed by income generation (103) and building material (95). The most frequently marked nonmaterial service was social interaction (51). Table provides an overview of the most frequently mapped structures for each category. While we find that for most services the patterns of points were not particularly distinctive between women and men, there are a few exceptions, of which we discuss one in the following. It is important to note that the analysis does not measure degree of importance. When a category received a high number of points, this did not necessarily mean that it was perceived as more valuable than another, but rather that the sum of respondents identified more places providing that particular service.
Table 2. Summary of the intensity and the most frequently mapped structures for each service (n = 16)
Spatial Overlaps of Landscape Services
Landscape services were associated with all landscape units covered by the mapping, but to different extents (Table ). The highest intensity of marked services was found in the Mahahe dwellings (183 points in total/58 for material services/125 for nonmaterial services) and in the Okavango River (125/100/25), followed by the fields in the floodplains (69/44/25) and the dwellings in the village of Mupapama (68/13/55). By far the lowest intensity was measured at the fenced MADI premises (riverside) and in Angola (16 and 3 points, respectively).
Table 3. Distribution of points within the 10 landscape units
For the landscape unit Mahahe dwellings the highest richness of services (all 13 categories represented) and Shannon diversity index (2.43) was calculated. The second highest diversity score is measured for fields (floodplains) (SDI = 2.16; Richness = 11), followed by the Mupapama dwellings (SDI = 1.94, Richness = 9) and the Okavango River (SDI = 1.85, Richness = 9).
Figure shows the Kernel Density clusters of the points set within the categories of beauty, learning, and income generation. While points for learning were set at central localities within the villages (school, churches, headman's tree, MADI) and the Okavango River, the clusters for the category income generation are more extensive and cover large parts of the forest areas, the fields, the river, and MADI. All clusters of points in the category beauty overlap with at least one other cluster.
Figure 2 Kernel Density clusters for the services beauty, learning, and income generation (scale 1: 46,000; cell size 50 m, search radius 300 m).
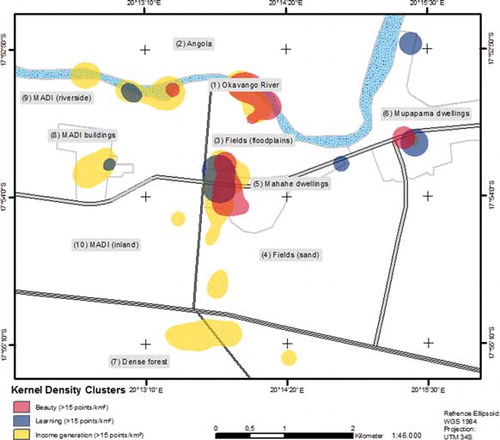
Table shows the Jaccard similarity coefficients between the 13 landscape services. It indicates that informants tended to locate a number of pairs of services in the same landscape units. The highest similarity coefficients are computed for the pairs spirituality and religion/political participation (0.70) and food/income generation (0.51). On the other hand, pairs such as political participation/building material and political participation/energy (both 0.05) were rarely mapped in the same landscape unit. The similarity coefficient already indicates that some material and nonmaterial services are interrelated: beauty/building material, political participation/fresh water, spirituality and religion/fresh water, and social interaction/fresh water.
Table 4. Jaccard similarity coefficients between the 13 landscape services
Table aggregates the relationships between material and nonmaterial services across all units. It shows how many times two services were placed in the same landscape unit. Table shows that in 481 cases material and nonmaterial services have been placed in the same landscape unit, indicating that they are intertwined. At the same time, in 712 cases material services have been placed alongside material services and 394 times nonmaterial services with services that are equally perceived to be nonmaterial. The association between the two variables is low and weakly significant (phi = 0.047, χ2 = 0.032). This rejects the hypotheses that material and nonmaterial services occupy entirely different landscape units.
Table 5. Overlap between material and nonmaterial services as classified in Table 2 (phi = 0.047, χ2 = 0.032)
Discussion
The quantitative data just presented show that the respondents perceive the landscape units in their immediate environment as beneficial in multiple ways. This matches with our qualitative data indicating that in the local view nature can facilitate social activities, aesthetic stimulation, a sense of belonging, and the expression of spirituality, as well as providing material means of securing one's livelihood. The landscape metrics calculated—intensity, richness, and diversity—allow us to identify “hotspots” with particularly high occurrence and variety of perceived services (Bryan et al. Citation2010; Plieninger et al. Citation2013). The settlement areas of Mahahe and Mupapama, the Okavango River, and the floodplains are such “hotspots.” The diversity of services in these areas has different meanings in the social–ecological systems discussed. While the two dwelling areas are the only landscape units that are predominantly valued for nonmaterial services, the river and the floodplains are to a greater extent appreciated for their material support. However, the value dominance index indicates that the four areas are not dominated by any single service that significantly outweighs the others, and both material and nonmaterial services appear in significant number.
In contrast to the already-described landscape units, in the other six units the diversity scores are lower, and predominately material services were mapped. Especially the MADI areas and the fields on sandy ground are much more dominated by a single service, and thus in the view of the local population constitute rather specialized environments. Again, the meaning differs. While, for example, the sandy fields are valued for providing food, the MADI premises inland and on the riverside mainly provide building material and energy. While these landscapes are only visited occasionally by most people—in the planting season, or when specific goods such as building material and firewood are required—we show in the following that places such as the Okavango River, the waterpoint, and fruit trees in Mahahe play a much bigger role in everyday practice, and thereby become social, beautiful, and provisioning places.
Fagerholm et al. (2012) have reported a relatively low overlap between material and nonmaterial services. The hypothesis that there is no or little overlap would be confirmed in our data if we found a (strong) positive association in Table , aggregating the relationship between material and nonmaterial services, and if the off-diagonal values were close to zero. Table rejects the hypothesis that there is no/low spatial overlap since the association is close to zero and weakly significant. However, it is difficult to conclude whether the overlap between material and nonmaterial services is stronger or weaker than in other related studies such as Fagerholm et al. (Citation2012). This is due to different methodologies used, both for collecting data and for measuring association. However, as Table reveals, the relationship is caused by the co-occurrences in specific landscape units. While some landscape units are dominated by material or nonmaterial services, the association between the two categories is highest in the Mahahe and Mupapama dwelling areas, the river, and the floodplains. This finding parallels the Fagerholm et al. (Citation2012) study and is confirmed by all measures. These results can be contextualized and explained by examining three fields of action ethnographically.
Fishing as an Educational, Aesthetic, and Social Activity
Figure shows considerable overlap among Kernel Density clusters for the services beauty, learning, and income generation at the Okavango River. While the Jaccard similarity coefficients between these three services are not among the highest when considering the entire range of landscape units, they do indicate strong co-occurrence along the river, as seen in Figure .
An ethnographic example helps to illustrate the relationship between these spheres of life: Jeff, a tall young man of 18 years, dropped out of school during seventh grade, when he decided that the Okavango River was a more suitable environment for him than the classroom. Even though he was not successful at school and is not one of the top players in the village's prestigious football team, he is nowadays respected among his peers for being one of the best fishermen in the village. Unless his family needs his support in cultivating their field or cutting thatch grass, he walks down to the river every day. Usually he takes his family's wato, a traditional canoe made from the trunk of a single tree, to head for a promising spot. He knows the best places to fish according to season, time of day, and water level. Jeff's older brother taught him how to use hook, line, bait, and net properly; now sometimes Jeff takes his younger brother to pass on that knowledge.
Every now and then some of Jeff's friends come along. In their canoes the young men joke, test their courage, or cool their bodies in the water from the rising heat. When the midday heat becomes too intense, the group looks for a place in the shade to light a fire and roast and eat some of the smaller fish they have caught. After the meal they relax in the shade checking and repairing their fishing equipment until, as the temperature falls in the afternoon, they can continue their work.
Jeff says that he likes the freshness of the water, the cool breeze, and the sound of the water as he listens while waiting quietly for the fish to bite. But when asked what he enjoys most he answered: “I enjoy the moment when the fish bites the hook. It feels so thrilling when I am pulling out a big fish from the river” (October 27, 2011).
When Jeff comes back to the village he decides which fish to give to his aunt to roast for dinner and which he wants to sell. The money from the sales he uses to support his family and to satisfy his own consumption needs. Just recently he was able to buy a cell phone and some name-brand clothes, much sought after among the youths of Mahahe.
Jeff's example shows that within fishing as a field of action several of his needs and desires are satisfied and that the river as a landscape unit is experienced synchronically as beneficial in several ways. Acquiring ecological goods can be a fulfilling and satisfying task, a worthy purpose for life. His abilities in obtaining the resources earn him respect among his peers. Jeff can combine fishing and having a good time with his friends; he can enjoy the beauty of the river while he is working, instead of in contrast to work. Furthermore, his example shows that learning, a nonmaterial dimension of landscapes, cannot be separated from material services. In Mahahe, education is to a great extent about learning how to obtain provisioning ES. What Jeff needs to know to contribute to securing his family's livelihood he learned while fishing with his brother. Finally, the act of fishing can generate income and thereby be instrumental in the pursuit of consumer incentives.
The Sociality of Fetching Water
Approaching the multiple services nature provides as a function of actions, we find that women, who are commonly responsible for supplying their households with fresh water, perceive the waterpoints in the village and at the river, where they go to wash clothes, explicitly as social places. The Jaccard similarity coefficient for the pair fresh water/social interaction is 0.31. Notably, it is exclusively women who are actually frequenting the place on a daily basis who mapped the waterpoint as a place for social interaction, while men only mapped it for the provision of water. For women the pump, located at a central point in the village, is a place to meet each other, to exchange the news of the day, and to discuss economic transactions. It is situated a few meters from the headman's tree, a place that is loaded with symbolic meaning, as it represents the political authority of the headman and is used for trials and for community meetings. Female informants reported that they can learn about the political issues in the village while they are in the process of fetching water (similarity coefficient for the pair fresh water/political participation: 0.38).
Women in charge of domestic tasks do not visit their waterpoints exclusively to appreciate the surroundings. However, aesthetic and social stimulation can be conveniently experienced as side effects of their work. This is represented by the high similarity coefficient between fresh water and beauty (0.40) as stated by Mary, a woman of 47 years: “I enjoy the flow of the water and the cool breeze when I am washing my clothes at the river. Afterwards I go for a swim and sometimes stay there and watch the current and the fish” (December 13, 2011).
Beautiful Pastures
During the fieldwork, informants frequently discussed with the researcher what they perceived as aesthetically pleasing in nature. Asked which tree species she found most beautiful, Madeline, a 40-year-old woman, answered:
Ugongo [ricinodendron rautanenii] blossom nicely at this time of the year, and some are already bearing fruits. Usivi [guibourtia coleosperma] trees as well have started bearing fruit, and we know already that next year we will get fruits from them. (November 21, 2011)
Along with flowers, the green, strong grass that starts to grow in the rainy season is widely perceived as beautiful among informants. A cattle owner stated that he would enjoy the beauty of the grass for its own sake, but does so even more with regard to his animals for he knows that eating the grass will make them healthy and strong. These examples show that a healthy, prosperous environment is perceived as desirable, not only for its intrinsic beauty, but also for promising future usability. In the Kavango—especially among women—selling wild fruits is a major source of income, while livestock constitute prestigious capital that can reduce vulnerability as the animals can be sold in times of scarcity (Eirola, Bradley, and Laitinen Citation1990). This shows that ecological processes (e.g., the blossoming of a tree) that are instrumental in creating usable objects of value (fruits) can be valued for their beauty (Chan et al. Citation2012). Many respondents showed a broad understanding of beauty, locally uwa, not only as outward qualities of objects but also as general appreciation for places that make them feel good. Therefore, beauty does not exist per se, but can only be experienced through interacting with nature. In subsistence-oriented economies, such as in Mahahe, this includes obtaining material ecosystem services. Beauty cannot be understood as detached from those activities but exists through them. This is indicated by the high similarity coefficient between beauty and material services (similarity coefficient with fresh water 0.40; with building material 0.32, with food 0.25, with income generation 0.24).
Conclusion
The data presented here show clearly that the people of Mahahe value their landscape units in multiple ways. At the Okavango River, the dwelling areas, and the floodplains, material and nonmaterial services are not isolated but intertwined to form a complex social–ecological system. These links are established through activities within the environment. At one place, such as the Okavango River, and within one field of action, such as fishing, the environment is beneficial in various ways. As Graeber (Citation2001) has argued, values arise where energy is invested. Work and time spent while fishing may produce food, but equally offer fulfillment, aesthetic stimulation, or education. Hence, separating categories along the lines of ecology versus culture, material versus nonmaterial, or work versus leisure can fall short of capturing the complexity of intertwined practices people perform in some landscapes (Zube Citation1987; Kumar and Kumar Citation2008).
Most methodological approaches to environmental values capture what people say without considering what they actually do. We have tried to bridge this gap by combining ethnography with participatory mapping. While mapping aims at perceptions, ethnography adds an in-depth understanding of the activities that link services and places. Accessing daily practices in which values are produced and experienced suggests explanations for interrelations between certain services at some landscape units (Graeber Citation2001; Eiss and Pedersen Citation2002).
The results presented here are largely descriptive and show the worth of landscapes for the people utilizing them. However, taking a second step, we can estimate from the data how the values of landscape would change if land management strategies were altered. Scenarios can reveal how the overall value of a landscape might change under different conditions, and offer support for policymakers. In the hypothetical case that access to the Okavango River was refused to the people of Mahahe, this would result in a decline in services such as food, building material, income generation, and water, which might be substitutable through access to more effective agricultural devices, corrugated sheet roofs, possibilities for casual work, and boreholes. However, looking at the nonmaterial services that are intertwined with the material services provided by the river through activities such as fetching water or fishing, these would be more difficult to substitute from the perspective of the actors involved. Therefore, the multidimensional meanings of nature for local communities should be integrated in conservation efforts and in environmental impact assessments.
Our data would allow the recognition of landscape services, and valuation according to different social groups, such as men and women, to show for whom value would be added or lost if alternative land management strategies were implemented. However, a larger sample would facilitate such elaborations for future studies. Moreover, it would be stimulating to carry out similar research with more heterogeneous groups on a larger scale: for example, comparing perceptions of subsistence farmers, workers, and political authorities. Mappings specifically capturing different seasons (e.g., planting season, harvesting, and the dry season when hardly any agricultural activities can be carried out) in combination with long-term ethnographic fieldwork may help to address a shortcoming of most current participatory mapping studies by capturing not only the spatial but also the temporal dimension of human–landscape interactions.
In this article we have exclusively focused on the ways people perceive and map services in the landscapes they interact with. In introducing the work we indicated that this is only one way of assessing ecosystem services and that the MA and other assessments have taken a different approach. It remains an open and ambitious challenge to combine these perspectives and to negotiate possible discrepancies between local communities, scientists, and policymakers.
Acknowledgments
We are greatly indebted to the people of Mahahe and several other communities along the Okavango catchment of Namibia, Angola, and Botswana. As members of the research team, Michael Pröpper, Felix Haupts, Björn Herold, João Baptista, Samwel T. Kwandu, and Lucas Kanumbo Mandjoro have shaped our understanding of the themes discussed. Moreover, we are obliged to Wolfgang Teichert for his assistance in creating the maps. Michael Pröpper and three anonymous reviewers provided valuable comments on an earlier draft of this article.
References
- Bateman, I. J., G. M. Mace, C. Fezzi, G. Atkinson, and K. Turner. 2011. Economic analysis for ecosystem service assessments. Environmental and Resource Economics 48(2):177–218. doi:10.1007/s10640-010-9418-x
- Bender, B. 1996. Landscape. In Encyclopedic dictionary of social and cultural anthropology, ed. A. Barnard and J. Spencer 323–24. London: Routledge.
- Boyd, J., and S. Banzhaf. 2007. What are ecosystem services? The need for standardized environmental accounting units. Ecological Economics 63(2–3):616–26. doi:10.1016/j.ecolecon.2007.01.002
- Brown, G., and M. Kyttä. 2014. Key issues and research priorities for public participation GIS (PPGIS): A synthesis based on empirical research. Applied Geography 46:122–36. doi:10.1016/j.apgeog.2013.11.004
- Brown, G., J. M. Montag, and K. Lyon. 2012. Public participation GIS: A method for identifying ecosystem services. Society & Natural Resources 25:633–51. doi:10.1080/08941920.2011.621511
- Brown, G., and P. Reed. 2000. Validation of a forest values typology for use in national forest planning. Forest Science 46(2):240–47.
- Brown, G. G., and P. Reed. 2012. Social landscape metrics: Measures for understanding place values from public participation geographic information systems (PPGIS). Landscape Research 37(1):73–90. doi:10.1080/01426397.2011.591487
- Bryan, B. A., C. M. Raymond, N. D. Crossman, and D. H. MacDonald. 2010. Targeting the management of ecosystem services based on social values: Where, what, and how? Landscape and Urban Planning 97(2):111–22. doi:10.1016/j.landurbplan.2010.05.002
- Chan, K. M. A., A. D. Guerry, P. Balvanera, S. Klain, T. Satterfield, X. Basurto, A. Bostrom, R. Chuenpagdee, R. Gould, B. S. Halpern, N. Hannahs, J. Levine, B. Norton, M. Ruckelshaus, R. Russell, J. Tam, and U. Woodside. 2012. Where are cultural and social in ecosystem services? A framework for constructive engagement. BioScience 62(8):744–56. doi:10.1525/bio.2012.62.8.7
- Chan, K. M. A., T. Satterfield, and J. Goldstein. 2012. Rethinking ecosystem services to better address and navigate cultural values. Ecological Economics 74:8–18. doi:10.1016/j.ecolecon.2011.11.011
- Costanza, R., R. d'Arge, R. de Groot, S. Farber, M. Grasso, B. Hannon, K. Limburg, S. Naeem, R. V. O'Neill, J. Paruelo, R. G. Raskin, P. Sutton, and M. van den Belt. 1997. The value of the world's ecosystem services and natural capital. Nature 387:253–60. doi:10.1038/387253a0
- Costanza, R., B. Fisher, S. Ali, C. Beer, L. Bond, R. Boumans, N. L. Danigelis, J. Dickinson, C. Elliott, J. Farley, D. E. Gayer, L. M. Glenn, T. Hudspeth, D. Mahoney, L. McCahill, B. McIntosh, B. Reed, S. A. T. Rizvi, D. M. Rizzo, T. Simpatico, and R. Snapp. 2007. Quality of life: An approach integrating opportunities, human needs, and subjective well-being. Ecological Economics 61(2–3):267–76. doi:10.1016/j.ecolecon.2006.02.023
- Costanza, R., I. Kubiszewski, D. Ervin, R. Bluffstone, J. Boyd, D. Brown, H. Chang, V. Dujon, E. Granek, S. Polasky, V. Shandas, and A. Yeakley. 2011. Valuing ecological systems and services. F1000 Biology Reports 3:14. doi:10.3410/b3-14
- Dakin, S. 2003. There's more to landscape than meets the eye: Towards inclusive landscape assessment in resource and environmental management. Canadian Geographer/Le Géographe Canadien 47(2):185–200. doi:10.1111/1541-0064.t01-1-00003
- Daniel, T. C., A. Muhar, A. Arnberger, O. Aznar, O. Aznar, J. W. Boyd, K. M. A. Chan, R. Costanza, T. Elmqvist, C. G. Flint, P. H. Gobster, A. Grêt-Regamey, R. Lave, S. Muhar, M. Penker, R. G. Ribe, T. Schauppenlehner, T. Sikor, I. Soloviy, M. Spierenburg, K. Taczanowska, J. Tame, and A. von der Dunk. 2012. Contributions of cultural services to the ecosystem services agenda. Proceedings of the National Academy of Sciences USA 109(23):8812–19. doi:10.1073/pnas.1114773109
- de Groot, R., M. A. Wilson, and R. M. J. Boumans. 2002. A typology for the classification, description and valuation of ecosystem functions, goods and services. Ecological Economics 41:393–408. doi:10.1016/s0921-8009(02)00089-7
- Eirola, M., J. Bradley, and A. Laitinen. 1990. Kavango—The Sambiyu tribe. The way of life of the Mupapama river terrace community. Rundu, Namibia: Finnbatt Untag.
- Eiss, P. K., and D. Pedersen. 2002. Introduction: values of value. Cultural Anthropology 17(3):283–90. doi:10.1525/can.2002.17.3.283
- Fagerholm, N., N. Käyhkö, F. Ndumbaro, and M. Khamis. 2012. Community stakeholders’ knowledge in landscape assessments—Mapping indicators for landscape services. Ecological Indicators 18:421–33. doi:10.1016/j.ecolind.2011.12.004
- Graeber, D. 2001. Toward an anthropological theory of value: The false coin of our own dreams. New York: Palgrave.
- Ingold, T. 2000. The perception of the environment. Essays on livelihood, dwelling & skill. New York: Routledge.
- Ittelson, W. 1973. Environmental perception and contemporary perceptual theory. In Environment and cognition, ed. W. Ittelson 1–19. New York: Seminar Press.
- Kumar, M., and P. Kumar. 2008. Valuation of the ecosystem services: A psycho-cultural perspective. Ecological Economics 64:808–19. doi:10.1016/j.ecolecon.2007.05.008
- Lowery, D. R., and W. C. Morse. 2013. A qualitative method for collecting spatial data on important places for recreation, livelihoods, and ecological meanings: Integrating focus groups with public participation geographic information systems. Society & Natural Resources 26:1422–37. doi:10.1080/08941920.2013.819954
- Millennium Ecosystem Assessment. 2005. Ecosystems and human well-being: Synthesis. Washington, DC: Island Press.
- Nielsen-Pincus, M. 2011. Mapping a values typology in three counties of the interior Northwest, USA: Scale, geographic associations among values, and the use of intensity weights. Society & Natural Resources 24:535–52. doi:10.1080/08941920903140972
- Norgaard, R. B. 2010. Ecosystem services: From eye-opening metaphor to complexity blinder. Ecological Economics 69:1219–27. doi:10.1016/j.ecolecon.2009.11.009
- Opdam, P. 2013. Using ecosystem services in community-based landscape planning: Science is not ready to deliver. In Landscape ecology for sustainable environment and culture, ed. B. Fu and K. B. Jones 77–101. New York: Springer.
- Plieninger, T., S. Dijks, E. Oteros-Rozas, and C. Bieling. 2013. Assessing, mapping, and quantifying cultural ecosystem services at community level. Land Use Policy 33:118–29. doi:10.1016/j.landusepol.2012.12.013
- Pröpper, M. 2009. Culture and biodiversity in central Kavango, Namibia. Berlin: D. Reimer.
- Ramirez-Gomez, S. O. I., G. G. Brown, and A. T. S. Fat. 2013. Participatory mapping with indigenous communities for conservation: challenges and lessons from Suriname. Electronic Journal on Information Systems in Developing Countries 58(2): 1–22.
- Raymond, C. M., B. A. Bryan, D. H. MacDonald, A. Cast, S. Strathearn, A. Grandgirard, and T. Kalivas. 2009. Mapping community values for natural capital and ecosystem services. Ecological Economics 68(5):1301–15. doi:10.1016/j.ecolecon.2008.12.006
- Sherrouse, B. C., J. M. Clement, and D. J. Semmens. 2011. A GIS application for assessing, mapping, and quantifying the social values of ecosystem services. Applied Geography 31(2):748–60. doi:10.1016/j.apgeog.2010.08.002
- Shukdev, P. 2009. Costing the earth. Nature 462:277. doi:10.1038/462277a
- Silverman, B. W. 1986. Density estimation for statistics and data analysis. London: Chapman and Hall.
- Spangenberg, J. H., and J. Settele. 2010. Precisely incorrect? Monetising the value of ecosystem services. Ecological Complexity 7:327–37. doi:10.1016/j.ecocom.2010.04.007
- Stephenson, J. 2008. The cultural values model: An integrated approach to values in landscapes. Landscape and Urban Planning 84(2):127–39. doi:10.1016/j.landurbplan.2007.07.003
- Stephenson, J. 2010. People and place. Planning Theory and Practice 11(1):9–21.
- The Economics of Ecosystems and Biodiversity (TEEB). 2010. The economics of ecosystems and biodiversity: Mainstreaming the economics of nature. http://www.teebweb.org/wp-content/uploads/Study%20and%20Reports/Reports/Synthesis%20report/TEEB%20Synthesis%20Report%202010.pdf (accessed September 23, 2013).
- Termorshuizen, J. W., and P. Opdam. 2009. Landscape services as a bridge between landscape ecology and sustainable development. Landscape Ecology 24(8):1037–52. doi:10.1007/s10980-008-9314-8
- UK National Ecosystem Assessment. 2011. The UK national ecosystem assessment: synthesis of the key findings. Cambridge, UK: UK NEA.
- Werner, O., and H. R. Bernard. 1994. Ethnographic sampling. Cultural Anthropology Methods Newsletter 1:7–9.
- Zube, E. H. 1987. Perceived land use patterns and landscape values. Landscape Ecology 1(1):37–45. doi:10.1007/bf02275264