
ABSTRACT
Building on the extant literature on recruitment and retention within the field of STEM and undergraduate education, we sought to explore the recruitment and retention experiences of racially and ethnically minoritized students enrolled in graduate level assessment, measurement, and/or evaluation programs in the United States. Using a mixed methods approach, surveys were completed by 98 students and eleven participated in follow up semi-structured interviews. Doctoral students reported that (1) recruitment practices of educational measurement programs tend to be minimal or nonexistent; (2) having strong and consistent mentorship from faculty within and (often) external to their academic programs is critical; (3) struggles with lack of funding (both the fear of prior to enrollment and reality of post enrollment) was a significant source of stress; and (4) many doctoral programs fail to offer the comprehensive curriculum students feel they need to be prepared for the job market. Recommendations for future practice are discussed.
1. Introduction
The educational and psychological measurement community has long been aware of an insufficient pipeline of well-trained doctoral students to fill the growing measurement positions created by the increased demand for educational testing (Brennan, Citation2004; Finney & Pastor, Citation2012; Patelis, Kolen, & Parshall, Citation1997; Sireci, Citation2000). Measurement scholars have suggested that this shortage can be explained, in part, to the lack of racially and ethnically minoritized professionals entering the field (Brennan & Plake, Citation1990; Sireci, Citation2000). To be sure, in recent years the measurement field has consistently maintained the need to recruit (and presumably retain) racially and ethnically minoritized persons to mitigate potential labor shortages, and more importantly, to address the shift in cultural and social norms in the U.S. created by an increasingly diverse student population (e.g., Kena et al., Citation2016; Randall, Rios, & Jung, Citation2021; Rios, Randall, & Donnelly, Citation2019; Sireci, Citation2000). Failing to consider the sociocultural identities of all students during the assessment development process will inevitably (and has historically) lead to deficit-framed, inaccurate explanations and understandings of what minoritized students know and are able to do (Ercikan & Solano-Flores, Citation2016; Randall, Citation2021).
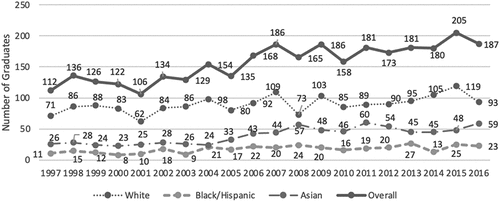
Despite the inherent benefits and increasing calls for a more diverse assessment community (Sireci, Citation2000), the field has historically been unsuccessful in recruiting domestic born Black, Brown, and Indigenous persons (e.g., Packman, Camara, & Huff, Citation2010; Patelis, Kolen, & Parshall, Citation1997). In the most comprehensive study to date, Randall, Rios, and Jung (Citation2021) examined data from the National Science Foundation’s Survey of Earned Doctorates collected between 1997 and 2016. They found that compared to other race/ethnic groups, White and Asian (international & domestic) students annually earned more degrees, comprising, on average, 85% of total graduates each year (see ). Specifically, within these subgroups, most graduates identified as White (57.3%) or Asian (25.1%). Of the other race/ethnic groups in the field, Black (6.8%) and Hispanic (4.4%) graduates were the largest. An examination of these groups’ graduation rates showed that although the compound average growth rate (CAGR) for Black (4.15%) and Hispanic (3.72%) doctorate earners was greater than that of their White counterparts (1.43%), the gap between these racial/ethnic groups remained large. In fact, the field failed to graduate more than 10 Hispanic and 20 Black students in a single year from 1997 to 2016. In contrast, since 2007, the minimum annual number of Asian and White graduates was 44 (CAGR = 4.41%) and 73 (CAGR = 1.43%), respectively (see ). It is also worth noting that so few doctorate degree earners identified as Native American/Indigenous that the authors could not disaggregate and report data for that subgroup.
Figure 1. Doctoral degrees earned by Race/Ethnicity.
1.1 Barriers
The scarcity of doctoral graduates from racially and ethnically minoritized populations is particularly troubling given that nearly a third of the U.S. population identifies as Black (14.2%) or Hispanic (18.7%) according to the 2020 U.S. census (census.gov). Still, Randall, Rios, and Jung (Citation2021) findings mirror the landscape of the STEM profession more broadly. Indeed, Black (8.1%), Hispanic (8.4%), and American Indian (0.4%) STEM doctoral degree holders continue to be underrepresented compared to their Asian (10.5%) and White (69.1%) counterparts, and they represent only 23% of the STEM workforce (Burke, Okrent, & Hale, Citation2022). These numbers are not surprising given that fewer than 40% of all students who begin their university training as STEM majors actually earn their degrees in a STEM field, with particularly elevated exit rates observed for women, minoritized, first-generation and low-income students (Sweeder, Kursav, & Valles, Citation2021).
Although there is little research investigating the root causes of the disproportionately low representation of minoritized persons in the field of educational measurement specifically, Tsui (Citation2007) described the low rate of minoritized group STEM participation broadly as a result of multiple factors including “barriers that are of a cultural (social expectations for different groups), structural (historical laws and regulations that barred the entry of minorities into education and employment), and institutional nature (discriminatory policies and practices)” (p.556). To be sure the literature is replete with explanations of the barriers these students face both to entry and retention in STEM degrees and the profession. For example, Nestor-Baker and Kerka (Citation2009) identified several challenges in recruiting and retaining minoritized students, which involve students’ low confidence levels/imposter syndrome and a feeling of alienation within the academic environment. In a synthesis of 50 research articles, Bottia, Mickelson, Jamil, Moniz, and Barry (Citation2021) also found the underrepresentation of racially minoritized persons attempting to enter the STEM field to be associated with reduced levels of familial and social/cultural capital, inadequate academic preparation, psychosocial processes (e.g., no sense of belonging, low self-efficacy), and limited (or no) access to supplemental STEM-related learning opportunities.
In a literature review, Alfred, Ray, and Johnson (Citation2019) found that women of color in STEM report similar/overlapping barriers (beginning in K12) including stereotype threat, the absence of mentors, marginalization and isolation. The authors noted that:
For those who complete [a] baccalaureate degree and persevere through graduate school and earn a master and/or doctoral degree, current literature is replete with evidence of challenges they endure both in school and the workplace, causing some to exit from STEM education and later, the profession. (p.117)
Moreover, scholars have repeatedly reported that a lack of financial support/resources is a significant barrier to the recruitment and retention of STEM scholars (Bottia, Mickelson, Jamil, Moniz, & Barry, Citation2021; Nestor-Baker & Kerka, Citation2009; Wilson, Iyengar, Pang, Warner, & Luces, Citation2012). In fact, when examining the supply of doctoral degree holders in educational and psychological measurement, Randall, Rios, and Jung (Citation2021) found that larger proportions of Black (67.1%) and Hispanic (59.9%) graduates incurred debt during their doctoral studies when compared to their White (53.4%) and Asian (36.9%) peers. And the debt incurred was far greater for racially/ethnically minoritized students, as more than a third of Black and a fourth of Hispanic graduates entered the workforce with over $30,000 in debt related to earning their degrees. Furthermore, 8% of Black graduates reported incurring more than $90,000 in doctoral degree-related debt (compared to fewer than 3% of White graduates).
1.2 Retention Practices/Supports
Given the persistent lack of racial diversity in STEM fields broadly, considerable attention has been devoted both to identifying the barriers (as briefly discussed in the prior section) and developing/investigating supports. In fact, in an effort to address both the financial and non-financial retention barriers to the STEM field, the NSF (re)shaped its scholarship programs in STEM to encourage comprehensive approaches to retaining racially and ethnically minoritized students. The organization writes:
Recognizing that financial aid alone cannot increase retention and graduation in STEM, the program provides awards to Institutions of Higher Education (IHEs) to fund scholarship and to advance the adaptation, implementation, and study of effective evidence-based curricular and co-curricular activities that support recruitment, retention, transfer (if appropriate), student success, academic/career pathways, and graduation in STEM. (NSF, Citation2017)
Sweeder, Kursav, and Valles (Citation2021) describe one such program at Michigan State University that provided scholarships and cohort-based curricular and co-curricular activities for 90 undergraduate students in their second through fourth years of study. In addition to financial support, the program provided/required participation in cohort-based courses specifically tailored to meet students’ needs, meetings with academic advisors, and field trips to observe science-in-action. Of the initial scholars, 94% remained in STEM after their fourth year (compared to 82% of the comparison group). The program was found to reduce the retention gap among students (1) with high v. low math placement test scores as well as (2) between those with high financial v. low financial need.
To be sure the benefits of a well-rounded (i.e., more than financial support) approach to retention has been well-documented. In her review of the literature, Tsui (Citation2007) found that in addition to financial support, mentoring programs, opportunities to engage in research, tutoring, career counseling, and close relationships with faculty were all effective approaches for student retention. Kendrics and Arment (Citation2011) found improved performance in STEM courses when providing undergraduate students (n = 20; majoring in biology, chemistry, mathematics, computer science, & engineering) with financial support, and academic learning community (e.g., study groups), a living learning community (e.g., sharing dormitory space with other participants), mentoring meetings, professional development, and research experience. These supports had the added benefit of increasing students’ reporting feeling safe, comfortable, and supported. Interestingly, the authors noted the considerable impact of the research experience. In fact, students who completed one or more research experiences had GPAs that were, on average, 23% higher than students who did not complete the research experience. These students also ranked the research experience as having the largest impact on their preparedness for graduate studies or career. Bottia, Mickelson, Jamil, Moniz, and Barry (Citation2021) comprehensive review of 50 articles found that academic preparation, psychosocial processes (e.g., self-efficacy), culturally appropriate curricula and instructional practices all aided in the retention of minoritized students in STEM.
In a study of 22 women of color (13 Black, 2 Asian American, 6 Latina, & 1 Native American) in physics and astronomy, Ko, Kachchaf, Hodari, and Ong (Citation2014) found that participants were able to stay in their field by finding supportive environments that allowed for success (to combat isolation), avoiding (or actively circumventing) advisors that did not provide support, engaging with organizations and networks that embraced their sociocultural identities (e.g., National Society of Black Physicists), and engaging in activism (e.g., supporting the recruitment of other racially minoritized persons). Upon conclusion of the study the authors made several recommendations targeted at STEM departments and organizations. Specifically, they suggested that departments actively recruit more students that are women of color, require cultural awareness training for faculty advisors and supervisors, and create mentoring networks for minoritized women (meaning not just one mentor).
1.3 Rationale for Our Study
Although providing useful information (that, in fact, informed our study) prior studies are limited in two important ways. First, most research about the recruitment and retention of minoritized populations in STEM focuses on undergraduate programs and students (Ko, et al. being an exception), thus making it more difficult to generalize to doctoral students. Second, and perhaps most importantly, none of the recruitment and retention literature focuses on the field of educational measurement, specifically. Indeed, we had to turn to the literature in STEM more broadly to identify the common recruitment/retention practices as well as barriers/supports for minoritized students. Building on this extant literature on recruitment and retention within the field of STEM and undergraduate education, we sought to explore the recruitment and retention experiences of racially and ethnically minoritized students enrolled in graduate level assessment, measurement, and/or evaluation programs in the United States. Here, we would like to acknowledge that many ethnic and racial groups are classified with the status of minority in the larger context of the U.S. population. Yet these racial/ethnic identities are, in fact, overrepresented in the field of educational measurement. For example, Randall, Rios, and Jung (Citation2021) reported that among the approximately 30% of all doctoral degree earners who possessed a nationality outside of the United States, nearly two-thirds of them were from China, South Korea, and Taiwan. Consequently, although we collected survey data from both over- and under-represented racial/ethnic identities, we focus our discussion on the experiences of persons who are both minoritized and also underrepresented in the field of measurement (e.g., Black/African, Hispanic, South Asian).
Specifically, we aimed to answer the following questions:
How do students describe their recruitment experiences when considering doctoral programs? Do these experiences differ for racially and ethnically minoritized students?
Once matriculated, how do racially and ethnically minoritized students describe their experiences in educational measurement programs?
We answer these questions by (a) surveying doctoral students in educational measurement/psychometric programs (and purposefully oversampling racially and ethnically minoritized students); and (b) interviewing a subsample of surveyed minoritized students to more fully understand their doctoral experiences. Findings have the potential to better elucidate the experiences of racially and ethnically minoritized doctoral students enrolled in educational measurement programs and provide recommendations for targeted recruitment and retention practices.
2. Method
We employed a mixed-method design in which both qualitative and quantitative approaches were used in order to gain a more robust and comprehensive understanding of the research questions posed. Specifically, we first collected survey data to understand the recruitment and retention landscape in educational measurement programs. Semi-structured interview data were then collected to extend and elaborate the survey data to allow us to tease out nuances not readily apparent through the collection of quantitative data. The survey, interview protocols, and recruitment materials/protocols were approved by the university’s Institutional Review Board. Informed consent was obtained from each participant.
2.1. Data Collection
2.1.1. Quantitative Study: Surveys
Students completed a survey developed by the research team informed by: (a) strategies and processes reported in the research literature as impactful (Bottia, Mickelson, Jamil, Moniz, & Barry, Citation2021; Kendrics & Arment, Citation2011; Ko, Kachchaf, Hodari, & Ong, Citation2014); and (b) the experiences reported by racially and ethnically minoritized students in published literature and anecdotal data. Specifically, respondents were asked to report on their experiences both prior to matriculating (recruitment) and while enrolled in (retention) their graduate programs. Questions included: How did you become aware of the measurement field?; Were there any specific experiences or observations on your visits [to graduate programs] that decreased your interest in applying to those programs?; and Do you feel that your culture is valued and appreciated by your peers, the faculty, as well as the administration and staff in your graduate program? (for the complete survey, see Online Appendix A). To ensure graduate students would interpret the survey items in the ways in which we intended, we conducted a small pilot/think-aloud with four students prior to active recruitment. Respondents talked through the survey with a survey administrator (in this case a graduate assistant to ensure participants would be comfortable) and identified any issues, points of confusion, and necessary edits. The final survey was revised based on student feedback.
Participants were recruited via several channels. For instance, an e-mail describing the study was sent to the recipients of a travel scholarship (funded via a philanthropic organization) that provided financial support for racially and ethnically minoritized students to attend the National Council on Measurement in Education (NCME) Conference in 2020 and 2021. In addition, a flyer describing the study was also shared and distributed by the NCME Graduate Student Issues Committee as well as the AERA Division D student organization. The survey was administered via Qualtrics and designed to take approximately 20–30 minutes to complete. Participants received a $25 gift card for completing the survey.
2.1.2. Qualitative Study: Interviews
A subset of survey respondents from racially and ethnically minoritized groups participated in semi-structured interviews. These participants (n = 11, see for demographic characteristics) indicated their willingness to participate in a follow-up interview by responding to the survey question: “We are also looking for students to participate in follow-up interviews about their graduate school experiences. The interview would last approximately 1 hour and students will receive a $50 gift card for their time and participation. If you are interested in participating in an interview or would like to know more about it, please indicate your interest below and we will contact you.” During the interview, students were asked to elaborate/contextualize their experiences by responding to prompts like, “Describe the challenges, if any, that you’ve faced as a doctoral student” and “What can be done, if anything, to create a better sense of community?” (for the complete interview protocol, see Online Appendix B). Interviews were approximately 30–60 minutes in length, and respondents received a $50 gift card for their participation.
Table 1. Descriptions of interview participants.
2.2. Data Analysis
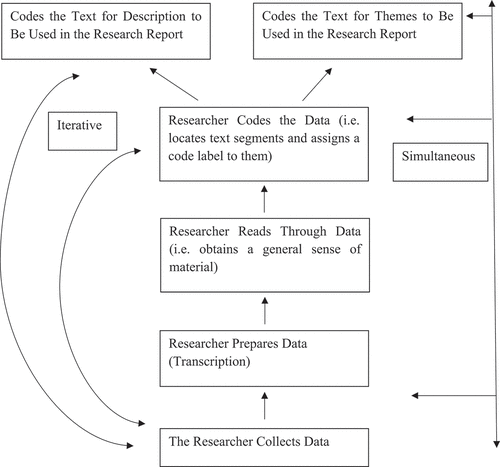
Given our intended purpose, the survey data were summarized to include frequency counts and percentages of responses across each item. With respect to qualitative interview data, an iterative and simultaneous data analysis process was employed (see for description). Specifically, transcribed audio files were reviewed to establish initial codes, then similar codes were aggregated together to identify the themes that emerged from students’ responses.
Figure 2. The Qualitative Process of Data Analysis (From Creswell Citation2012).
3. Results
In the following section, we present the results juxtaposing our findings from the survey (quantitative data collection) with those from interviews with doctoral students (qualitative data collection). We present the findings across three major phases: (1) pre-enrollment/recruitment which includes information seeking and decision-making influences; (2) graduate experience including program climate and curriculum; and (3) post-graduation plans.
3.1. Sample Description
The sample consisted of responses from 98 current or recent graduate students in the fields of educational measurement and psychometrics (90% were enrolled at the time of responding to the survey). Of those currently enrolled, 84% were PhD students, while the remainder were registered in a terminal master’s program (15%). The majority of respondents self-identified as women (65%) and domestic students (56%). Because this study was interested in understanding the experiences of racially and ethnically minoritized students, a highly diverse group of students were sampled. Specifically, in terms of race/ethnicity, the largest representations came from Whites (22%), Latinos (21%; 10.5% Mexican/Mexican American; 10.5% other Latinos), Asians (20%; East Asian, 3% South Asian, 0% Southeast Asian), Black Americans (13%), Africans (8%), and Caribbean/Afro-Caribbeans (8%). Approximately 92% of the sample was multilingual and 60% noted that English was not their first language. In terms of first-generation college student status, there was nearly an equal split between those that identified as first-generation (51%) and those that did not (47%).
3.2. Application Decision Process
3.2.1. Awareness of Measurement Field
Prior to applying to educational measurement graduate programs, potential applicants must first be aware of the field. Across the sample, students’ introduction to the field of measurement was varied. Of the 64 written responses provided, 44% of graduate students became aware of the measurement field through coursework, with first-generation students (31%) nearly two times more likely to find the field through this path than their non-first-generation counterparts (17%). Among those individuals introduced to the field via coursework, 64% of students indicated that they enrolled in a course as an undergraduate that heightened their interest in measurement. For example, one student wrote “During my undergraduate study, I took an introductory educational measurement class, and I liked the field and wanted to study [it] more deeply.” Another student wrote, “I became aware of the measurement field during my undergraduate journey. As a psychology major, I took in a few measurement and statistics courses after thoroughly enjoying my Stats I course.” Although most of these respondents indicated that the course was taken as an undergraduate (64%), the remaining 36% specified that their introduction to the field came in either another or their current graduate program.
The second most common method to learning about the measurement field was from an advisor/faculty recommendation (22%). For instance, one surveyed student responded, “A statistics professor at my undergraduate institution mentioned it [the measurement field] to me when we were having a discussion about my interests.” Another said, “My undergraduate advisor talked to me about the importance of knowing psychological statistics, and when I was accepted into my current Ph.D. program my graduate advisor said all his grad students need to minor in quantitative psychology because our work is heavily dependent on advanced statistical (namely regression) techniques. This is when I learned about measurement as a field and became interested in it.”
In addition, nearly one-third of responses reflected that their introduction to the field came from participating in research related to measurement (16%) or through professional work experiences (16%). Interestingly, first-generation college students were four times less likely to become aware of the measurement field due to their work experiences than non-first-generation students (29%). Concerning research participation, one survey respondent stated the following, “I became aware by working on a research project with a researcher. She introduced me to theories related to CFA and IRT.” Other respondents noted the importance of their professional work experiences. For example, one survey respondent said, “I was a teacher before starting my graduate program. I attended a conference with a session hosted by representatives from the education department of the state we were in. They presented on the English test required for emerging multilingual K-12 students in the state. I started researching English tests, and that led me to psychometrics.” Beyond these two areas, other popular means of learning about the field came from researching graduate programs (11%; “By applying to graduate programs. I knew of quantitative psychology, but not the measurement field.”) and from other students/colleagues (6%).
3.2.2. Information Seeking
Across the sample, 68% of respondents made contact with program personnel for at least some of the programs they applied (33% reached out to all programs), while the remaining one-third did not reach out to anyone associated with programs for which they applied. A comparison between international (15%) and domestic (45%) students showed that the latter group was more likely to contact all programs at three times the rate of international respondents. As one international student noted, “I didn’t talk to students or faculty when applying, because it was difficult to coordinate because I was in a different time zone and everything” (Student 3). Additionally, first-generation students (74%) were slightly more likely to contact programs to which they were to apply than their non-first-generation (64%) counterparts. In terms of the information sought, respondents reported asking the most questions about program requirements and course-related information (88 total responses) primarily to faculty (47%) and current students (28%), with an additional 25% of responses split between program alumni and staff. The second most common type of information sought by applicants was research-related (80 total responses). Such questions were targeted to faculty (60%), current students (23%), and program alumni (11%). In addition, financial questions were also popular (59 total responses) with both faculty (44%) and current students (34%) being the most commonly accessed resources, followed by program alumni (12%) and staff (10%). The least common questions were related to program climate (39 total responses). Unlike the other question types, program climate inquiries were geared primarily toward graduate students (54%), followed by program faculty (26%), alumni (15%), and staff (5%). When asked whether reaching out to programs prior to applying was helpful, 83% of respondents indicated that the correspondence made them more likely to apply, while only 7% suggested that it had a negative effect.
3.2.3. Visiting Campus Prior to Applying
Program location was an important factor in where respondents decided to apply and enroll, with over 75% suggesting that this factor was moderately to extremely important. An interviewed [international] student noted that, “We were looking for a university in a big city where we could go and pursue a PhD … and I applied to five places which were all in big cities” (Student 3). Additionally, some respondents were limited in the programs that they applied to due to their incapacity to move based on familial (e.g., location of romantic partner) and work (i.e., some individuals enrolled on a part-time basis while maintaining a full-time job) responsibilities. For those that did not have those limitations, over one-quarter of respondents noted that they were very to extremely concerned about the difficulties of moving to a new place and leaving their community. As an example, one international student respondent noted fears of leaving their country and “being excluded due to toxic politics.”
Although location was a salient factor in application decisions, 63% of respondents reported that they did not conduct an on-campus visit, while 28% visited some programs and only 10% went to see all programs to which they considered applying. For those that did make a campus visit, over half (53%) reported that it made them more likely to apply, while 40% suggested that it had no impact on their application decision. The former group of respondents noted that their decision to apply was driven by a positive sense of program culture (8 of 13 respondents). For instance, some individuals suggested that they had the opportunity to meet other students of color as well as see that students were collegial and provided a stimulating learning environment with adequate resource availability in terms of access to libraries and research tools. In addition, visits allowed applicants to interact with program faculty, with many noting that the interactions were quite positive (5 of 13 respondents). Reasons for individuals being less likely to apply after their visit were associated with limited diversity in the ethnic composition of the program (sometimes known as the concept of critical mass) as well as limited access to stores (e.g., grocery stores and pharmacies), transportation hubs (e.g., the airport), and good quality schools for their children. An additional concern raised by respondents from their campus visit was a sense of poor program climate based on a limited perception of collaboration and a less than expected standard of learning.
3.3. Factors Driving Decision to Enroll
3.3.1. Funding
Turning to important factors related to respondent’s decisions to enroll in their current graduate program, financial support, availability of assistantships, and overall affordability (considering cost of living) were of greatest importance. During interviews, one student said,
So definitely the in-state tuition made a lot of sense for me. It was between this program, sorry, and a program at a private institution, as well as a program at an out of state institution and I just had a very stark realization that I didn’t want to go into debt, because I had graduated debt-free from undergrad. And if I was going to incur debt, I didn’t want to have to change, I guess, not change but have to buy things that I would need in order to survive in the north or anywhere else outside of Florida, really, because like I said, my home is here, so climate and I guess cost of living and cost of tuition were the final decisions that made me choose a program here. (Student 4)
Another student noted that the availability of financial support was one of the most important factors in their decision-making by stating,
I wasn’t in a position where I could pay for tuition and education. So that was probably one of the biggest factors … was I going to be able to receive financial support and was the financial support something that I could realistically live off of depending on the location. There was one program that I applied to that offered me financial support, but I knew knowing the area, it wasn’t going to be sufficient to be able to live a decent life. (Student 5)
The sentiment noted by interviewees was supported by approximately 50% of surveyed individuals who reported being very concerned to extremely concerned about financial stress during the application process. When asked to elaborate on their concerns, some surveyed respondents were unsure of: (a) whether attending graduate school was a good financial decision (“ … grad school meant a lower salary. I am not sure if grad school will increase my eventual salary”); and (b) whether funding would be available prior to graduating (“ … it seems too optimistic to graduate in a timely manner before the funding runs out”).
Speaking to the funding issue, more than 50% of respondents noted that they would not be able to currently support themselves financially if there was an emergency or even attend academic conferences always or most of the time. Supporting experienced financial difficulties during graduate school, one student said the following during a follow-up interview,
But they stopped funding me, so I had to take out loans towards the end, and that was very difficult. I actually still have those loans I have to pay for. You know what I would change? If I’m publishing, I should get funded. If I’m somebody that graduated with one paper published, two book chapters, another one in submission, and a third one that is going to be submitted, I feel like I earned being paid, but I didn’t. I wish there was more. (Student 6)
3.3.2. Faculty Reputation
The second most important set of enrollment factors was related to the desire for respondents to have access to a set of faculty members with established reputations within the field as well as to be mentored by faculty with similar research interests. For instance, some respondents stated that an advisor’s publication productivity, grant funding, and notoriety were of great influence in where they applied and enrolled. Additionally, an advisor’s history of student placement into selective industry and academic positions were also noted as significant factors. During interviews one student noted, “So I applied for [sic] a few schools, I looked at the curriculum requirements to graduate and I narrowed down the choices based on that information as well as the faculty and the research that they’re doing” (Student 2). Another student stated, “I received advice early on from my undergraduate advisor as well as a post baccalaureate advisor that your relationship with your advisor is like a marriage and you don’t want to be in an unhappy marriage. So I took that to heart when considering [programs] whenever I spoke to these potential advisors and whether I could see myself with them and what their mentor style was like, and that would align with me and who I was.” (Student 5)
3.3.3. Program Environment
Program environment was important to respondents when considering where to enroll. For instance, some respondents indicated their desire to find an advisor that was supportive as well as an environment that felt welcoming. This sentiment was echoed in the student interview data, with one student saying,
Something that I looked into was a welcoming and accepting environment, where I knew I was going to feel comfortable and I was going to feel safe. I come from an underrepresented background. I’m [redacted for anonymity] and I’m bilingual, so I openly speak my native language of [redacted for anonymity]. And I wanted to make sure that I felt comfortable and safe, not only speaking my language, but also knowing that I’d be able to find products that I grew up with, such as being able to replicate foods and dishes that I grew up with. (Student 5)
One driving force for students desiring a supportive environment stems from many reporting that they were unsure of what they were getting themselves into when entering graduate school and possessing feelings of intellectual inadequacy. Concerning feelings of inadequacy, open-ended survey responses in our sample reflected concerns of language capabilities (“feeling that my linguistic … skills would not be enough to keep up with the program”), age (“I started this program at the age of 50. Could I do this when I am older and my memory is not as good as it was … ”), and belongingness in academia (being “not good enough”).
For many of the respondents, a welcoming environment where they felt accepted was important in combating concerns over mental health, isolation, stress in managing multiple roles and responsibilities, as well as feelings of guilt for prioritizing their education over their family. Beyond relying on the support or encouragement from family (43%) and friends (29%) to address these emotional concerns, nearly one-quarter of respondents spoke to the importance of their professors/advisors (16%) and fellow students/colleagues (9%) in helping them to navigate stressors. Given the importance of faculty and students, a little over half of respondents reported that diversity was of importance when considering where to apply. For instance, a few respondents suggested that they were drawn to applying to and enrolling in their current programs “ … because of the incorporation and acknowledgment of diversity and equity concerns in the research of the faculty members” as well as the opportunity “ … to pursue … graduate studies at an HBCU.” An interviewed student noted that
when I looked through the program, they definitely had a clear statement saying underrepresented students, we appreciate diversity. So we encourage all kinds of people to apply. So I think that’s really helpful when somebody sees it on the online application system or whatever prompts the program chair has put up for prospective applicants.\ (Student 9)
3.4. Graduate School Experience
Respondents were asked about promises made by their current program once they were accepted, and indicated that the top three assurances were funding (36%), research opportunities (30%), and mentorship (16%). An area where there were less program commitments was related to faculty time (8%), while only 8% of respondents noted that their program did not make any promises or offers. When queried as to whether their program delivered on their promises, respondents overwhelmingly stated “yes” (89%). In this section, we describe reports of students’ actual experiences in their graduate programs.
3.4.1. Feelings of Community, Value and Inclusion
To learn more about perceptions of program fit, respondents were asked whether they felt valued and included by their faculty, peers, and administrative staff. Over 70% agreed or strongly agreed that they feel valued by fellow students and professors within their programs, while the rate of agreement for administrative staff was over 60%. In terms of value from faculty, one respondent noted the following:
I would say in education, the faculty members are more compassionate about their students. Maybe it’s part of the educational curriculum. I don’t know, because I was talking to a friend in economics and we were discussing about, oh, faculty members. I was telling her, “No, my faculty members are like mothers and fathers. They care about us. Financially they are there. Morally they are there. And that was one of the things I’m enjoying. (Student 7)
Furthermore, a high percentage of respondents felt that their culture is valued and respected by their peers (77% agreed or strongly agreed), faculty (74% agreed or strongly agreed), and administrative staff (70% agreed or strongly agreed). Furthermore, over 60% of respondents agreed or strongly agreed that they feel that their program has a commitment to diversity and is committed to being explicitly anti-racist. Subgroup analyses showed that this sentiment was strongest for Asian students (79%), followed by Black (68%), Latino (56%), and White (40%) students. Across the sample, more than half of respondents agreed or strongly agreed that their program openly discusses race issues (53%), makes an effort to build their understanding of race (55%), looks to be committed to racial justice (60%), attempts to build inclusive practices (52%), and appears to be conscious of the unique challenges faced by minoritized students (53%). Still, survey responses revealed the presence of non-inclusive and de-valuing experiences in some programs. Nearly a third (32%) reported having witnessed a significant instance of bias, discrimination, or harassment by someone in their graduate program-10% noted instances committed by a faculty member and 8% by another student, while 13% of respondents were unsure. The rate of these instances was noted to occur rarely (21%) or sometimes (15%), though not often (0%).
Although respondents predominately felt valued, there was a mixed feeling of community support. Specifically, when asked whether there is a well-established sense of community in their graduate program, 54% of respondents did not agree or strongly agree (this rate was 45% for the general university). As an example, an interviewed student identified “community finding” as one of the biggest challenges, noting the following: “ … so I found my group, my community, my academic community, but other than that, it’s hard to meet other students … but I think with just any measurement program, making sure that you get the students, you give them community” (Student 2). This student noted that, although the program is admitting a more diverse group of students, it does not appear to be actively promoting an inclusive environment, “I guess there are a mixture of students, different races, ethnicities within our program, so they are admitting students of diverse populations, but I wouldn’t say they are promoting it or doing much about it.” When referring to the sense of community, another student said,
There really isn’t. I personally don’t feel … and I’m sure you’ve gotten this a lot if you’ve interviewed other students. The pandemic, obviously, had made things worse before it didn’t really feel like a community at all, just because everyone is so siloed and everyone is doing their own thing … I think the program could do a better job of engaging its graduate students and having students (not forcing them), … but maybe creating a better space for students to be able to engage with each other. (Student 4)
To help mitigate the problem of isolation, one student remarked that measurement students have been encouraged to “reach out to organizations like NCME, look at different professional organizations and network with other measurement professionals there and students” (Student 9). An additional data point that supports concerns about the sense of community within respondents’ graduate programs was the limited satisfaction with peer collaboration (only 18% of respondents were extremely satisfied and 17% were somewhat satisfied). The lack of community may have been most felt by some minoritized students, with one stating, “Socially, it’s hard because people meant well but sometimes I felt like they didn’t really understand where I was from, or who I was…I feel like I have to build my social support myself through other students of color” (Student 6).
Still, some students reported that their programs did an excellent job at establishing a thriving community. For example, one student said:
…it is quite a professional program. I sensed this like when I did the recruitment visit too. So I think when we are on campus, we always try to stay up to date with each other’s professional achievements. And then we have a student organization here. We organize Brown Bags talks, or we try to write articles for the newsletter and things like that. So there’s a lot of coordination and a lot of communication as to what’s going on in each other’s professional lives. Apart from that, when we compete in any competition where you’re trying to present your research, we always support each other. I think that was something that I really liked. It’s not competitive like within the program, so everybody’s really happy with others achievements and then help out wherever they can. We do try to meet outside as well as time permits. (Student 9)
3.4.2. Supportive Practices
Several students indicated what practices, or experiences, helped them during their doctoral studies. For example, one student stressed the importance of faculty having empathy saying:
Maybe just have more empathy, just be really understanding of how things have changed so dramatically for so many of us. Not all of us come from a wealthy background where we’re able to just work and coast by. Again, there’s nothing wrong with that, but a lot of us do come from backgrounds where we have to work extra hard to make ourselves seen and to make ourselves known and to be able to complete the work that we want to do. So I guess just being more mindful and more empathetic of students, because again, a lot of our professors are just 10 plus years into their career. Of course, when they were in grad school their experiences were totally different, so understanding that our society and our views of society are always changing all the time and to just be understanding of it. (Student 4)
Similarly, many students- both surveyed and interviewed- discussed their mentorship experiences, and these experiences varied. Over 65% of surveyed students agreed or strongly agreed that they were satisfied with the advising that they received in their program. These respondents specifically felt that their advisor is a mentor, an advocate, allows for autonomy in students setting their own priorities, and provides advice and resources to support students in their goals and ambitions. When referring to the quality of the mentorship received, one interviewed student said: “It’s fantastic. My supervisors, every week we meet and they give us professional training and [this support] apart from that [support I receive through] being a [redacted for anonymity] Fellow has been so impactful … ” (Student 7). Another interviewed student expressed similar feelings about the mentorship experience, “So my advisor, our relationship definitely has been positive through all this time, she’s done a great job of just mentoring me and providing me support in terms of understanding the academic life, understanding work-life balance, things like that” (Student 4). In general, students noted that good mentors were supportive, communicative, approachable, and committed to moving the student forward (holding students accountable). Interviewed students also had specific recommendations for mentoring: “As a mentor, I think you should reach out at least once a month and just see how the student is doing. Sending opportunities out to them. … So just trying to connect students with other students within the program if they have questions” (Student 2).
Still, among the 11% of surveyed students who reported that their programs failed to deliver on their promises, mentorship (“Mentorship has been hard to get – professors are very busy … ”) was a key area where their programs missed the mark. Indeed, across all surveyed students, overall satisfaction with the mentoring they received varied. Interestingly, satisfaction levels were higher for international students compared to domestic students, with the former group agreeing/strongly agreeing that they received satisfactory mentorship and advising at a rate of 79% versus 52% for the latter group. When comparing White students (53%) to Black (58%) and Latino (56%) students, no large differences in advising/mentoring satisfaction were found. Nonetheless, students were appreciative of the mentorship they did receive (“it hasn’t been the best mentorship, unfortunately, but I don’t feel that I’m lacking [in] any way.,” Student 2). Whereas, other students acknowledged the difficulty with knowing the right balance when it comes to mentoring. As one student put it, “The last year I had one semester where I couldn’t do any work, I was busy with other stuff. And I’m happy he didn’t bug me about the dissertation. On the other hand, we haven’t spoken in months so I could have died. He wouldn’t have known. So it would be nice for him to be a little more involved. But I know that if he were to e-mail me, let’s say every month, I would feel pressured. I don’t know. I’m having mixed feelings with this relationship. I don’t know” (Student 3).
3.4.3. Course Availability
Even though most interviewed students felt some level of personal support from their programs (through mentorship, student community), several interviewed students reported dissatisfaction with the curriculum their programs were able to provide. This was especially true for students who attended smaller measurement programs (in terms of the number of affiliated faculty). As one student noted, “In terms of the coursework, it’s a little more limited. A lot of the things that I do, I have to learn myself. The people do support me personally, but the structure of the coursework, not so much” (Student 3). Moreover, in nearly every case [interviewed] students reported having to take courses outside of their departments, institutions, or (when they were financially unable to do so) attempt to teach themselves. With respect to academic support, one student said “We have limited faculty … and [that faculty member] has a very narrow scope of what they are into. I’ve had to take courses outside of my institution … So it costs more money because I pay my tuition and then I pay elsewhere” (Student 1). And this sentiment was echoed repeatedly, even with respect to [foundational] courses. For example, one student said,
There are some courses I wish I would have taken because when I look at traditional measurement programs, they are heavily measurement focused like at UMass and other schools. I wish I had an item response theory course. And he said, “of course, you could take it at other institutions, but I’m like “yeah, it costs a lot of money, but I’ll read up on it. I’ll get a book. I did take a measurement course, but I thought it was just surface level. We didn’t go deep into it, of course. (Student 2)
In addition, other students felt a lack of preparation for more advanced courses due to either instructional quality (“They need to have better professors in the foundational courses.”) or instructional assumptions (about prior knowledge). One student noted that – due to previous coursework she had taken prior to entering her program – she felt prepared for the content, whereas, in other ways (e.g., preparedness to use statistical software/coding), the student felt less prepared and that the program could have done more nothing: “I wish there was more progression in terms of preparing you for that, not just assume that everyone is going to come from a math background because not all of us [have one] … ” (Student 6)
Respondents were next asked questions pertaining to their post-graduation plans. To begin with, approximately 70% of surveyed graduate students reported being somewhat or very concerned about the prospects of the job market in the measurement field. This finding may be one reason why nearly half (45%) of respondents reported planning to seek employment both within and outside academia. Such a strategy may allow a graduate student to maximize their probability of obtaining a job. With that noted, 24% stated their preference for an academic position, while 29% expressed that they would solely seek a position outside of the academy. Speaking to the desire to obtain a position in industry, one interviewed student said,
Well, I want to join industry. There’s a lot of different ways I can go about finishing up that answer, but I want to go into industry for two main reasons, one, I feel better prepared to go into industry. I think with how our program is, you had to have expressed interest early on that you are either interested in going into the private sector or academia. And, I guess, how they would prepare you to enter those two fields are going to differ, not that your education or your experiences will be completely changed in the program, but there are stuff that you need to take or there are things that you need to accomplish in order to enter academia and, of course, the private sector. I think my program could do a better job of being honest with students about that, because some students may feel that it’s too late. But I’m happy with that decision and going into the private sector, because I feel like I’ve been in this academic space for way too long and I want a break, I want an out. (Student 4)
When respondents were asked whether they felt prepared to apply for their desired position, 38% reported being well prepared, while 35% noted that they were moderately prepared, and 26% felt that they had little to no preparedness. For those individuals in the latter category, many elaborated that they did not feel that they were prepared because they were in the early stages of their graduate training, lacked a comparably strong publication record in comparison to other students in the field, and/or need to improve their teaching and presentation skills. One potential reason for feelings of being underprepared for the job market may stem from students’ limited satisfaction with career support in their graduate program. Specifically, only 39% of respondents agreed or strongly agreed that they were satisfied with the career support provided by their program. For instance, only half of respondents agreed or strongly agreed that their advisor provides knowledgeable information about career opportunities within or outside of academia. One survey respondent wrote that, “My program provides ZERO (emphasis added by respondent) post-graduation support or career planning/advising”.
4. Discussion and Recommendations
In this study we sought to examine the recruitment and retention practices of graduate educational measurement programs as experienced, or perceived, by doctoral students, specifically racially and ethnically minoritized doctoral students. Our findings revealed several key points. First, recruitment practices of educational measurement programs tend to be minimal or nonexistent. In fact, no minoritized student reported having been actively recruited into the field of measurement. Second, our findings confirmed what we suspected to be true, which is the criticality of doctoral students having strong and consistent mentorship from faculty within and (often) external to their academic programs; and, in most cases students reported they received this support. Third, and not at all surprising, lack of funding (both the fear of prior to enrollment and reality of post enrollment) was a significant source of stress for racially and ethnically minoritized students. Fourth, we found (unexpectedly) that many students reported dissatisfaction with the overall curriculum offered through their doctoral programs and expressed concerns that they would be underprepared for the job market. Finally, students greatly valued the opportunities they received to engage in more applied research. In this section of the manuscript, we describe these findings and make recommendations.
4.1. Recruitment
The findings from our study demonstrate that there is a clear need for a more systematic approach to recruitment as a field. Our data revealed that most students stumbled into the measurement field with “no recruitment at all … ” (Student 4) as one interviewed student remarked: “It was just a lot of coincidences that worked; but honestly I would not have known it existed other than that … ” (Student 10). That is, no one reported being drawn in by any organized efforts to recruit BBI scholars into the field. As noted by Sireci (Citation2000), the field can strategically attract marginalized populations to educational measurement via methodical efforts led by our national organization, NCME. As it currently stands, the onus is placed on individual faculty to introduce students to our field, which may be ineffective given that many faculty lack both time and financial resources to lead systematic recruitment efforts that will substantially increase the number and diversity of students in educational measurement.
Indeed, several of the students we interviewed suggested we concentrate more efforts on recruiting undergraduate students. One interviewed student said,
So I would go where the students are and I would pay attention to what minority students are studying. If we’re focusing on a whole lot of STEM majors or humanities majors, and then figuring out a way of showing how psychometrics can be connected to, or is a part of what they’re already doing. So if they’re not already headed in a similar path, I wouldn’t bother, but if they are, then we can have those conversations (Student 1)
Another student discussed how it is important – as we recruit undergraduate students – to help them see/feel personal connections to measurement:
I think when you inform them about the field, it’s making it relatable to them, especially with underrepresented populations. Based on research and statistics, unfortunately, we don’t test well. For example, you can easily go to the GRE and look at some older recent questions and ask, How did you like these questions? Did you understand it? Do you think the questions were bias[ed]? If you can change this question or if you could have reworded it, how would you do it? And then say, ‘There’s a field that does that, psychometric measurement.’ We look at those things. We look at test bias questioning and so forth and just to get them in, get that buy in. And then explain what you can do with it, anywhere from actually creating test questions, from making decisions on the amounts and so forth, how many questions you ask, but it’s just first making them aware and making it relatable to them. (Student 2)
One recommendation would be that NCME develops, or reactivates, a recruitment committee that can leverage the financial resources of the organization to increase the pipeline of new students entering the field. At the time of this writing, such a dedicated committee is non-existent. With that said, there is great potential for NCME to partner with external organizations, such as MAES (Latinos in Science and Engineering), Advancing Indigenous People in STEM, College Science and Technology Entry Program, and the Society of STEM Women in Color to bring awareness to our profession and to serve as a host in bringing faculty together to discuss effective practices. These discussions would benefit from recent work that has focused on studying potential solutions for increasing student recruitment, which includes diversifying course curricula and improving the information shared with potential applicants via program websites (e.g., Leventhal & Thompson, Citation2021; Randall, Rios, & Hung, Citation2021; Rios, Randall, & Donnelly, Citation2019).
One of the most important pieces of information that could be shared with individuals in the recruitment process is the availability and diversity of current jobs, given that many students will be interested to know their potential return on investment if they were to dedicate years of their lives to graduate study (Finney & Pastor, Citation2012). As an example, our field could do a better job of sharing with potential students the median salary for professionals in our field, which has recently been found to range between $110,000 and $130,000, an amount that is more than double the average salary of Americans ($58,260; Bureau of Labor Statistics, 2022; Leventhal & Thompson, Citation2021). This financial information coupled with the potential for measurement professionals to engage in societal good can be a powerful combined approach to recruitment.
Once increasing awareness of the societal and financial benefits of our field, programs could help increase interest amongst more diverse students by being explicit about their application review process. Information, such as desired undergraduate/graduate major, grade point average, GRE score requirements (along with competitive score ranges), and whether a holistic review process is employed, should be made explicit to potential applicants across various communication methods (e.g., program websites, information sessions).Footnote1 As noted by Rios, Randall, and Donnelly (Citation2019), students from minoritized backgrounds may benefit from such explicit communication as many of these individuals may have fewer resources, knowledge, and mentorship in applying for graduate school. Furthermore, adding a simple statement that notifies prospective students of a program’s appreciation for diversity as well as their stance in not discriminating against applicants based on their physical and/or other identities could be useful in creating a sense of a hospitable and welcoming program culture.
4.2. Funding
The need for better funding was also a consistent theme across both the survey and interview data. Among the 11% of surveyed students who reported that their programs did not follow through with their promises, financial support (“ … I spent the entire first semester without any financial support and had to [take a loan] just to be able to eat and pay rent”) was a key area of disappointment. One interviewed student’s statement represents student sentiment overall:
Financially speaking of course, our university, in general, could do better to support its grad students … Could it be better? Of course, because we’re not making anything that would amount to a livable wage as it is. And so, a lot of graduate students with families, of course, are suffering or have to find other jobs (Student 4).
This student, along with others, noted that they received funding, but not enough to live on. Another student describes the situation: “I have a stipend. Other people don’t, but I do. But it’s not sufficient, considering where we are. Maybe it would be sufficient somewhere, like in the Midwest. I don’t know. But in [city redacted], it’s definitely not enough” (Student 3).
We recognize that providing adequate funding for any doctoral student can require considerable faculty effort (especially for those faculty housed at universities that require faculty to fund students at the program level through grants and contracts). And providing adequate funding for historically marginalized doctoral students who cannot rely on the financial support derived from generational wealth requires more effort still. Nonetheless, doctoral programs can – at a minimum – be very transparent during the recruitment process about funding opportunities and explicit about the criteria by which students will be able to retain funding. This transparency should include data about the cost of living (average rental prices, utilities, etc.) as most students (especially first-generation students with marginalized identities) readily assume that the stipend provided by the university allows for comfortable living. Such transparency would further allow students – particularly those who are international or from varied parts of the country – to make more well-informed decisions about where they choose to matriculate.
4.3. Mentorship
The importance of mentorship – in different forms – was also a salient theme that surfaced through both the interview and survey data. As one interviewed student shared, I need “someone who can really understand me, someone who can guide me and someone who knows what he or she’s doing” (Student 11). And most of the students we interviewed reported positive, and varied, mentoring experiences. Indeed, when it comes to the academic success of racially and ethnically minoritized students, specifically, the literature suggests that mentoring is a critical component (Kendrics & Arment, Citation2011; Tsui, Citation2007). Still, the challenges of providing effective mentoring for these students has also been well documented. Minoritized students are more likely to be (a) impacted by imposter syndrome (Clance & Imes, Citation1978), (b) the objects of implicit biases (Chaterjee et al., Citation2020) and microaggressions (Pierce, Citation1970, Citation1974; Sue, Citation2010), (c) and assigned to mentors who lack the cultural competence to provide safe, respectful spaces for them to develop (Cross, Bazron, Dennis, & Isaacs, Citation1989).
To address these challenges, scholars and practitioners have suggested extending our conceptualizations of mentoring beyond that of the traditional guru model (i.e., one person alone acts as a sage who holds all knowledge and arbitrates its value) to include, for example, mentoring networks, peer to peer mentoring, and group peer mentoring. In fact, scholars have argued that the traditional “guru” model of mentorship often employed in university spaces is rooted in patriarchal systems of power, hierarchy, and exclusion. Such models have historically devalued the knowledge and experience of minoritized populations (Goerisch et al., Citation2019). Moreover, this model of mentoring can often result in a poor, ineffective match more than a successful one; and as Goerisch (Citation2019) notes, these poor matches can ultimately (due to uneven power dynamics) result in actual harm for marginalized persons. To be sure universities, like the University of Michigan, have reported success in establishing mentoring committees for newly hired faculty. These committees – referred to as Launch Committees – are intended to provide the faculty member with multiple perspectives from more senior faculty. Such mentoring approaches remove the pressure of one-on-one models.
We argue for a similar model for doctoral students. Indeed, several students interviewed in our study found that relying on different mentors for different purposes led to the most meaningful experiences/relationships. In fact, one interviewed student noted, with respect to [an ad-hoc] peer-mentoring circle:
I think for me, I totally felt imposter [syndrome] many times. I didn’t respond during class … because I didn’t feel like I had the skills I needed. I did manage, actually with another woman of color, we did a group and then she had the skill sets I needed, so we discussed and she was a peer mentor to me. I think maybe having peer mentoring with other students, like more senior students with students who are just starting to be interested in it. It will be really helpful. To me, that’s actually what helped me understand what I needed to do, rather than sit there, ‘Oh, my god. I don’t understand anything.’ So I can discuss with her, she was like, ‘You don’t have to feel that way. This is what you need to do (Student 6).
To facilitate the development of these types of mentoring circles, the Center for Measurement Justice has sought to codify this model more formally between working professionals and racially/ethnically minoritized doctoral students in educational measurement/psychometric programs. Once a year, doctoral students (who are a part of a larger professional support network) are given the opportunity to opt-into a mentoring circle facilitated by a scholar who also identifies as Black, Brown, or Indigenous. Such a model attempts to create a mutual mentoring space in which graduate students are provided with the opportunity to share their experiences, troubleshoot their challenges, and provide support for each other facilitated by a scholar of their choosing. Indeed, multiple interviewed students commented on the benefits of this program, particularly in university spaces.
For racially and ethnically minoritized students, however, simply moving beyond traditional models of mentoring may not be enough. In fact, the mentoring literature acknowledges benefits of mentoring relationships in which the parties share key sociocultural identities (e.g., race, ethnicity; Ensher & Murphy, Citation2005; Goerisch, Citation2019). And these benefits were echoed by the findings in our study. As one interviewed student noted:
I think having someone who is a person of color or who can kind of share with you those experiences make a good mentor. I have a current mentor who is a woman of color who has done everything in academia, industry, …and that is just very rich and fulfilling for me, because they’re able to speak from all their experiences on top of being a family person and having their own family” (Student 4).
Still, we recognize that quality mentoring practices require considerable faculty time and that faculty of color, in particular, are already overburdened in university spaces; and this labor (i.e., the labor of effective mentoring) can further perpetuate existing systems of oppression for marginalized groups (Barcan, Citation2014; Goerisch et al., Citation2019). Indeed, scholars have argued that the labor of those who exist on the margins of the university should be recognized in tangible and meaningful ways (e.g., income compensation, credit toward tenure/promotion, Goerisch et al., Citation2019). We echo that recommendation and suggest that departments formally recognize the time (and at times emotional toll) that providing meaningful mentorship requires of minoritized faculty and provide some form of compensation (e.g., annual course release to facilitate mentoring circles) that acknowledges that commitment. Moreover, we recognize that the field of educational measurement is unique in that many of its professionals are actively engaged in research/scholarship outside of the academy. Educational testing organizations, similarly to academic institutions, could allow minoritized researchers to dedicate some portion of their time to providing formalized mentoring to doctoral students (e.g., facilitating a peer mentoring circle, or serving as a member on a mentoring committee). To be sure, these scholars are well aware of the barriers to success in a doctoral program and could provide a much-needed perspective, while at the same time lessening the burden of the precious few minoritized faculty in the field.
4.4. Curriculum
Student concerns, or dissatisfaction, with the available curriculum was, perhaps, one of the most unexpected findings; and this issue was more profound in smaller programs. Nearly every student we interviewed reported, in order to learn what they believed to be critical content, having to take at least one course outside of their departments or institutions (or simply teach themselves). For most, this concern was rooted in fears about their post-graduation outlook. As one interviewed student noted most precisely, “I saw the job market. I saw the requirements and I realized I wasn’t getting as much as I needed to be competitive in the job market.”(Student 2)
To be sure, students have reason to be concerned about their preparedness for job opportunities post-graduation. In their comprehensive review of the curriculum of educational measurement and psychometric programs in the U.S., Randall, Rios, and Hung (Citation2021) interviewed measurement professionals across the government, academic, and industry sectors to determine what knowledge and skills they found critical to their professional success. Every professional identified course content that focuses on Classical Test Theory, Item Response Theory, test development, and validity as critical for professional readiness. And, although the authors found that most of the courses dedicated to these topics were offered among the top programs, they were not all offered/made available across every program. The inability to study these topics more deeply (beyond what can be gleaned from an introductory, or survey, course in psychometrics) can leave students feeling underqualified for competitive internships and/or ill-prepared to enter the workforce.
Based on these findings, we echo Randall, Rios, and Hung (Citation2021) recommendation that the field of educational measurement establish, at a minimum, basic competencies to be addressed by measurement programs. In fact, we appreciate current efforts by NCME to establish foundational competencies through a Presidential Task Force. To be sure, curricula concerns represent an equity issue that impacts – as we found in this study – students from the most marginalized populations. If programs cannot provide students requisite skills for the educational measurement/psychometric profession (due to limited resources or interest) then we must have systems of transparency in place that will allow applicants to make informed decisions for themselves. At a minimum, measurement programs can provide, or post, a document describing their regularly offered course curriculum; and (once the foundational competencies are established) how this curriculum addresses each competency. We believe the work of NCME Presidential Task Force is the first step in creating a powerful lever to ensure that all students seeking a career in educational measurement/psychometrics – especially historically marginalized students who must operate with less capital – benefit from comprehensive training.
An alternative, more comprehensive, step would be for the organization to provide some programmatic oversight to ensure that programs are meeting the content/skills needs of students and the profession. Measurement professionals wield a great deal of power across critical spaces/industries (e.g., education, health), and we believe programs that purport to train these professionals should be required to meet some minimum standards to claim so. Again, this speaks to issues of transparency (and consequently equity) for prospective doctoral students, especially those from minoritized populations, as it can provide them with some assurances that they will receive the requisite training to do the work of measurement.
4.5. Research Opportunities
Providing students with research opportunities is not only an excellent approach to introducing our field to the uninitiated (Finney & Pastor, Citation2012), but it also serves as a means of both strengthening graduate students’ professional identities and improving retention of these students in the field (e.g., Tsui, Citation2007). As noted in our findings, graduate students sampled chose their programs based on the research reputations of the faculty as well as perceived collaborative potential. With that noted, some respondents were disappointed with the research opportunities available to them. One potential reason for this finding is that student’s financial support may have come in the form of teaching assistantships, which would limit the available time that these students had to engage in research. A solution to this problem noted by Sireci (Citation2000) is for the field or individual graduate programs to partner with testing organizations, state departments, and for-profit companies to assist in financially supporting graduate students. Such support could come in the form of research fellowships or semester-long internships, which would grant students the opportunity to collaborate with researchers from the supporting organizations, allowing these organizations the opportunity to identify and recruit talent. An additional limiting factor in graduate students engaging in research at their desired level is that advisors may have limited time to dedicate to the research apprenticeship process. Depending on the individual intricacies of each graduate program, some faculty members may possess a large number of advisees, which would restrict their ability to deeply work with students on research. A potential solution to this issue is for graduate programs to develop formal mechanisms for advanced graduate students to mentor their more junior colleagues. This approach would allow for junior students to obtain research experience that could make them increasingly competitive when applying for summer internships. Regardless of the approach taken, training graduate students in research is a critical component to ensuring that the next generation of measurement specialists is prepared to handle the increasingly complexities being presented in the field.
5. Conclusion
Our findings suggest that it is safe to say the field of educational measurement is still struggling to identify and implement effective recruitment strategies for racially and ethnically minoritized students. Still, those students who do find their way into the field report – in general- positive experiences in their doctoral programs. In fact, 89% of students surveyed indicated the promises made to them pre-enrollment were kept post-enrollment. To be sure, strong mentoring relationships (of various kinds) and opportunities to engage in applied research rose to the top as important for doctoral student satisfaction. In this paper, we highlighted students’ experiences and shared their recommendations for improvement. It is our hope that findings from this study will help programs as they engage in conversations about how both to recruit and retain doctoral students from racially and ethnically minoritized populations.
Supplemental Material
Download Zip (52.1 KB)Disclosure statement
No potential conflict of interest was reported by the author(s).
Supplemental material
Supplemental data for this article can be accessed online at https://doi.org/10.1080/08957347.2023.2274565
Additional information
Funding
Notes
1 At the time of this writing, numerous programs across the country have dropped the GRE as an application requirement due to the financial and time resources that it necessitates as well as a perception that it does not accurately predict academic success (e.g., Moneta-Koehler et al., Citation2017; for a meta-analysis on the predictive validity of the GRE, see; Feldon et al., Citation2023). Although some have argued for keeping the GRE and supplementing it with additional information (e.g., conscientiousness ratings and vocational interests; Nye & Ryan, Citation2023), one positive outcome thought to potentially occur by anti-GRE proponents, is that it may increase the percentage of applications and admittances amongst typically underrepresented populations. At present, it is unclear whether this possibility will be reflected within educational measurement graduate programs across the short-term and long-term. Perhaps a study examining the intended and unintended consequences of GRE application requirements within our field would be a worthwhile future area of study.
References
- Alfred, M., Ray, S., & Johnson, M. (2019). Advancing women of color in STEM: An imperative for U.S. global competitiveness. Advances in Developing Human Resources, 21(1), 114–132. doi:10.1177/1523422318814551
- Barcan, R. (2014). Academic life and Labour in the new university: Hope and other choices. Surrey, England: Ashgate.
- Bottia, M., Mickelson, R., Jamil, C., Moniz, K., & Barry, L. (2021). Factors associated with college STEM participation of racially minoritized students: A synthesis of research. Review of Educational Research, 91(4), 614–648. doi:10.3102/00346543211012751
- Brennan, R. L. (2004). Revolutions and evolutions in current educational testing (CASMA Research Report #6). University of Iowa.
- Brennan, R. L., & Plake, B. S. (1990). Surveys of programs and employment in educational measurement. Educational Measurement Issues & Practice, 10(2), 32. doi:10.1111/j.1745-3992.1991.tb00194.x
- Burke, A., Okrent, A., & Hale, K. (2022). U.S. And Global STEM Education and Labor Force. National Science Foundation. Retrieved September 27, 2022 from https://ncses.nsf.gov/pubs/nsb20221/u-s-and-global-stem-education-and-labor-force
- Chaterjee, A., Grief, C., Witzburg, R., Passche-Orlow, K., Goodell, M., & Paasche-Orlow, M. K. (2020). US medical school applicant experiences on bias on the interview trail. Journal of Health Care for the Poor and Underserved, 31(1), 185–200. doi:10.1353/hpu.2020.0017
- Clance, P., & Imes, S. (1978). The Imposter phenomenon in high achieving women: Dynamics and therapeutic intervention. Psychotherapy: Theory, Research, Practice, Training, 15(3), 241–247. doi:10.1037/h0086006
- Creswell, J. (2012). Educational research: Planning, conducting, and evaluating quantitative and qualitative research (4th ed.). Pearson: Boston.
- Cross, T., Bazron, B., Dennis, K., & Isaacs, M. (1989). Towards a culturally competent system of care, volume I. Washington, DC: Georgetown University Child Development Center, CASSP Technical Assistance Center.
- Ensher, E., & Murphy, S. (2005). Power mentoring: How successful mentors and proteges get the most out of their relationships (1st ed.). San Francisco, CA: Jossey-Bass.
- Ercikan, K., & Solano-Flores, G. (2016). Assessment and sociocultural context: A bidirectional relationship. In G. Brown, & L. Harris (Eds.), Handbook of Human and Social Conditions in Assessment (1st ed., pp. 490–505). New York City: Routledge.
- Feldon, D. F., Litson, K., Cahoon, B., Feng, Z., Walker, A., & Tofel-Grehl, C. (2023). The predictive validity of the GRE across graduate outcomes: A meta-analysis of trends over time. The Journal of Higher Education, 1–29. doi:10.1080/00221546.2023.2187177
- Finney, S. J., & Pastor, D. A. (2012). Attracting students to the field of measurement. Educational Measurement Issues & Practice, 31(2), 2–7. doi:10.1111/j.1745-3992.2012.00228.x
- Goerisch, D. (2019). Doing less with less: Faculty care work in times of precarity. edited by Carson W. Byrd, Rachelle J. Brunn-Bevel, and Sarah Ovink, Intersectionality and higher education: Identity and inequality on college campuses (pp. 122–135). New Brunswick, NJ:Rutgers University Press.
- Goerisch, D., Basilliere, J., Rosener, A., McKee, K., Hunt, J., & Parker, T. (2019). Mentoring with: Reimagining mentoring across the university. Gender, Place, and Culture, 26(12), 1740–1758. doi:10.1080/0966369X.2019.1668752
- Kena, G., Hussar, W., McFarland, J., de Brey, C., Musu-Gillette, L. … Ossolinski, M. (2016). The condition of education 2016 (NCES 2016-144). U.S. Department of Education, National Center for Education Statistics. Washington, DC. Retrieved April 28, 2020 from http://nces.ed.gov/pubsearch.
- Kendrics, K., & Arment, A. (2011). Adopting a K-12 family model with undergraduate research to enhance STEM persistence and achievement in underrepresented minority students. Journal of College Science Teaching, 41(2), 22–27.
- Ko, L. T., Kachchaf, R. R., Hodari, A. K., & Ong, M. (2014). Agency of women of color in physics and astronomy: Strategies for persistence and success. Journal of Women and Minorities in Science and Engineering, 20(2), 171–195. doi:10.1615/JWomenMinorScienEng.2014008198
- Leventhal, B., & Thompson, K. (2021). Surveying the measurement profession to assist recruiting in the United States. Educational Measurement, 40(3), 83–95. doi:10.1111/emip.12431
- Moneta-Koehler, L., Brown, A. M., Petrie, K. A., Evans, B. J., Chalkley, R., & Amaral, L. A. N. (2017). The limitations of the GRE in predicting success in biomedical graduate school. PloS One, 12(1), e0166742. doi:10.1371/journal.pone.0166742
- National Science Foundation (2017). NSF scholarships in science, technology, engineering, and mathematics (S-STEM). Program solicitation, NSF 17-527. Retrieved March 30, 2022 from https://www.nsf.gov/pubs/2017/nsf17527/nsf17527.htmon
- Nestor-Baker, N., & Kerka, S. (2009). Recruitment and retention of underrepresented students in STEM fields. Columbus, OH: The Ohio State University. Retrieved March 24, 2022 from https://docsbay.net/recruitment-and-retention-of-underrepresented-students-in-stem-fields.
- Nye, C. D., & Ryan, A. M. (2023). Improving graduate-school admissions by expanding rather than eliminating predictors. Perspectives on Psychological Science, 18(1), 54–60. doi:10.1177/17456916221081873
- Packman, S., Camara, W. J., & Huff, K. (2010). A snapshot of industry and academic professional activities, compensation, and engagement in educational measurement. Educational Measurement Issues & Practice, 29(3), 15–24. doi:10.1111/j.1745-3992.2010.00180.x
- Patelis, T., Kolen, M. J., & Parshall, C. (1997). Surveys of programs and employment in educational measurement. Educational Measurement Issues & Practice, 16(3), 25–27. doi:10.1111/j.1745-3992.1997.tb00597.x
- Pierce, C. (1970). Offensive mechanisms. In F. B. Barbour (Ed.), The black seventies (pp. 265–282). Boston, MA: Porter Sargent.
- Pierce, C. M. (1974). Psychiatric problems of the Black minority. In S. Arieti (Ed.), American handbook of psychiatry (pp. 512–523). New York, NY: Basic Books.
- Randall, J. (2021). “Color-neutral” is not a thing: Redefining construct definition and representation through a justice-oriented critical antiracist lens. Educational Measurement Issues & Practice, 40(4), 82–90. doi:10.1111/emip.12429
- Randall, J., Rios, J., & Hung, J. (2021). Graduate training in educational measurement and psychometrics: A curriculum review of graduate programs in the U.S. Practical Assessment, Research, and Evaluation, 26(2), Available at. https://scholarworks.umass.edu/pare/vol26/iss1/2
- Randall, J., Rios, J., & Jung, H. (2021). A longitudinal analysis of doctoral graduate supply in the educational measurement field. Educational Measurement Issues & Practice, 40(1), 59–68. doi:10.1111/emip.12395
- Rios, J. A., Randall, J., & Donnelly, M. (2019). An analysis of college choice information provided on graduate program websites: Implications for improving applicant diversity in educational measurement. Educational Measurement Issues & Practice, 38(4), 67–77. doi:10.1111/emip.12284
- Sireci, S. G. (2000). Recruiting the next generation of measurement professionals. Educational Measurement Issues & Practice, 19(4), 5–9. doi:10.1111/j.1745-3992.2000.tb00040.x
- Sue, D. (2010). Microaggressions in everyday life: Race, gender, and sexual orientation. Hoboken, NJ: Wiley.
- Sweeder, R., Kursav, M., & Valles, S. (2021). A cohort scholarship program that reduces inequities in STEM retention. Journal of STEM Education, 22(1), 5–13.
- Tsui, L. (2007). Effective strategies to increase diversity in STEM fields: A review of the research literature. The Journal of Negro Education, 76(4), 555–581.
- Wilson, Z., Iyengar, S., Pang, S., Warner, I., & Luces, C. (2012). Increasing access for economically disadvantaged students: The NSF/CSEM & STEM programs at Louisiana State University. Journal of Science Education and Technology, 21(5), 581–587. doi:10.1007/s10956-011-9348-6