
 ?Mathematical formulae have been encoded as MathML and are displayed in this HTML version using MathJax in order to improve their display. Uncheck the box to turn MathJax off. This feature requires Javascript. Click on a formula to zoom.
ABSTRACT
We have developed a technique for neutron diffraction experiments at pressures up to 40 GPa using a Paris-Edinburgh press at the PLANET beamline in J-PARC. To increase the maximum accessible pressure, the diameter of the dimple for sample chamber at the top of the sintered diamond anvils is sequentially reduced from 4.0 mm to 1.0 mm. As a result, the maximum pressure increased and finally reached 40 GPa. By combining this technique with the beam optics which defines the gauge volume, diffraction patterns sufficient for full-structure refinements are obtainable at such pressures.
1. Introduction
Neutron diffraction is a powerful tool for determining the position of hydrogen atoms in crystals and magnetic structures. For its usefulness, neutron diffraction experiments are widely conducted all over the world. However, when compared to synchrotron x-ray diffraction, the attainable pressure is very limited mainly due to the restricted flux of the neutron source and the resulting necessity for the use of a large sample. Despite the difficulty, many scientists have tried to extend the maximum pressure limit by developing high pressure devices [Citation1,Citation2]. As a results, the high pressure studies up to 50 GPa have been conducted in early 2000s [Citation3]; however the studies were limited to experiments that observed only a few Bragg reflections. The recent emergence of intense-pulsed neutron sources such as SNS (Oak Ridge, U.S.A.) or J-PARC (Tokai, Japan) changed the situation. These facilities enable quick data acquisition owing to large neutron fluxes and the time-of-flight (ToF) method [Citation4]. These characteristics promote neutron diffraction experiments under high pressure conditions.
Among the presses invented thus far, the Paris-Edinburgh (PE) press and diamond anvil cell (DAC) have enabled neutron diffraction experiments above 10 GPa. The highest pressure for full-structure refinement that has been published to date using these two devices is 26 GPa [Citation5] and 52 GPa [Citation6], respectively. As exemplified in this comparison, the DAC is a promising device for extending the pressure limit of neutron diffraction experiments. However, data taken with DACs are less accurate than that taken with a PE press for two reasons: the sample volume is very small (10−2–10−4 mm3), making it very difficult to achieve a low signal-to-noise ratio [Citation7]; and the precise correction of the diffraction intensity is difficult due to the ‘diamond dip’ (i.e. the loss of the incident neutron beam at a certain wavelength by the Bragg reflection of a single-crystal diamond) [Citation8]. Actually we are also trying to establish the structure analysis using a DAC, but the error of the corrected intensity is beyond 20%. On the other hand, these shortcomings can be avoided in the case of a PE press equipped with polycrystalline diamond anvils because it has relatively large sample volume (typically 25–50 mm3), and the diamond grains of the anvil are randomly oriented.
In this study, we report our experimental results on attempting to extend the high pressure limit of neutron diffraction with a PE press by reducing the diameter of the dimple for sample chamber at the anvil top. To conduct these experiments, we prepared a series of anvils with different dimple diameters (DDs) and compared their performance in terms of pressure generation, data quality, and the applicability of the obtained data to Rietveld analysis.
2. Experimental
To generate pressure, we used a PE press (MG63 VX4 [Citation9]) equipped with double toroidal anvils made of sintered diamond (COMPAX 5913) and tapered backing seats. The load applied to the anvils was regulated with an automated volumetric pump (Sanchez technologies, S16/DC30000). To reveal the dependence of the dimple diameter on pressure generation, we prepared a series of anvils with DD = 1.0, 1.5, 2.0, 2.5, 3.0, 4.0 mm. The profile of each anvil is shown in , together with the available sample volume. Here the profile of the anvil with DD = 4.0 mm is identical to that displayed in [Citation10]. In designing the shape of the dimple with different diameters, its depth relative to the diameter is reduced as the dimple diameter decreases, taking into account the saturation of the pressure generation caused by the dead volume for the dimple.
Figure 1. Profiles of anvils with different dimple diameters (DDs). Vs denotes the available volumes of the sample in the pair of encapsulating gaskets when using each anvil.
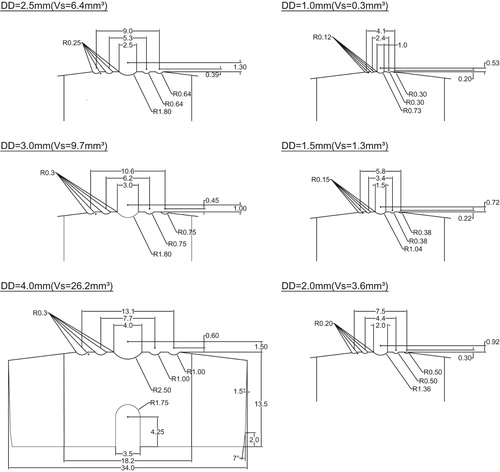
We used several pressure markers, such as MgO, NaCl, YbD2, to determine the pressure. The pressure was calculated based on the equation of state (EOS) for each marker [Citation11–13]. In the experiments, a powder sample was loaded in a pair of TiZr encapsulating gaskets, together with a pressure transmitting medium of 4:1 mixture of deuterated methanol and ethanol. The wall at the hemisphere part of the encapsulating gasket was machined as thin as possible (e.g. 0.1 mm for anvils with DD < 2.0 mm) to increase the sample volume. When loading the sample, lateral screws which fix the anvil to the breech were loosened just before sealing the sample so that an anvil is self-aligned to the center of the other anvil. This procedure is especially important when using the anvils with a small dimple diameter.
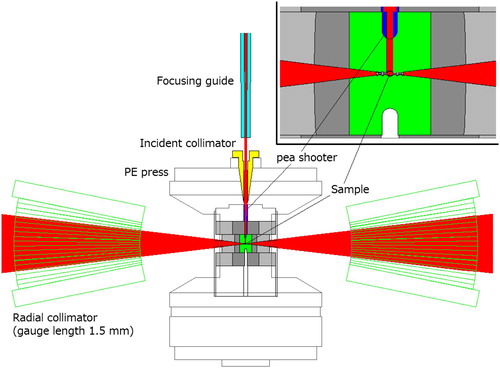
In-situ neutron diffraction experiments were conducted at the high pressure beamline PLANET [Citation14], in Materials and Life Science Experimental Facility (MLF) at J-PARC. The diffraction geometry is shown in . The focusing guide, consisting of 1.0-m-long parabolic supermirrors with critical angles of 4.0Qc (Qc is the critical momentum transfer for Ni), was used to increase flux at the sample position. Unnecessary neutrons, which contribute to background intensity, was removed with a hBN-collimator attached to the breech of the PE press and with hBN tubes (‘pea shooters’) of decreasing inner diameters inserted in the center holes on the backing seats and backside of the anvils. The typical size of the neutron beam introduced to the sample was 1.5 mm in diameter for the anvils with DD = 1.5 mm. To reduce the background, radial collimators with a gauge length of 1.5 mm [Citation14] were installed. By employing this setup, we can effectively isolate the signal from the region of φ1.5 mm × 1.5 mm at the sample position.
Figure 2. Diffraction geometry in the experiments using a PE press at PLANET.
In the data analysis, merging neutron event data and correcting diffraction intensity were conducted using our developing software ‘Tschuess’, which is based on the MLF standard data reduction software ‘UTSUSEMI’ [Citation15]. The Rietveld refinement was conducted using EXPGUI/GSAS software [Citation16,Citation17].
3. Results and discussion
3.1. Performance in pressure generation
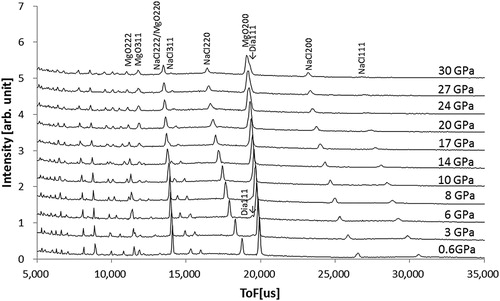
illustrates typical diffraction patterns collected for the mixture of NaCl and MgO powder using the anvils with DD = 2.5 mm. The exposure time was approximately 20 min per each pattern when the proton accelerator was operated at the beam power of 500 kW. Owing to the afore mentioned beam collimation, distinct patterns with almost no contaminant peaks from the anvils were obtained. The pressure-load relation was obtained by determining the pressure from the known equation of state at each load. We first investigated sample dependence on pressure generation using several samples, such as NaCl, AlOOD, AlOOH, Al containing hydrous Bridgmanite, and found that the difference of the generated pressures at each load was within 10% regardless of the sample.
Figure 3. Typical diffraction patterns obtained for a mixture of NaCl and MgO powder using the anvils with DD = 2.5 mm. The intensity is not corrected by the data for a vanadium rod and empty gaskets. The exposure time was about 20 min for each pattern when the proton accelerator was operated at the beam power of 500 kW.
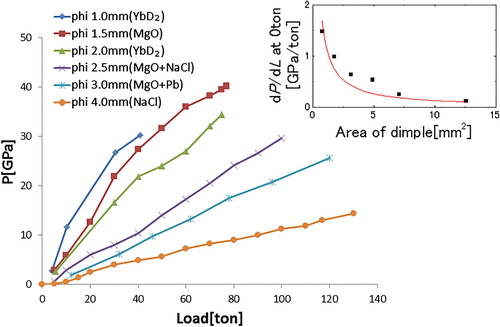
summarizes the pressure-load relation for the anvils with different dimple diameters. The efficiency of the pressure generation was found to increase as the dimple diameter decreases, although it sometimes drops at the pressure where the sample transforms into a high pressure phase (e.g. the change in the slope at 40 tons for anvils with DD = 2.0 mm). To more clearly illustrate this relationship, the initial slope of the pressure-generation curves are compared in the inset of . As expected, the efficiency is almost inversely proportional to the area of the dimple. By applying a higher load, the efficiency degraded, regardless of dimple diameter, and seems reach saturation at 40 and 80 tons for anvils with DD = 1.0 and 1.5 mm, respectively. Despite the saturation, the attainable pressure increases with decreasing the dimple diameter, except for the anvil with DD = 1.0 mm. Finally we succeeded in generating 40 GPa by using anvils with DD = 1.5 mm. After the release of pressure, one of the anvils was slightly damaged; hence anvils that experience such high pressure may not be able to withstand repeated use.
Figure 4. Pressure-load relations when using anvils with different dimple diameters (DDs). (Inset) Comparison of the initial slope of the pressure generation curves against the area of the dimple.
3.2. Quality of the diffraction data
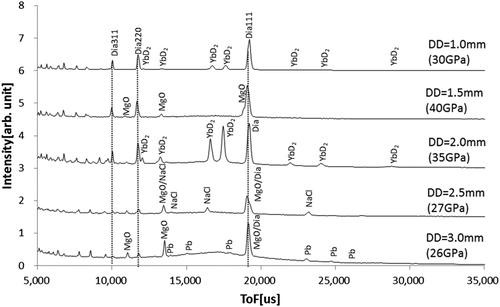
compares the diffraction patterns obtained at the highest pressure in each experiment using anvils with various dimple diameters. All the diffraction patterns were calculated with the same binning condition, Δt = 40 μs in ToF, after normalization by the number of neutrons introduced to the beamline and detector region, etc. Therefore, the intensities can be properly compared with each other. In all the patterns, only peaks from sample and diamond were observed. The diamond peaks are negligibly small when the anvils with DD = 3.0 and 2.5 mm are used (the diamond 111 and MgO 200 peaks overlap, thus the diamond 220 or 311 peaks are a good measure to estimate the degree of contamination). However, the diamond peaks became prominent as the dimple diameter decreased. This observation is consistent with the performance of the radial collimators with a 1.5-mm gauge length: the initial distance between the anvils along the center axis of the sample are 2.8, 2.0, 1.7, 1.2 and 0.8 mm for the anvils with DD = 3.0, 2.5, 2.0, 1.5 and 1.0 mm, respectively. Therefore, the contamination of the diamond peaks in the diffraction pattern is unavoidable when using the anvils with DD < 2.0 mm.
Figure 5. Diffraction patterns at the highest pressure in each test using anvils with various dimple diameters (DDs). All the diffraction patterns were calculated with the same binning condition (Δt = 40 μs in ToF) after normalization by the number of neutrons introduced to the beamline and detector region. The intensity is not corrected by the data for a vanadium rod and empty gaskets. Dotted lines represent the positions expected for 111, 220, 311 diamond peaks.
3.3. Rietveld analysis
In spite of the diamond peak contamination, the quality of the data is considered to be sufficient for structural analysis. To confirm this, a Rietveld analysis was carried out on the data after intensity correction. The scattering cross section of the sample (i.e. an input for the Rietveld analysis), was obtained as follows.
The intensity measured for a sample, a vanadium pellet, and an empty gasket in a PE press under high pressure condition is expressed by:
Here the Φ represents the wavelength profile of the incident beam, η is the detector efficiency, Ω is the solid angle for the detector, and N is the number of atoms. The
and
represent the coherent and incoherent scattering cross section, respectively. The A is the absorption factor. The suffixes of S, V, and C represent the sample, vanadium and PE cell (i.e. anvils and gasket), respectively. From the three equations, one can obtain the scattering cross section for the sample by:
In this derivation, AC which is difficult to determine experimentally is cancels out in the numerator and denominator; thus, we don't need to treat it explicitly as long as it is common both in the measurements for the sample and the vanadium pellet. To ensure this condition, the intensity for a vanadium pellet was collected at high pressures under which the sample data was collected. The intensity of an empty cell was collected via the gasket, which was made by compressing a NaCl pellet in the gasket and then washing out the NaCl following the pressure release. AV is numerically calculated, taking the shape of the vanadium pellet into account.
was treated as a scale factor in the Rietveld analysis. The data obtained for a vanadium pellet and an empty gasket were reduced with the same binning condition as that used in the reduction of the sample data, then diamond and vanadium peaks were eliminated.
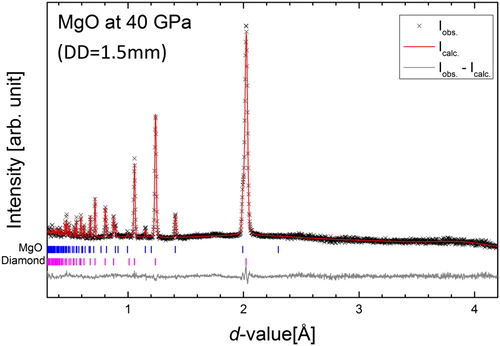
shows the result of the Rietveld analysis for the data taken at 40 GPa with the anvils with DD = 1.5 mm (binning condition is Δt = 20 μs in ToF). In the analysis, the scale factor, background functions, lattice parameters of MgO and diamond, fraction of each phase, and peak profile functions were refined, while isotopic displacement parameters were fixed at ambient condition values. The refinements successfully converged to Rwp = 8.20% and Rp = 7.89%, and the obtained lattice parameters are 3.9868(3)Å and 3.5022(1) Å for MgO and diamond, respectively. Analyses of the data taken using anvils with different dimple diameters will be presented in other works [Citation18].
Figure 6. Results of Rietveld fitting for the data of MgO at 40 GPa. The data was taken using the anvils with DD = 1.5 mm. The exposure time was 71 min when the proton accelerator was operated at the beam power of 500 kW.
3.4. Current problems and future developments
To further increase the attainable pressure and data quality, the following developments may be explored. In this study, the maximum pressure was extended by reducing the dimple diameter. Although the generation of the highest pressure was expected for the anvils with DD = 1.0 mm, the pressure generation saturated at relatively small load, resulting in a lower pressure value for the anvils with DD = 1.0 mm compared to that for DD = 1.5 mm. By optimizing the shape of the anvils and gaskets for anvils with DD = 1.0 mm, pressures higher than 40 GPa may be generated.
In terms of the quality of the obtained data, large diamond peaks were observed when we used the anvils with DD < 2.0 mm. This contamination is caused by an insufficient ability to select the field of view using the radial collimators. The use of the collimators with a smaller gauge volume can reduce the intensity of the diamond peaks, which will then increase the reliability of the refined structure.
In this study, we have collected data at 40 GPa. However, this pressure is far beyond the hydrostatic limit for the pressure-transmitting medium, a 4:1 methanol – ethanol mixture. As a result, the Bragg peaks broadened above 10 GPa, making it difficult to observe small Bragg peaks as well as precisely determine the intensities of adjacent peaks. Hence, the use of the pressure-transmitting medium with a higher freezing pressure and the development of techniques for loading the medium into the gaskets [Citation10] are urgently required.
4. Conclusion
In order to increase the maximum attainable pressure where full structure refinements are possible by neutron diffraction, we have developed a diffraction technique using a PE press equipped with double-toroidal anvils made of sintered diamond. By reducing the diameter of the dimple at the top of the anvils, we have increased the efficiency of pressure generation to reach 40 GPa using the anvils with DD = 1.5 mm. By coupling with beam optics that defines the gauge volume, full structure refinements at 40 GPa becomes possible at PLANET. This will open the way to analyze phenomena related to hydrogen or light elements which have not been accessed so far.
Acknowledgements
The authors are grateful to Drs S. Klotz and K. Komatsu for useful advice on handling the PE press and designing the anvils and gaskets. The experiment was conducted under the MLF proposals 2015I0011, 2016I0011, 2017I0011, 2018I0011.
Disclosure statement
No potential conflict of interest was reported by the authors.
References
- Besedin SP, Makarenko IN, Stishov SM, et al. Diamond anvil cells for neutron diffraction. High Press Res. 1995;14:193–197. doi: 10.1080/08957959508200918
- Besson JM, Nelmes RJ, Hamel G, et al. Neutron powder diffraction above 10 GPa. Physica B Condens Matter. 1992;180–181:907–910. doi: 10.1016/0921-4526(92)90505-M
- Goncharenko IN. Neutron diffraction experiments in diamond and sapphire anvil cells. High Press Res. 2004;24:193–204. doi: 10.1080/08957950410001661882
- Windsor CG. Pulsed neutron scattering. London: Taylor and Francis; 1981.
- Klotz S, Besson JM, Hamel G, et al. Neutron powder diffraction at pressures beyond 25 GPa. Appl Phys Lett. 1995;66:1735–1737. doi: 10.1063/1.113350
- Guthrie M, Boehler R, Tulk CA, et al. Neutron diffraction observations of interstitial protons in dense ice. Proc Natl Acad Sci U S A. 2013;110:10552–10556. doi: 10.1073/pnas.1309277110
- Klotz S, Bull CL, Ridley CJ, et al. On intensities in high pressure neutron powder diffraction using single and polycrystalline diamond anvils: small versus large sample volumes. High Press Res. 2019;39:185–189. doi: 10.1080/08957959.2019.1579806
- Guthrie M, Pruteanu CG, Donnelly ME, et al. Radiation attenuation by single-crystal diamond windows. J Appl Cryst. 2017;50:76–86. doi: 10.1107/S1600576716018185
- Klotz S, Hamel G, Frelat J. A new type of compact large-capacity press for neutron and x-ray scattering. High Press Res. 2004;24:219–223. doi: 10.1080/08957950410001661963
- Klotz S. Techniques in high pressure neutron scattering. Boca Raton (FL): CRC Press/Taylor and Francis; 2013.
- Jackson I. Elasticity, composition and temperature of the Earth’s lower mantle: a reappraisal. Geophys J Int. 1998;134:291–311. doi: 10.1046/j.1365-246x.1998.00560.x
- Jamieson JC, Fritz JN, Manghnani MH. Pressure measurement at high temperature in x-ray diffraction studies: gold as a primary standard. In: Akimoto S, Manghnani MH, editors. High pressure research in geophysics. Tokyo: Center for Academic Publications; 1982. p. 27–47.
- Olsen JS, Steenstrup S, Gerward L. High pressure studies of YbH2 and YbD2. In: Trzeciakowski WA, editor. Proceedings of the XVth AIRAPT & XXXIII EHPRG Conf.; 1982; Warsaw, Poland. p. 549–551.
- Hattori T, Sano-Furukawa A, Arima H, et al. Design and performance of high-pressure PLANET beamline at pulsed neutron source at J-PARC. Nucl Instrum Methods Phys Res A. 2015;780:55–67. doi: 10.1016/j.nima.2015.01.059
- Inamura Y, Nakatani T, Suzuki J, et al. Development status of software “utsusemi” for chopper spectrometers at MLF, J-PARC. J Phys Soc Jpn. 2013;82:SA031. doi: 10.7566/JPSJS.82SA.SA031
- Larson AC, Von Dreele RB. General Structure Analysis System (GSAS), Los Alamos National Laboratory Report LAUR. 2004; p. 86–748.
- Toby BH. EXPGUI, a graphical user interface for GSAS. J Appl Crystallogr. 2001;34:210–213. doi: 10.1107/S0021889801002242
- Klotz S, Casula M, Komatsu K. High-pressure structure and electronic properties of YbD2 to 34 GPa. (Submitted). 2019.