
ABSTRACT
To understand the practical effects of pressure-transmitting media (PTM) on neutron diffraction using Paris–Edinburgh presses, diffraction patterns of MgO were collected to approximately 20 GPa using PTMs of Pb, AgCl, 4:1 methanol–ethanol (ME) mixture with and without heating, N2, and Ar. Hydrostaticity in the sample chamber estimated from the MgO 220 peak width improves in the order of Pb, AgCl, Ar, ME mixture, N2, and the heated ME mixture. Unlike previous results using diamond anvil cells, the unheated ME mixture is superior to Ar even after freezing, probably due to the cup on the anvil face. Considering these results and the sizable coherent scattering of Ne, which would show good hydrostaticity, we conclude that the ME mixture (preferably the heated one) is the best PTM in neutron experiments up to 20 GPa, while Ar can be substituted when a sample is reactive to alcohols.
1. Introduction
Recent advances in high pressure techniques [Citation1–4] and neutron sources made it possible to conduct full structure analysis by neutron diffraction at pressures far beyond 10 GPa (e.g. [Citation5,Citation6]). As the attainable pressure increases, hydrostaticity in the sample chamber becomes a crucial issue for the precise determination of crystal structures. Historically, synchrotron X-ray diffraction encountered the same problem, and many kinds of pressure-transmitting media (PTM) were tested [Citation7–9]. Currently, fluid He, which shows excellent hydrostaticity, is routinely used as a PTM in synchrotron X-ray diffraction using diamond anvil cells (DACs). On the other hand, the search for the better PTM is still continuing in the neutron diffraction studies. Such experiments require large sample volume to compensate for the limited neutron beam flux. A widely used high pressure apparatus which makes it possible is Paris–Edinburgh (PE) presses [Citation1,Citation10], in which a sample is compressed with a pair of anvils that have a cup on the anvil face to increase the sample volume. With such a setup, the maximum attainable compression volume ratio is limited only to V/Vinitial ∼0.2–0.3 due to incompressible space caused by this cup; accordingly, the pressure saturates upon increasing load when the volume of the sample–PTM mixture reaches this value. This effect is considerable when a highly compressible PTM is used, and practically, the attainable pressure is limited to 1–4 GPa for fluid He [Citation11]. To overcome this problem, a better PTM, which is soft but incompressible, has been searched [Citation12–15], but the hydrostatic limits for such PTMs are too low compared with the pressure range currently used for neutron experiments.
Consequently, using a frozen PTM at high pressures cannot be avoided; thus, knowledge on non-hydrostaticity above the hydrostatic limits is important for practical use. Previous studies showed that non-hydrostaticity for most PTMs steeply increase after freezing, whereas liquid noble gases show superior performance even after freezing [Citation12,Citation15]. Most of these results are based on the positions or widths of the fluorescent lines of ruby pressure markers compressed with a DAC or the pressure distribution in the sample chamber of a DAC. Therefore, the results cannot be directly applied to estimate non-hydrostaticity in the sample chamber compressed with a PE press due to the differences in the hardness between sample and ruby chips and in the compression geometry between a DAC and a PE press. Namely, a ruby (corundum) is very hard (K0 = 254–255 GPa and G0 = 163–165 GPa [Citation16,Citation17]) and, accordingly, less sensitive to stress in the grains of the sample [Citation18,Citation19]. Moreover, non-hydrostaticity may be different because the sample in a DAC is uniaxially compressed with the flat faces, whereas that in a PE press is more concentrically compressed with cupped anvils [Citation20].
To select the best PTM in the neutron experiments, knowledge on non-hydrostaticity which the sample practically experiences by compression with cup anvils is indispensable. Therefore, we have conducted neutron experiments on MgO powder that has moderate compressibility and shear modulus (K0 = 162–163 GPa and G0 = 131 GPa [Citation21–23]) to approximately 20 GPa with solid media (Pb, AgCl), liquefied gas (N2, Ar), and alcohol mixture (4:1 deuterated methanol–ethanol (ME) mixture at room temperature and 100°C), which are known to show relatively good hydrostaticity [Citation11], and evaluated the non-hydrostaticity for each PTM from the width of a Bragg peak of MgO. For practical use in neutron diffraction experiments, we have also investigated the effects of these PTMs on the pressure-generation efficiency and the contamination in diffraction patterns. Finally, we discuss the effect of the geometry of the sample chamber on the non-hydrostaticity by comparison with previous results obtained with a DAC.
2. Experimental
In-situ neutron diffraction experiments were conducted at the high pressure neutron beamline PLANET [Citation24] at the Materials and Life Science Experimental Facility (MLF) in J-PARC; experimental details are described in Hattori et al. [Citation3]. The sample was compressed with a PE press (MG63 VX4) equipped with double toroidal anvils made of sintered diamond (COMPAX5913) with a cup diameter of 3.0 mm. The load applied to the anvils was regulated with an automated volumetric pump (Sanchez technologies, S16/DC3000).
A prototypical oxide, MgO, was selected as a sample due to the simple crystal structure (rock salt structure), the lack of any phase transition in the pressure range of this study, and its moderate compressibility and shear modulus (K0 = 162–163 GPa and G0 = 131 GPa [Citation21–23]). We tested PTMs of solid media (Pb and AgCl), liquefied gas (N2 and Ar), and liquid media (4:1 deuterated ME mixture at room temperature and 100°C).
Fresh Pb powder made by filing a lead block in a glove box was mixed with MgO powder in equivolume ratio and then pelleted into a spheroid using a mold and a hand press. The AgCl powder (Soekawa) softly mixed with MgO in a darkened room to avoid photodegradation was pelleted by the same ways as mentioned above. These samples were placed in a TiZr gasket and compressed. Liquid N2 was cryogenically loaded in a pair of encapsulating gaskets made of an SUS304 stainless steel using a loading clamp [Citation11] (see Supplemental Materials); stainless steel gaskets were used instead of TiZr gasket to save cost. Liquid Ar was cryogenically loaded in TiZr encapsulating gaskets by two different methods as we suspected that loading failed in the first run, where we employed the same method as that employed for liquid N2. In the second run, liquid Ar was loaded as described in Klotz et al. [Citation25]. The latter was found to be superior because the degree of filling can be estimated by monitoring gas pressure while intermittently supplying the gas from the chamber isolated from the sample chamber. The 4:1 deuterated ME mixture was sealed in TiZr encapsulating gaskets by pouring droplets into the gaskets filled with MgO powder. In another run using the ME mixture, the sample was compressed while heating the PTM above its melting temperature [Citation13] so that the sample was not compressed with a solidified ME (see Supplemental Materials). In this run, the compression below and above 6.9 GPa were conducted at room temperature and high temperature, respectively. During the compression from c.a.17 GPa to 18.3 GPa, we could not avoid the freezing of ME mixture due to the limitation of maximum temperature attainable by our heating system (100°C). All the diffraction data using any PTMs were collected at room temperature: in the runs using a heated ME mixture, the diffraction patters were collected after cooling back to room temperature, following to the compression during heating. Typical time required for increasing and decreasing temperature were 20 and 60 min, respectively.
In all the experiments, samples were compressed at the rate of 1 tonne/min, and diffraction data at each pressure were collected after maximizing the intensity from the sample by scanning the sample position along the orthogonal three axes of the laboratory frame. Typical exposure time was 1 h per pattern. The pressure was calculated from the lattice parameter of MgO based on the known equation of state [Citation26]. Hydrostaticity was evaluated from the peak width of MgO determined by fitting with a Gaussian function. Here, the 220 peak was selected because it rarely overlapped with Bragg peaks of the PTMs used.
3. Results
3.1. Solid pressure media
3.1.1. Pb
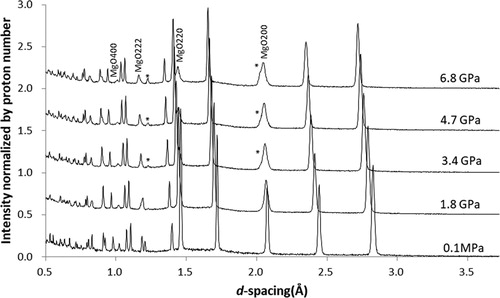
shows diffraction patterns obtained with Pb PTM. Intensity is normalized by the number of protons during the exposure, enabling a comparison of all intensities among –. The diffraction patterns show that Bragg peaks of MgO are significantly broadened from the beginning of compression, whereas those of Pb remain relatively sharp. The Pb peaks are very strong compared with the sample (MgO), as expected from its large neutron scattering length. The pressure calculated from the lattice parameters of Pb based on known EOS [Citation27] agreed with those calculated from MgO, suggesting no difference in the stress between the sample and PTM. In this run, a blowout unexpectedly occurred at a relatively low pressure due to the excess amount of sample (and Pb) initially loaded in the sample chamber.
Figure 1. Diffraction patterns obtained with Pb PTM. The star indicates reflections from anvils (i.e. diamond). All the reflections with no indications in the region above 1 Å are from Pb. Each pattern was shifted vertically by 0.5 for clarity.
3.1.2. AgCl
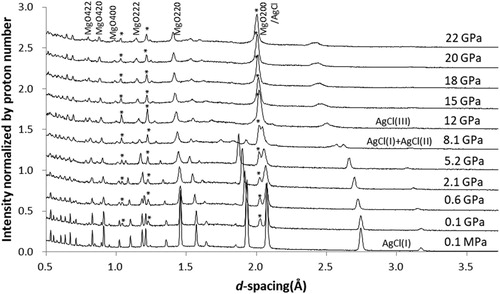
shows diffraction patterns obtained with AgCl PTM. Bragg peaks of MgO become broader from the beginning of compression. The intensity of AgCl peaks is higher than that of MgO peaks. As the pressure increased, AgCl transformed to AgCl II at 8.1 GPa and to AgCl III around 12 GPa in agreement with previous studies [Citation28].
Figure 2. Diffraction patterns obtained with AgCl PTM. The star indicates reflections from anvils. All the reflections with no indications in the region above 1 Å are from AgCl. Each pattern was shifted vertically by 0.3 for clarity.
3.2. Liquid pressure medium
3.2.1. 4:1 Methanol–ethanol mixture without heating
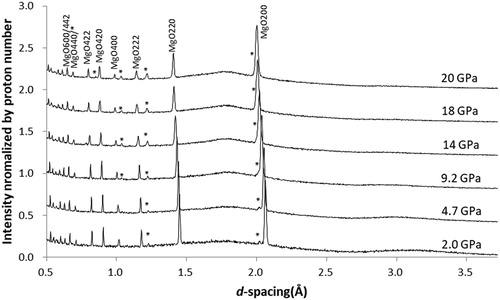
shows diffraction patterns obtained with 4:1 ME mixture without heating. Bragg peaks of MgO are slightly broadened above 10 GPa where the PTM freezes; however, they remain relatively sharp to approximately 20 GPa. Bragg peaks from the PTM are not observed, while humps originating from the coherent scattering of the ME mixture are observed at approximately 3.2 Å (It originates from the first peak of S(Q) of the ME mixture, and the hump around 1.8 Å are from the energy profiles of the incident neutron beam). This feature remains after freezing due to the transformation of the ME mixture into a glassy state rather than the crystalline state.
Figure 3. Diffraction patterns obtained with 4:1 ME mixture without heating. The star indicates reflections from anvils. Each pattern was shifted vertically by 0.4 for clarity.
3.2.2. 4:1 Methanol–ethanol mixture with heating
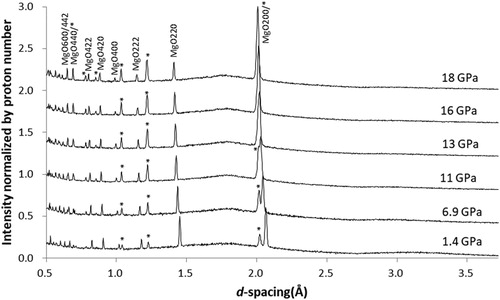
shows diffraction patterns obtained with 4:1 ME mixture heated above its melting temperature during compression (The ME mixture froze during the compression from 16 to 18 GPa). Bragg peaks of MgO are sharp over the entire pressure range. Other features are basically the same as those observed with the 4:1 ME mixture without heating.
Figure 4. Diffraction patterns obtained with heated 4:1 ME mixture. The star indicates reflections from anvils. Each pattern was shifted vertically by 0.4 for clarity.
3.3. Liquefied Gas pressure media
3.3.1. N2
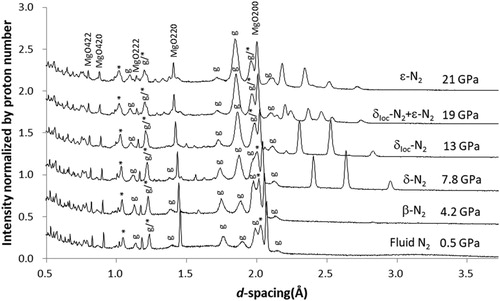
shows diffraction profiles obtained with N2 PTM. Bragg peaks of MgO are sharp over the entire pressure range studied. Reflecting large coherent scattering length for nitrogen (bc = 9.36 fm), Bragg peaks from solid nitrogen are significant, along with those from γ, α’, ε-phases of stainless steel gaskets. As the pressure increases, fluid N2 is solidified to β-N2 and then transforms into δ-, δloc-, and ε-phases, in agreement with previous studies (the transition pressures are 2.5 [Citation29], 4.9, 11, and 16.5 GPa, respectively [Citation30]).
Figure 5. Diffraction patterns obtained with N2 PTM. The star indicates reflections from anvils. The ‘g’ indicates reflections from the stainless steel gaskets. Reflections with no indications in the region above 1 Å are from N2. Each pattern was shifted vertically by 0.4 for clarity.
3.3.2. Ar
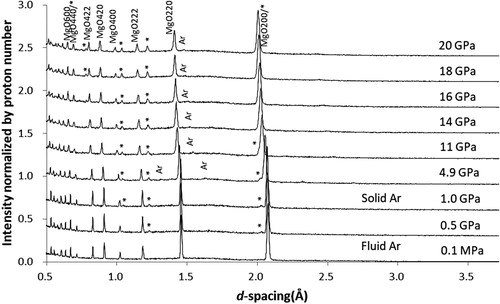
shows diffraction patterns obtained with fluid Ar PTM in the second run (here, only the profiles in the second run are shown because those in the first run are basically the same). Bragg peaks of MgO are slightly broadened above 10 GPa. At 4.9 GPa, small Bragg peaks of Ar were observed in agreement with the solidification pressure of 1.4 GPa [Citation31]. Their intensities are sufficiently weak, reflecting the small coherent scattering length of Ar (bc = 1.909 fm). The pressures calculated from the lattice constant of crystalline Ar using the known EOS [Citation32] agreed with those determined from MgO within the experimental uncertainty.
Figure 6. Diffraction patterns obtained with Ar PTM in the second run. The star indicates reflections from anvils. The ‘Ar’ indicates reflections from the crystalline Ar. Each pattern was shifted vertically by 0.3 for clarity.
4. Discussion
4.1. Pressure-generation efficiency
To understand the effect of PTM compressibility on the pressure-generation efficiency, the load–pressure curves for all experimental runs using different PTMs are compared in . As a whole, these show similar features, except for the first run for Ar. The deviation of the curve for this run is an artifact; in this run, the load clamp frame was stuck between the piston and breech of the PE cell, and the load was not fully applied to the anvils above 50 tonnes. In the curve for AgCl PTM, the kink was observed at 80 tonnes, which is attributed to the failure of part of the gasket during the compression due to the excess amount of the sample initially loaded in the gasket.
Figure 7. Load–pressure curves in the experiments using different PTMs. The pressure points above 50 tonnes for the first run using Ar are not reliable because the load was not fully applied to the anvils. The kink of the curve for AgCl at 80 tonnes is attributed to the failure of part of the gasket during the compression.
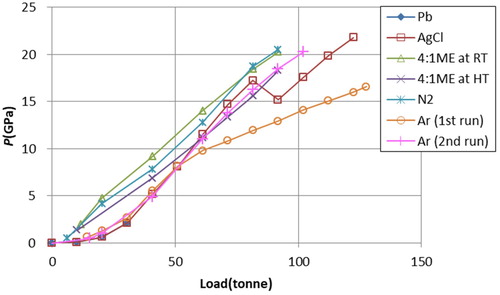
When the curves are compared in more detailed, a marked difference is seen between solid and liquid/fluid PTMs except for Ar, at the begin of the compression. This is due to the difference in the packing ratio of the sample and PTM in the sample chamber when the sample and PTM are initially loaded: the ratio is close to 100% when using liquid/fluid media because the powder sample is immersed with the liquids/fluids, whereas this is not possible with solid media. This causes poor pressure-generation efficiency in solid PTMs initially, but the curves merge together after the void in the sample chamber is totally compressed. Poor pressure-generation efficiency for Ar is not understood, but it may be related to the large compressibility of fluid Ar at the begin of the compression. These results suggest that the compressibility of the PTMs does not significantly affect the pressure-generation efficiency in the pressure range of this study.
4.2. Non-hydrostaticity in the sample chamber
The non-hydrostaticity among the PTMs are compared using the pressure dependence of the full width of half maximum (FWHM, Δd) of the MgO 220 peak for all PTMs in (upper plot). Here, the peak width divided by d-spacing (Δd/d) is used for evaluation, taking the d-spacing dependent instrumental peak broadening into account: The peaks become broader at a larger d-spacing in time of flight neutron diffraction and the instrumental contribution to the peak width is nearly constant in Δd/d, regardless of d-spacing (Δd/d = 0.6% for the PLANET beamline). The figure shows that the Δd/d value for Pb significantly increases from the beginning of compression. The Δd/d for AgCl also increases but is saturated around 12 GPa and then decreases. This would originate from the release of the internal strain due to the phase transition into the high pressure phases or yielding of AgCl. The Δd/d for 4:1 ME mixture at room temperature is nearly identical as that of instrumental broadening (i.e. no broadening due to the sample strain) at pressures of up to 10 GPa and then gradually increases after freezing. The use of the heated 4:1 ME mixture extends the hydrostatic limit to nearly 17 GPa, in agreement with Ref. [Citation13]. The Δd/d for fluid N2, which may be slightly enlarged due to overlapping with a peak from the stainless steel gasket, remained small at pressures of up to 19 GPa but suddenly increased at 21 GPa. Surprisingly, the hydrostaticity remains good at pressures far beyond the freezing pressure of 2.5 GPa [Citation29], as mentioned by LeSar et al. [Citation33]. This would originate from the relatively small yield strength of solid N2, which restricts maximum strain in the sample chamber [Citation19]. The Δd/d for fluid Ar showed the same trend in the two runs: The Δd/d continually increases from the beginning of the compression and after the fluid Ar freezes.
Figure 8. (Upper) Pressure dependence of the Δd/d for MgO 220 peak with different PTMs. The dotted lines represent those during decompression. (Lower) Pressure dependence of standard deviation of pressures determined for different ruby spheres in a DAC, redrawn from the data in previous studies [Citation12,Citation13] (Courtesy of S. Klotz). The inset of the upper plot gives freezing pressures cited in [Citation12,Citation13,Citation29,Citation31] for ME at room temperature and 100°C, and N2 and Ar, respectively.
![Figure 8. (Upper) Pressure dependence of the Δd/d for MgO 220 peak with different PTMs. The dotted lines represent those during decompression. (Lower) Pressure dependence of standard deviation of pressures determined for different ruby spheres in a DAC, redrawn from the data in previous studies [Citation12,Citation13] (Courtesy of S. Klotz). The inset of the upper plot gives freezing pressures cited in [Citation12,Citation13,Citation29,Citation31] for ME at room temperature and 100°C, and N2 and Ar, respectively.](/cms/asset/3075d444-25af-45be-941e-91f9224005dc/ghpr_a_1782899_f0008_oc.jpg)
We measured the pressure dependence of FWHM during decompression in the runs for AgCl and Ar, shown by the dotted line (, upper plot). Decreasing from maximum pressure results in the Δd/d for fluid Ar revert to values seen in the compression, suggesting that peak broadening originates in the elastic strain of the crystallite and/or that the pressure gradient in the sample chamber is smoothly redistributed during decompression. On the other hand, the Δd/d for AgCl lacks this behavior, suggesting that compression with AgCl introduces plastic strain in the sample grains or that the pressure gradient in the sample chamber is not redistributed unless the pressure is released almost completely. In the both cases, we cannot ascertain whether peak broadening is caused by strain of the crystallite or pressure distribution in the sample chamber because of difficulty in obtaining diffraction patterns at each position in the sample chamber. The investigation of pressure distribution by synchrotron x-ray diffraction [Citation34] or ruby fluorescence method using a press with optical access [Citation35] will reveal it.
4.3. Comparison of non-hydrostaticity in the sample chamber compressed with DAC and PE press
To reveal the effect of the profile of the anvil surface on non-hydrostaticity in the sample chamber, the results here are compared with those investigated with DACs. The lower plot of shows the pressure dependence of the pressure distribution in the sample chamber compressed with various PTMs by DACs [Citation12,Citation13]. This comparison shows the same features in the increase of non-hydrostaticity for the 4:1 ME mixture from 10 GPa, the extension of the hydrostatic limit up to 17 GPa with the heated 4:1 ME mixture, the good hydrostaticity for N2 up to 18 GPa, and the continuous increase in the non-hydrostaticity for Ar from the beginning of compression. However, there are marked differences in the relative amount of non-hydrostaticity between the 4:1 ME mixture and Ar: Hydrostaticity for the ME mixture is better than that for Ar in our study using a PE press, whereas the opposite relationship is reported in the study using DACs. The relationship of non-hydrostaticity among the heated 4:1 ME mixture, N2, and Ar are common in both studies; therefore, this can be interpreted as a suppression of the steep increase in the non-hydrostaticity for the ME mixture above 10 GPa in our study. This may be attributed to the difference in the shape of the sample chamber between PE presses and DACs. Namely, the sample in PE presses equipped with cup anvils is more isotropically compressed (see Fig. S4 in Supplementary Materials), whereas the sample in DACs is uniaxially compressed with flat surfaces. This difference in geometry does not affect non-hydrostaticity if the PTMs are liquid/fluid, but once the PTM is solidified a significant difference is caused. This effect is more significant in PTMs with a large shear modulus. When the solidified 4:1 ME mixture and Ar are compared, the former is considered to have a larger shear modulus because the hydroxyl ion of methanol or ethanol has directional bonding in the solid-state, whereas solid Ar formed by van der Waals interaction has non-directional bonding. Thus, the non-hydrostaticity after freezing is more enhanced when the sample is compressed with the 4:1 ME mixture by DACs.
4.4. Contamination of Bragg peaks in diffraction profiles and the best PTM for neutron diffraction above 10 GPa
In this study, the contamination of Bragg peaks from Pb, AgCl, N2 and Ar in diffraction patterns was observed. The degree of the contamination was largest in Pb and AgCl, moderate in N2, and smallest in Ar or ME mixture. This feature is well explained by the scattering length of chemical species consisting of PTMs. compares the scattering intensities per unit volume of various PTMs, including liquid Ne. Here, the coherent and incoherent scatterings are estimated by ρ<bcoh>2 and ρ<binc>2 to exclude the effect of the crystal structure. The ρ is the number density (1/Å3) of PTMs at ambient pressure (the values of N2, Ar and Ne are for liquid at boilng point), <bcoh> and <binc> are the average of coherent and incoherent scattering length, respectively. In agreement with the trend in the diffraction patterns, ρ<bcoh>2 for Pb, AgCl, and N2 are relatively large while that for Ar is small. The value for the deuterated ME mixture is also large, but non-crystalline nature of ME mixture after freezing results in weak contamination in diffraction patterns. On the other hand, the ρ<bcoh>2 for liquid Ne, which would show small non-hydrostaticity after freezing, is also sizable; thus, Bragg peaks which appear after freezing will contaminate diffraction patterns considerably.
Table 1. Comparison of the scattering intensities per unit volume of various PTMs including liquid Ne.
Finally, the best PTM for the neutron diffraction above 10 GPa is discussed. The results of this study as well as the aforementioned comparison with Ne shows that the ME mixture is the best PTM in terms of smaller non-hydrostaticity and no contamination of the Bragg peaks in diffraction patterns. The heated ME is more preferable as it shows smaller non-hydrostaticity. The Ar, which shows good performance next to ME mixture, can be used for samples reactive to alcohols. The heating of Ar may also mitigate non-hydrostaticity, but its melting temperature steeply increases with pressure [Citation36]; thus, it would not be useful in practice.
In this study, MgO powder was used as a ‘sensor’ of non-hydrostaticity. Although MgO is softer than ruby that has been used in the previous studies, it is still harder than oxides with loose oxygen packing, molecular solids, or organic solids. The non-hydrostaticity depends on the relative hardness of the sample and frozen PTM, as well as the yield strength of the PTM; thus, such samples experiences larger non-hydrostaticity when compressed with frozen PTM. It is well exemplified when the N2 is used as a PTM: it is reported that the broadening of a Bragg spot of quartz starts at approximately 3 GPa where the N2 freezes [Citation19], whereas the peak width of MgO remained sharp up to 19 GPa in this study and the pressure distribution determined by ruby fluorescence method remains small up to 10 GPa [Citation12]. To calculate the non-hydrostaticity that the sample practically experiences, the theory of elasticity for composite materials [Citation37–40], needs to be applied to the mixture of the sample and the frozen PTM. However, it would be practically difficult due to the lack of information on elasticity and plasticity of them under pressure as well as the shape and size of the grains. Therefore, it is important to select the PTM according to the hardness of the sample if PTM freezing is unavoidable, as in high pressure experiments above ∼10 GPa or high pressure experiments at low temperatures.
5. Conclusion
To understand the practical effects of PTMs on neutron diffraction experiments using Paris–Edinburgh presses, diffraction patterns of MgO were collected up to ∼20 GPa using various PTMs, such as Pb, AgCl, 4:1 methanol–ethanol mixture with and without heating to 100°C, N2, and Ar. All the PTMs except the 4:1 ME mixture and Ar contaminated the diffraction patterns. Load–pressure curves for various media lack marked differences, indicating the compressibility of the PTMs has less effect on the pressure-generation efficiency. The hydrostaticity in the sample chamber estimated from the MgO 220 peak width improves in the order of Pb, AgCl, Ar, the 4:1 ME mixture, N2 and the heated ME mixture. Unlike studies using DACs, the non-hydrostaticity for the ME mixture remains small compared with Ar even after freezing; this is due to the differences in the compression geometry between PE presses and DACs and in the shear modulus between two PTMs after freezing. Therefore, based on these results and sizable coherent scattering of Ne (bc = 4.566 fm), which is expected to show good hydrostaticity, we conclude that the 4:1 ME mixture (or preferably, the heated mixture) is the best PTM in neutron diffraction experiments up to 20 GPa, while Ar can be substituted when a sample is reactive to alcohols.
In this study, we used MgO powder as an indicator of non-hydrostaticity; however, the non-hydrostaticity that a sample experience depends on relative hardness between the sample and solidified PTM. Thus, the PTM should be selected according to the hardness of the sample if PTM freezing is unavoidable, as in high pressure experiments above ∼10 GPa or high pressure experiments at low temperatures.
Supplemental Material
Download PDF (355.3 KB)Acknowledgments
The author (TH) thanks Dr Klotz for kindly teaching me the method to load Ar in the gaskets. The experiments were conducted under the MLF proposals 2017I0011 and 2019I0011.
Disclosure statement
No potential conflict of interest was reported by the author(s).
References
- Klotz S, Besson JM, Hamel G, et al. Neutron powder diffraction at pressure beyond 25 GPa. Appl Phys Lett. 1995;66:1735–1737. doi: 10.1063/1.113350
- Boehler R, Guthrie M, Molaison J, et al. Large-volume diamond cells for neutron diffraction above 90 GPa. High Press Res. 2013;33:546–554. doi: 10.1080/08957959.2013.823197
- Hattori T, Sano-Furukawa A, Machida S, et al. Development of a technique for high pressure neutron diffraction at 40 GPa with a Paris-Edinburgh press. High Press Res. 2019;39:417–425. doi: 10.1080/08957959.2019.1624745
- Komatsu K, Stefan K, Nakano S, et al. Developments of nano-polycrystalline diamond anvil cells for neutron diffraction experiments. High Press Res. 2020;40:184–193. doi: 10.1080/08957959.2020.1727465
- Guthrie M, Boehler R, Tulk CA, et al. Neutron diffraction observations of interstitial protons in dense ice. Proc Natl Acad Sci USA. 2013;110(26):10552–10556. doi: 10.1073/pnas.1309277110
- Klotz S, Casula M, Komatsu K, et al. High-pressure structure and electronic properties of YbD2 to 34 GPa. Phys Rev B. 2019;100:020101(R). doi: 10.1103/PhysRevB.100.020101
- Liebenberg DH. A new hydrostatic medium for diamond-anvil cells to 300 kbar pressure. Phys Lett. 1979;73A:74–76. doi: 10.1016/0375-9601(79)90754-0
- Nicol M, Hirsch KR, Holzapfel WB. Oxygen phase equilibria near 298 K. Chem Phys Lett. 1979;68:49–52. doi: 10.1016/0009-2614(79)80066-4
- Bell PM, Mao HK. Degree of hydrostaticity in He, Ne, and Ar pressure-transmitting media. Year Book. Carnegie Inst Washington. 1981;80:404–406.
- Besson JM, Nelmes RJ, Hamel G, et al. Neutron powder diffraction above 10 GPa. Physica B Condens Matter. 1992;180-181:907–910. doi: 10.1016/0921-4526(92)90505-M
- Klotz S. Techniques in high pressure neuron scattering. Boca Raton (FL): CRC Press -Taylor and Francis; 2013.
- Klotz S, Chervin JC, Munsch P, et al. Hydrostatic limits of 11 pressure transmitting media. J Phys D Appl Phys. 2009;42:075413. doi: 10.1088/0022-3727/42/7/075413
- Klotz S, Paumier L, Le Marchand G, et al. The effect of temperature on the hydrostatic limit of 4:1 methanol-ethanol under pressure. High Press Res. 2009;29:649–652. doi: 10.1080/08957950903418194
- Klotz S, Takemura K, Strässle T, et al. Freezing of glycerol-water mixtures under pressure. J Phys Condens Matter. 2012;24:325103. doi: 10.1088/0953-8984/24/32/325103
- Bull CL, Bocian A, Hamidov H, et al. Note: Achieving quasi-hydrostatic conditions in large-volume toroidal anvils for neutron scattering to pressures of 18 GPa. Rev Sci Instrum. 2011;82:076101. doi: 10.1063/1.3606643
- Gieske JH, Barsch GR. Pressure dependence of the elastic constants of single crystalline aluminum oxide. Physica Status Solidi. 1968;29:121–131. doi: 10.1002/pssb.19680290113
- Gladden JR, So JH, Maynard JD, et al. Reconciliation of ab initio theory and experimental elastic properties of Al2O3. Appl Phys Lett. 2004;85:392–394. doi: 10.1063/1.1773924
- Burnett JH, Cheong HM, Paul W. The inert gases Ar, Xe, and He as cryogenic pressure media. Rev Sci Instrum. 1990;61:3904–3905. doi: 10.1063/1.1141520
- Angel RJ, Bujak M, Zhao J, et al. Effective hydrostatic limits of pressure media for high-pressure crystallographic studies. J Appl Cryst. 2007;40:26–32. doi: 10.1107/S0021889806045523
- Elemets MI. High pressure experimental methods. New York: Oxford University Press; 1996.
- Jackson I, Niesler H. The elasticity of periclase to 3 GPa and some geophysical implications. In: Akimoto S, Manghnani MH, editors. High pressure research in geophysics. Tokyo: Center for Academic Publications; 1982. p. 93–133.
- Duffy TH, Ahrens TJ. Compressional sound velocity, equation of state, and constitutive response of shock-compressed magnesium oxide. J Geophys Res. 1995;100:529–542. doi: 10.1029/94JB02065
- Chopelas A. The fluorescence sideband method for obtaining acoustic velocities at high compressions: Application to MgO and MgAl2O4. Phys Chem Minerals. 1996;23:25–37. doi: 10.1007/BF00202990
- Hattori T, Sano-Furukawa A, Arima H, et al. Design and performance of high-pressure PLANET beamline at pulsed neutron source at J-PARC. Nucl Instrum Methods Phys Res A. 2015;780:55–67. doi: 10.1016/j.nima.2015.01.059
- Klotz S, Gauthier M, Besson JM, et al. Techniques for neutron diffraction on solidified gases to 10 GPa and above: Applications to ND3 phase IV. Appl Phys Lett. 1995;67:1188–1190. doi: 10.1063/1.115002
- Jackson I. Elasticity, composition and temperature of the Earth’s lower mantle: a reappraisal. Geophys J Int. 1998;134:291–311. doi: 10.1046/j.1365-246x.1998.00560.x
- Strässle T, Klotz S, Kunc K, et al. Equation of state of lead from high-pressure neutron diffraction up 8.9 GPa and its implication for NaCl pressure scale. Phys Rev B. 2014;90:014101. doi: 10.1103/PhysRevB.90.014101
- Hull S, Keen DA. Pressure-induced phase transitions in AgCl AgBr, and AgI. Phys Rev B. 1999;59:750–761. doi: 10.1103/PhysRevB.59.750
- Young DA, Zha CS, Boehler R, et al. Diatomic melting curves to very high pressure. Phys Rev B. 1987;35:5353–5356. doi: 10.1103/PhysRevB.35.5353
- Hanfland M, Lorenzen M, Wassilew-Reul C, et al. Structures of molecular nitrogen at high pressures. Rev High Pressure Sci Technol. 1998;7:787–789. doi: 10.4131/jshpreview.7.787
- Zha CS, Boehler R, Yong DA, et al. The argon melting curve to very high pressures. J Chem Phys. 1986;85:1034. doi: 10.1063/1.451295
- Jephcoat AP. Rare-gas solids in the Earth’s deep interior. Nature(London). 1998;393:355–358. doi: 10.1038/30712
- LeSar R, Ekberg SA, Jones LH, et al. Raman spectroscopy of solid nitrogen up to 374 kbar. Solid State Com. 1979;32:131–134. doi: 10.1016/0038-1098(79)91073-1
- Klotz S, Besson JM, Hamel G. Pressure distribution in solid samples compressed by toroidal anvils. High Press Res. 2006;26:277–282. doi: 10.1080/08957950600869095
- Iizuka R, Yagi T, Gotou H, et al. An opposed-anvil-type apparatus with an optical window and a wide-angle aperture for neutron diffraction. High Press Res. 2012;32:430–441. doi: 10.1080/08957959.2012.722213
- Boehler R, Ross M, Söderlind P, et al. High-pressure melting curves of argon, krypton, and xenon: deviation from corresponding states theory. Phys Rev Lett. 2001;86:5731–5734. doi: 10.1103/PhysRevLett.86.5731
- Reuss A. Berechnung der Fliessgrenze von Mischristallen auf Grund der Plastizitätsbedingung für Einkristalle. Z Angew Math Mech. 1929;9:49–58. doi: 10.1002/zamm.19290090104
- Voigt W. Ueber die Beziehung zwischen den beiden Elastizitätsconstanten isotroper Körper. Ann Physik. 1889;38:573–587. doi: 10.1002/andp.18892741206
- Hill R. Elastic properties of reinforced solids: some theoretical principles. J Mech Phys Solids. 1963;11:357–372. doi: 10.1016/0022-5096(63)90036-X
- Hashin Z, Shtrikman S. Avariational approach to the theory of the elastic behaviour of multiphase materials. J Mech Phys Solids. 1963;11:127–140. doi: 10.1016/0022-5096(63)90060-7
- Kimura T, Matsushima T, Ueda K, et al. Deuterium isotope effect on excess enthalpies and methanol or ethanol and their deuterium derivatives at 298.15 K. J Therm Anal Calorim. 2001;64:231–241. doi: 10.1023/A:1011553500435
- Cuevara-Carrion G, Nieto-Draghi C, Vrabec J, et al. Prediction of transport properties by molecular simulation: methanol and ethanol and their mixture. J Phys Chem B. 2008;112:16664–16674. doi: 10.1021/jp805584d
- Dianoux AJ, Lander G. Neutron data booklet. 2nd ed. Philadelphia (PA): Old City Publishing; 2003.