
 ?Mathematical formulae have been encoded as MathML and are displayed in this HTML version using MathJax in order to improve their display. Uncheck the box to turn MathJax off. This feature requires Javascript. Click on a formula to zoom.
ABSTRACT
We describe the use of a silver-coated 90 parabolic mirror of 33 mm focal length as objective for imaging, on-axis laser heating and radiospectrometric temperature measurements of a sample compressed in a diamond anvil cell in a laser heating system. There, spatial resolution and imaging quality of the parabolic mirror are similar to the one of a 10× objective. The temperature measurements between 500 and 900 nm are essentially free from chromatic aberration. The parabolic mirror was also perforated with a 220-μm hole, allowing for on-axis imaging, laser heating and incidence of X-rays simultaneously at synchrotron facilities. The parabolic mirror is thus a well-suited alternative to existing refractive and reflective objectives in laboratory and synchrotron laser heating systems.
1. Introduction
Experiments in laser heated diamond anvil cells (LHDACs) are today routinely used for studying material under the extreme conditions of the Earth's interior. A variety of in situ measurement techniques are available for LHDAC in the laboratory (e.g. Raman and Brillouin spectroscopy) and at synchrotron radiation facilities (e.g. X-ray diffraction, X-ray emission spectroscopy and nuclear resonant scattering, see [Citation1,Citation2] and references therein). LHDAC have shaped our understanding of structural properties, phase relations and chemical equilibria of Earth's mantle material [Citation3].
The probably most important requirements to a laser heating (LH) system in general are a good sample imaging with high spatial resolution and a reliable temperature measurement during heating [Citation4]. Sample imaging in laboratory LH systems is mostly achieved by lens objectives of ca. 30 mm focal distance, which also allow on-axis focusing of the IR laser (a). In LH systems at the synchrotron, with incidence of X-rays coaxial to the axis of the DAC, the use of an on-axis heating lens objective requires an X-ray transparent or perforated 45 tilted mirror (b). This design, with an achromatic or apochromatic objective of typically 60 mm focal length, is the most common one at X-ray diffraction beamlines [Citation5–10]. It is also suitable for X-ray spectroscopy techniques, if the upstream tilted mirror is sufficiently X-ray transparent or even perforated [Citation11,Citation12].
Figure 1. Sketches of LH system objective arrangements: (a) common laboratory geometry of apochromat objective for optical observation and on-axis laser focus, focal distance typically about 30 mm. (b) Common synchrotron geometry of apochromat objective combined with a 45 tilted mirror (TM), focal distance typically about 60 mm. (c) Perforated parabolic mirror for use both in laboratory and synchrotron, reflective focal distance here 33 mm. (d) Reflective objective combined with 45
tilted mirror, focal distance typically well above 70 mm.
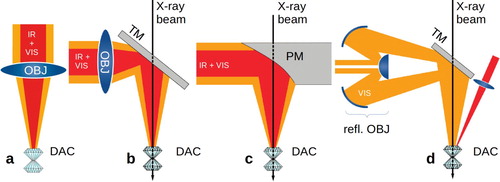
The temperature in the laser heated DAC is mostly determined by radiospectrometry of the thermal emission of the hot spot. This approach has various sources of error that are worth to be mentioned briefly. One possible source of error is the deviation of the thermal emission spectrum of a heated sample from the theoretical black body distribution [Citation13], which is fitted to the recorded spectrum and in which the temperature enters as variable. Another type of error are spatial thermal gradients in the hot spot, both radially and axially, possibly resulting in superposition of temperature signals [Citation14]. The effect of possible radial gradients can be reduced by a high spatial resolution of the LH system. The third source is the possible temporal averaging of oscillating temperature, e.g. due to oscillations in laser power [Citation15]. Finally, but most strong and evident, is the spectral distortion by optical elements, in the first place by the chromatic aberration of lens objectives [Citation16,Citation17], but also by the high refractive index of diamonds [Citation18]. The spectral distortion due to chromatic aberration of a lens objective can be severe [Citation19,Citation20] and seems, if present, to overprint any other possible distorting effect. Therefore, we consider chromatic aberration of the lens objective as major sources of error in temperature measurement in the laser heated DAC.
Reflective objectives are free from chromatic aberration and therefore favorable for temperature determination [Citation19–Citation21]. However, commonly used reflective objectives are inherently not well suited for focusing of high power lasers. Instead, the heating laser has to be focused and directed to the sample by separate additional optical elements. In reflective laboratory LH systems, these additional elements can be positioned such that an on-axis heating geometry is achieved. However, under the geometrical constraints of LH systems at synchrotron facilities, the use of reflective objectives requires off-axis heating (as shown in d). On the contrary, most refractive LH systems routinely use on-axis laser focusing (a,b). Therefore, reflective and refractive objectives usually cannot be exchanged without major re-arrangement of optical elements. This situation has led to the separation of synchrotron LH systems in either reflective and refractive ones. This separation is the most important reason for the long-standing debate about the influence of chromatic aberration in lens objectives on the reliability of temperature measurements [Citation19–Citation22]. A small reflective imaging objective, that allows for on-axis laser heating, could bridge this gap. It could replace lens objectives in on-axis heating LH systems, at least on one side of an LH system, and result in wide-range temperature determinations with very low overall chromatic aberration.
The 90 off-axis parabolic mirror, hereafter parabolic mirror (PM) for brevity, is a candidate for such a compact on-axis heating reflective objective (c). To our knowledge, the use of PMs for imaging of DAC samples has not been described. Earlier attempts to use a PM for DAC imaging may have been inhibited by the fact that a PM is not an aplanatic optical system and therefore require precise alignment [Citation23]. Lens objectives are aplanatic, which means that they maintain compensation for spherical and coma aberration also for off-axis beams. Therefore, lens objectives allow for sharp imaging of an extended area around the on-axis focus point. In the case of a PM there is strong coma aberration for any off-axis beam. However, PMs can serve for imaging of small objects -- like the sample chamber in a DAC. This is the reasoning that led us to explore the capability of PMs for combined reflective imaging, on-axis laser heating and radiospectrometry. Reflective imaging and on-axis laser heating in combination offers the possibility to introduce reflective radiospectrometry into on-axis LH systems. The purpose of this study is to demonstrate the capabilities of a PM. Due to a perforation coaxial to the focusing path, it can be used both in the laboratory and at the synchrotron.
2. Instrumentation and results
2.1. Parabolic mirror design and implementation
The silver-coated 90 PM with an effective focal length of 33 mm and a 12.7 mm diameter (Thorlabs article MPD01M9-P01) was perforated by us with a 220-μm diameter hole and built into the recently described portable LH system on its upstream side directed towards the incoming X-ray beam [Citation12]. For clarity, we show the fundamental configuration of the LH system in a schema in . The PM replaces both refractive objective and its tilting mirror by simultaneously 90
-deflecting and focusing the collimated laser beam and light (see also , compare b and c). The PM also collects the light emitted from the sample and directs it towards an image-forming lens of large focal distance, here 500 mm, and further to the spectrometer for temperature measurements (). The PM is fixed on a kinematic tilt stage for angular alignment around three axes, mounted on a x,y,z translation stage with micrometer precision.
Figure 2. Sketch of the essential aspects of the LH system that allowed for direct comparison of the PM to an apochromat (APO) of ca. 30 mm focal length. To achieve that, we modified the versatile portable LH system designed for at synchrotron [Citation12]. Optical paths are shown in orange, laser path in red, lens objectives in green and the two dichroic mirrors in purple. All fully reflective mirrors, one laser beamsplitter and one halfmirror in front of the mirror with pinholes are shown in light blue. The motorized slim diode to record the X-ray transmission profiles (in ) are shown in darker blue. The angle of the normal of the mirror at the spectrometer entrance with respect to the optical path is 17.
![Figure 2. Sketch of the essential aspects of the LH system that allowed for direct comparison of the PM to an apochromat (APO) of ca. 30 mm focal length. To achieve that, we modified the versatile portable LH system designed for at synchrotron [Citation12]. Optical paths are shown in orange, laser path in red, lens objectives in green and the two dichroic mirrors in purple. All fully reflective mirrors, one laser beamsplitter and one halfmirror in front of the mirror with pinholes are shown in light blue. The motorized slim diode to record the X-ray transmission profiles (in Figure 6) are shown in darker blue. The angle of the normal of the mirror at the spectrometer entrance with respect to the optical path is 17∘.](/cms/asset/58bbaad7-9b25-4685-b7de-dfda0e3554f2/ghpr_a_1921173_f0002_oc.jpg)
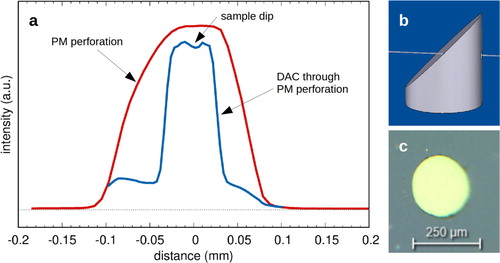
Figure 6. (a) Transmission scan of a DAC in the LH system equipped with a DAC with Fe-containing sample, recorded with the slim removable diode shown in at beamline P01, PETRA III. The X-ray focus was m
FWHM. One scan shows the transmission profile of the PM without DAC (red line), one scan shows the transmission profile of DAC downstream of the PM, ready for laser heating. Due to the attenuation by approximately 4 mm of diamond in the DAC, the curves were recorded with different gain of the diode and then scaled. Note that the scans are the result of a convolution of the dimensions of DAC gasket hole and PM perforation hole with the dimensions of the X-ray beam. (b) Sketch illustrating the perforation of the PM. (c) Photograph of the hole at the mirror surface.
On the opposite side of the DAC (downstream from the X-ray beam) is an OptoSigma 10X NIR apochromat installed, to enable double-sided laser heating, temperature measurement and observation in both reflected and transmitted light. On both sides, the YAG laser light is made coaxial to the path of optical imaging by a dichroic mirror [Citation12].
The images of both objectives are formed in ca. 15× (PM) and ca. 17× (apochromat) magnification by two secondary lenses of 500 mm focal length on one mirror at the entrance of the spectrometer. The mirror at the entrance of the spectrometer is tilted by about 17, and a camera at about 34
with respect to the optical path records both images (). The tilt of mirror and camera eliminates the need of a beamsplitter in the path. Two holes of ∼40 μm diameter collect the light from the laser hot spot simultaneously from both sides of the DAC for temperature measurements [Citation12,Citation24]. These two holes can be seen as small black circular spots in the recorded image of both sides of the sample (b,c).
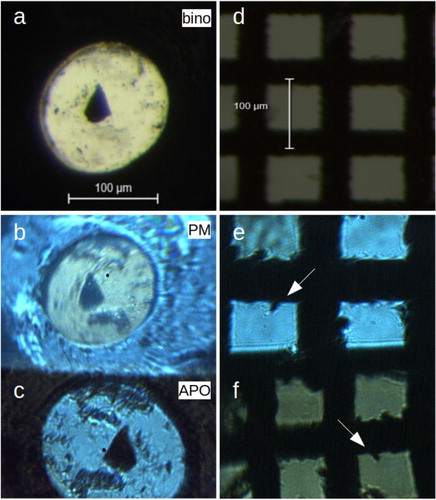
Figure 3. Photographs of a sample in the DAC (a–c) and a sample carrier grid (d–f), recorded with a Leica M205 binocular (a,d), and in the LH system with the PM (b,e) and with the apochromatic objective (c,f). (a–c) A triangular piece of Pt foil (ca. m
) in NaCl in a DAC, before pressurization. The sample chamber is approximately 130 μm in diameter, see scale bar in (a). (d–f) A transmission electron microscope sample carrier grid of 100 μm periodicity. Arrows in (e,f) are for orientation and indicate the same object.
2.2. Imaging and laser focus
We compare the imaging quality of the PM in the LH system to one of the apochromatic objective on the other side of the DAC and to one of a common binocular Leica M205 in highest magnification. The left column in shows images of an approximately triangular Pt foil loaded in a hole of approximately 130 μm diameter surrounded by NaCl as pressure transmitting medium in a DAC. The cell had not been pressurized yet, and therefore most of the features in the NaCl result from remaining grain surfaces. The images of the sample in the LH system (b,c) have been obtained in simultaneous transmitted and reflected light.
The right column of shows images of a transmission electron microscope sample carrier grid in the same configurations. All features visible in the image of the apochromat are also clearly distinguishable in the one of the PM, note for example the nose at which the white arrows point in (e) and (f).
For both the sample in the DAC and the sample carrier grid in , the same features are visible in the corresponding images of PM and apochromatic objective. Therefore, the PM fulfills the requirements to an LHDAC objective and provides an imaging quality that approaches the one of an apochromat with similar focal length. A more detailed comparison of the imaging quality of the PM to the one of other on-axis heating objectives might need to consider in detail the effects of secondary lens and lighting.
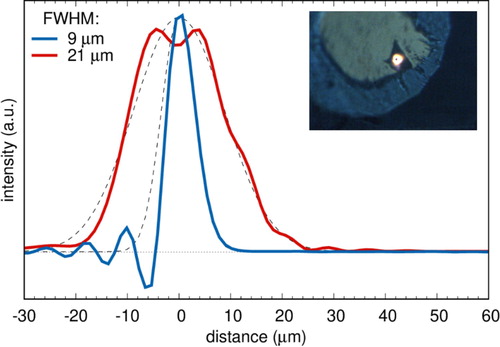
To produce high temperatures the laser in LH systems must be focused precisely on both sides (in double-sided heating) onto the desired area. The laser focus quality of the PM was determined by measuring the IR laser spot size by a scanning slit optical beam profiler (Thorlabs BP209-VIS) (, blue line). Intensity oscillations to values below zero on the left side of the peak were attributed to a measurement artifact. A Gaussian fitted to the right half of the intensity distribution yielded 9 μm full width at half maximum (FWHM). This value is in very good agreement to the predicted waist diameter in the focal plane of 9 μm, calculated by
(1)
(1) where 2ω is the spot diameter at 1/e
intensity,
nm is the laser wavelength, F=33 mm is the effective focal length of the PM,
is the beam quality factor and D=5.5 mm is the collimated laser beam diameter at 1/e
intensity. To overcome the small size of the laser beam produced by the PM (, red line) and to shape the laser beam towards a flat-top profile, we equipped our system with a π-shaper (Adloptica) that produces a more homogeneous temperature distribution over a larger central area of the hot spot (red line, 21 μm FWHM).
Figure 4. Laser focus profiles without and with beam shaping (blue and red lines, respectively). The unshaped peak has been downscaled to enable comparison of the two beam shapes. Dashed lines represent Gaussian fits from which we derived FWHM values. Inset photo: Heating of a platinum foil in a DAC at 20 GPa with the PM without beam shaping. The black dot in the center of the hot spot is the pinhole entrance to the spectrometer for temperature measurement.
We determined the spatial resolution of radiospectrometric measurements with the PM using knife edge scans as before [Citation12] and found it to be below 4 μm, regardless of the monochromatized light of 500, 650 and 800 nm. This spatial resolution of temperature measurement is the result of the diameter of the spectrometer entrance pinhole (seen in (b,c) and in the inset of ) and the ca. 15× magnification achieved by the combination of PM and image forming achromat of 500 mm focal distance.
2.3. Temperature measurements
The primary goal of using reflective objectives is to exclude the chromatic aberration of lens objectives as distorting factor in radiospectrometric temperature measurement [Citation17,Citation19,Citation20]. Reflective objectives allow for radiospectrometric measurements over a wide wavelength range without this spectral distortion [Citation24]. To demonstrate the performance of the PM, we recorded an incandescence spectrum of a hot spot on both sides of the sample between 455 and 945 nm, on one side with the PM, on the other side with the apochromatic on-axis imaging and heating objective. On both sides we subtracted background and divided by the spectrum of a calibrated temperature reference halogen lamp.
The recorded spectra (blue and red lines in (a,d) for PM and lens objective, respectively) were fitted to 2312 K and 2367 K by a Planck distribution between 500 and 900 nm (grey lines). The edge regions 455–500 nm and 900–945 nm visually agree well with the fit, but distorting effects like limited inaccuracy in background subtraction from weak signal (455–500 nm) and etaloning oscillations resulting from detector coatings (900–945 nm) limit the usability of these regions. However, the range of nm for fitting the Planck function can still be considered as exceptionally large.
Figure 5. Comparison of radiospectrometric temperature determination with the parabolic mirror (left column of figures) and the apochromatic objective (right column), and the influence of spectral distortion due to chromatic aberration on temperature determination. (a,d): Spectrum, Planck fit and resulting temperature estimate. (b,e): Relative difference of spectrum and fit, the difference is area-shaded for illustration. (c,f): Plot of two-color temperature (spacing of 100 nm). Dashed lines represent temperature determined from Planck fit.
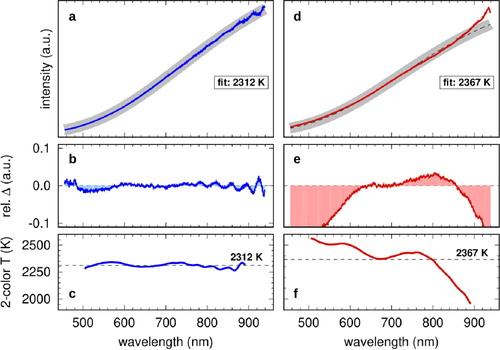
The visual agreement between spectra and respective Planck fits is misleading and not sufficient to assess the reliability of temperature measurement. Additional measures are required: a difference plot and the so-called two-color temperature. As a first step, we plot the relative difference between spectra and fits (b,e). The deviation in the case of the PM (b) is oscillating, but not systematically deviating. In the case of the apochromat, the deviation to the fit is small only in the region between 600 and ca. 850 nm, which is the common range to report temperature fits with apochromatic objectives in the literature.
A plot of the two-color temperature is an even more meaningful way to reveal and assess spectral distortion caused mainly by chromatic aberration [Citation14,Citation19,Citation25]. For a two-color plot, the spectral intensity at two different wavelengths, separated by e.g. 50 or 100 nm, is fitted by a Planck distribution, and the resulting temperature is plotted in the half-way between both wavelengths. This is done for all possible pairs of wavelengths, here with a separation of 100 nm in the range between about 455 and 940 nm. The resulting curve plots the temperature versus wavelength in the range between 505 and 890 nm (shown in (c,f) for PM and apochromat objective, respectively). In the absence of spectral distortion, the curve follows a flat line, indicating that the same temperature results from a Planck fit, regardless of the wavelength window. We see this situation fulfilled in the case of the PM (c). The mean of the two-color temperature curve is 2313 K (horizontal black line), very close to the result of the Planck fit of 2312 K (a). The standard deviation is with 21 K very small, although the width of the wavelength range shown and used here for radiospectrometry is exceptionally wide [Citation19,Citation26,Citation27].
The two-color plot of the spectrum acquired on the side of the apochromat (f, the y-axis has the same range as in c), shows a typical large variation of temperature of several hundred Kelvin, which results from the spectral distortion introduced by chromatic aberration. The average two-color temperature of 2379 K deviates 10 times more from one of the Planck fit than in the case of the PM, and the standard deviation, although of little use in situations of systematic trends like the one in (f), is 141 K. This spectral effect of chromatic aberration of common apochromat objectives is not often addressed or remedied by irises [Citation26], and rarely shown in this clarity in the literature. This is probably because the commonly reported wavelength range for temperature determination is significantly smaller, mostly not exceeding 200 or 250 nm, usually limited to the core region between 600 nm and 800 nm, for which the properties of the apochromat have been optimized and in which the systematic variation of the two-color temperature is thus smallest (but still large compared to the PM, see f).
It has been shown for the case of an off-axis LH system that the chromatic aberration of an achromat lens objective can be efficiently suppressed when the numerical aperture is drastically reduced by an iris between DAC and imaging objective [Citation19,Citation20,Citation25]. This is not a viable solution for the common refractive on-axis LH systems, because the laser needs to pass through objective and iris.
2.4. Use at synchrotron facilities
To perform in situ laser heating at synchrotron radiation facilities, the main condition is to allow the X-ray beam to pass to the sample without significant attenuation, especially in X-ray spectroscopy, which mostly operates far below 20 keV [Citation12,Citation25].
In order for the X-ray beam to reach the sample inside the DAC with zero attenuation, we perforated the PM with an electric-discharge machine coaxially to its focusing axis. The perforation is conical, with a hole in the mirror surface of ∼220 μm diameter (a–c) and about 1 mm diameter at the PM's back side.
First, the DAC is aligned to the laser hot spot, then both DAC and PM pinhole are simultaneously aligned to the X-ray beam. In our case, this is achieved by translation and tilt of the entire portable LH system.
To demonstrate the alignment of a perforated PM at a beamline, we show in a translation scan profile in which PM and DAC are scanned horizontally across the focused X-ray beam (beamsize m
FWHM) at beamline P01 at PETRA III, DESY (blue line). The profile of PM only, with no DAC in the LH system, is shown for comparison (red line).
3. Discussion and further improvements
The use of 90 PMs has not been reported before for imaging. Here we describe the potential of PMs, to be used as an objective for both imaging and on-axis laser focusing, similar to a specialized apochromatic objective, but with radiospectrometric temperature measurements free from chromatic aberration and therefore over a wider temperature range. We see two possible reasons why the use of a PM for DAC imaging has not been reported before which we want to address in this section.
3.1. Image distortion and alignment
The image plane from a single PM used as objective, combined with an long focal length image forming achromat, is horizontally tilted by 45 relative to the plane perpendicular to the focus axis [Citation28]. This results in distortion and in defocusing of parts of the image, which can only remedied by tilting the mirror at the spectrometer entrance by the same amount: 45
instead of currently 17
(). However, here we have shown that already a tilt of 17
[Citation12] gives a comparably good image of a sample in the DAC. The distortion of the image plane can be fully cancelled possibly only if PMs are used in pairs, like in scanning spectrometers [Citation28–30], but this would also cancel the magnification which is needed for observation and radiospectrometry in an LH system.
In addition, for a well formed image, PMs have to be precisely aligned in the range of a fraction of a degree [Citation31,Citation32]. However, a translational and tilt kinematic alignment stage used here, allows for a sufficiently high degree of precision.
3.2. Perforation
The perforation for in situ X-ray measurements removes a small central part of the mirror surface. At this damaged part of the mirror the laser beam is absorbed or diffusely scattered by the exposed aluminum mirror substrate. There is a simple way to calculate the fraction of laser intensity that is lost in perforation in the worst case. Our laser has the typical radially symmetric TEM Gaussian beam profile. In that case, this calculation requires only the ratio of two 2D Gaussian distributions of identical width, the first one excluding the central circular region with the diameter of the perforation, and the second one over the full Gaussian intensity range (). This calculation assumes coincidence of the center of the perforation with the center of the laser beam and therefore yields a maximum estimate of laser loss due to the perforation.
Figure 7. The minimum yield of laser light reflected from a perforated PM as a function of the ratio of perforation diameter over FWHM of the laser beam. The cross at a ratio of 0.07 with a laser yield of 98.6% indicates a minimum estimate for the here reported setup. See text for details.
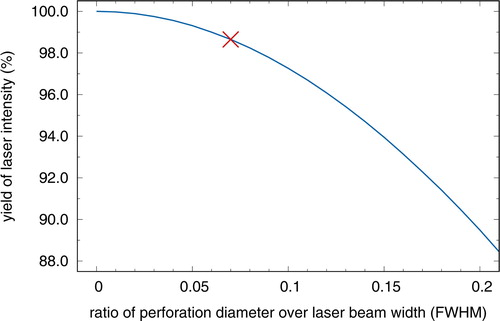
Our TEM laser beam diameter at FWHM is 3.2 mm and the perforation diameter is 220 μm, which is a ratio of 0.068, say 0.07. These parameters lead to a maximum loss of laser intensity of 1.4% (see cross in ). A larger perforation would facilitate sample alignment and X-ray beam throughput. With the laser beam width of 3.2 mm FWHM used here, a perforation diameter of more than 400 μm can be afforded at the cost of maximally 5% of the incident intensity (ratio 0.13, see ). If needed, the collimated laser beam can be widened to reduce the fraction of lost laser light. A beam shaper also lowers the loss, as the central laser beam intensity is reduced. Finally, the laser beam can be slightly off-center, which reduces the laser intensity lost by the circular perforated mirror area.
4. Conclusion and outlook
In this work, we have presented the use of a parabolic mirror as light-weight and cost-effective reflective objective for LH systems in the laboratory and at beamlines of synchroton radiation facilities. We have tested an off-the-shelf 90 parabolic mirror of 33 mm focal length and 0.5 inch diameter, other focal lengths are possible. Laser focusing and image quality demonstrate that its performance is comparable the one of 10X apochromats commonly used in laser heating. Whenever theoretically predicted systematic deviations of the emittance of a sample from grey body emittance [Citation33,Citation13] become subject of experimental investigation, the chromatic aberration of the system has to be substantially suppressed, otherwise there is a risk to be misled by spectral distortion.
The chromatic aberration of lens objectives has led to a much-discussed ambiguity in temperature measurement with refractive objectives, especially of synchrotron LH systems. With the PM, the separation of synchrotron LH systems in ‘exclusively reflective’ and ‘exclusively refractive’ can be overcome, as the PM can be installed instead of a refractive objective and its bending mirror. Depending on spatial requirements of the X-ray measurement technique, the PM can be positioned either only upstream of the DAC, e.g. in the case of XRD [Citation34], or upstream and downstream of the DAC, e.g. in the case of XES, NIS, XRS or XAS [Citation12,Citation35–37].
The combination of the PM with a long working distance image forming lens, as presented here, drastically reduces the overall chromatic aberration of the system, but does not fully eliminate it. It seems possible, however, to turn an LH system with a PM as objective into an all-reflective system with moderate effort.
Acknowledgments
We would like to thank an anonymous reviewer for helpful comments. GS and LL thank Jens Bölke and Kevin Küpfer for technical support and Axel Heuer for the beam profiler. GS thanks Corinna Kallich for help with image processing and Manuel Harder, Sergio Speziale, Alexander Laskin, Angelika Rosa, Nicolas Guignot, Thomas Gaumnitz, Norbert Gulde, Gabor Csucs, Leonid Dubrovinsky, Innokenty Kantor and Lutz Decker for fruitful exchange. We acknowledge the Deutsches Elektronen-Synchrotron DESY in Hamburg, Germany, a member of the Helmholtz Association HGF, for the provision of experimental facilities during beamtime 11008255 (proposal I-2019100), and we thank the staff of beamline P01 for their support and exchange. CS and MW acknowledge support from the BMBF project 05K10PEC, CA acknowledges financial support through DFG project STE 1079/4-1 (CarboPat -- FOR2125) and RS acknowledges financial support through DFG project STE 1079/2-1.
Disclosure statement
No potential conflict of interest was reported by the author(s).
Additional information
Funding
References
- Anzellini S, Boccato S. A practical review of the laser-heated diamond anvil cell for university laboratories and synchrotron applications. Crystals. 2020;10:459.
- Mao H-K, Chen X-J, Ding Y, et al. Solids, liquids and gases under high pressure. Rev Mod Phys. 2018;90:015007.
- Dorfman SM, Phase diagrams and thermodynamics of lower mantle materials. In: Terasaki H, Fischer RA, editors. Deep earth: physics and chemistry of the lower mantle and core. American Geophysical Union, Washington D. C.; 2016. p. 241–252.
- Jeanloz R, Kavner A. Melting criteria and imaging spectroradiometry in laser-heated diamond-anvil cell experiments. Phil Trans R Soc London A. 1996;354:1279–1305.
- Aprilis G, Strohm C, Kupenko I, et al. Portable double-sided pulsed laser heating system for time-resolved geoscience and materials science applications. Rev Sci Instrum. 2017;88:084501.
- Fedotenko T, Dubrovinsky L, Aprilis G, et al. Laser heating setup for diamond anvil cells for in situ synchrotron and in house high and ultra-high pressure studies. Rev Sci Instrum. 2019;90:104501.
- Ma Y, Mao H-k., Hemley RJ, et al. Two-dimensional energy dispersive x-ray diffraction at high pressures and temperatures. Rev Sci Instrum. 2001;72(2):1302.
- Meng Y, Hrubiak R, Rod E, et al. New developments in laser-heated diamond anvil cell with in situ synchrotron x-ray diffraction at high pressure collaborative access team. Rev Sci Instrum. 2015;86:072201.
- Prakapenka VB, Kubo A, Kuznetsov A, et al. Advanced flat top laser heating system for high pressure research at GSECARS: application to the melting behavior of germanium. High Press Res. 2008;28(3):225–235.
- Smith D, Smith JS, Childs C, et al. A CO2 laser heating system for in situ high pressure-temperature experiments at HPCAT. Rev Sci Instrum. 2018;89:083901.
- Kupenko I, Dubrovinsky L, Dubrovinskaia N, et al. Portable double-sided laser-heating system for Mössbauer spectroscopy and X-ray diffraction experiments at synchrotron facilities with diamond anvil cells. Rev Sci Instrum. 2012;83:124501.
- Spiekermann G, Kupenko I, Petitgirard S, et al. A portable on-axis laser heating system for near-90 X-ray spectroscopy: application to ferropericlase and iron silicide. J Synchrotron Radiat. 2020;27(2):414–424.
- Deng J, Du Z, Benedetti LR, et al. The influence of wavelength-dependent absorption and temperature gradients on temperature determination in laser-heated diamond-anvil cells. J Appl Phys. 2017;121:025901.
- Benedetti LR, Loubeyre P. Temperature gradients, wavelength-dependent emissivity, and accuracy of high and very-high temperatures measured in the laser-heated diamond cell. High Press Res. 2004;24(4):423–445.
- Childs C, OĎonnell W, Ellison P, et al. Optical and electronic solutions for power stabilization of CO2 lasers. Rev Sci Instrum. 2020;91(10):103003.
- Dewaele A, Eggert JH, Loubeyre P, et al. Measurement of refractive index and equation of state in dense He, H2, H2O, and Ne under high pressure in a diamond anvil cell. Phys Rev A. 2003;67:094112.
- Walter MJ, Koga KT. The effects of chromatic dispersion on temperature measurement on the laser-heated diamond anvil cell. Phys Earth Planet Int. 2004;143–144:541–558.
- Benedetti LR, Guignot N, Farber DL. Achieving accuracy in spectroradiometric measurements of temperature in the laser-heated diamond anvil cell: diamond is an optical component. J Appl Phys. 2007;101(1):013109.
- Giampaoli R, Kantor I, Mezouar M, et al. Measurement of temperature in the laser heated diamond anvil cell: comparison between reflective and refractive optics. High Press Res. 2018;38(3):250–269.
- Mezouar M, Giampaoli R, Garbarino G, et al. Methodology for in situ synchrotron X-ray studies in the laser-heated diamond anvil cell. High Press Res. 2017;37(2):170–180.
- Petitgirard S, Salamat A, Beck P, et al. Strategies for in situ laser heating in the diamond anvil cell at an X-ray diffraction beamline. J Synchrotron Radiat. 2014;21:89–96.
- Morard G, Boccato S, Rosa AD, et al. Solving controversies on the iron phase diagram under high pressure. Geophys Res Lett. 2018;45:11074–11082.
- Laskin A, Basics of optics on imaging quality and aberrations. In: Handbook of laser micro- and nano-engineering. Springer, Cham, Switzerland; 2021.
- Boehler R, Chopelas A. A new approach to laser heating in high pressure mineral physics. Geophys Res Lett. 1991;18(6):1147–1150.
- Kantor I, Marini C, Mathon O, et al. A laser heating facility for energy-dispersive X-ray absorption spectroscopy. Rev Sci Instrum. 2018;89:013111.
- Lord OT, Walter MJ, Dasgupta R, et al. Melting in the Fe-C system to 70 GPa. Earth Planet Sci Lett. 2009;284:157–167.
- Watanuki T, Shimomura O, Yagi T, et al. Construction of laser-heated anvil cell system for in situ x-ray diffraction study at SPpring-8. Rev Sci Instrum. 2001;72(2):1289–1292.
- Malone RM, Becker SMA, Dolan DH, et al. Design of a thermal imaging diagnostic using 90-degree off-axis parabolic mirrors. SPIE Optics + Photonics, San Diego, USA; 2006.
- Holdworth JL, Sharafutdinova G, Sanderson MJ, et al. Off-axis parabolic optical relays: almost perfect imaging. Proc SPIE. 2011;8011:80112C.
- Sharafutdinova G, Holdsworth J, van Helden D. Improved field scanner incorporating parabolic optics. Part 2: experimental verification and potential for volume scanning. Appl Opt. 2010;49(29):5517–5527.
- Howard JE. Imaging properties of off-axis parabolic mirrors. Appl Opt. 1979;18(15):2714–2722.
- Liu X, Lu Z, Wang X, et al. Study on the focusing characteristics of off-axis parabolic mirror focusing system. 2011 Academic International Symposium on Optoelectronics and Microelectronics Technology; 2011. p. 116–119.
- Lobanov SS, Speziale S. Radiometric temperature measurements in non-gray ferropericlase with pressure- spin- and temperature dependent optical properties. J Geophys Res. 2019;124:12825–12836.
- Drewitt JWE, Walter MJ, Zhang H, et al. The fate of carbonate in oceanic crust subducted into earth's lower mantle. Earth Planet Sci Lett. 2019;511:213–222.
- Kupenko I, Aprilis G, Vasiukov DM, et al. Magnetism in cold subduction slabs at mantle transition zone depths. Nature. 2019;570:102–106.
- Kupenko I, Strohm C, McCammon C, et al. Time differentiated nuclear resonance spectroscopy coupled with pulsed laser heating in diamond anvil cells. Rev Sci Instrum. 2015;86:114501.
- Mao HK, Xu J, Struzhkin VV, et al. Phonon density of states of iron up to 153 Gigapascals. Science. 2001;292:914–916.