
 ?Mathematical formulae have been encoded as MathML and are displayed in this HTML version using MathJax in order to improve their display. Uncheck the box to turn MathJax off. This feature requires Javascript. Click on a formula to zoom.
ABSTRACT
We have measured the thermal diffusivity and conductivity of platinum and MgO periclase at high pressures (P) and high temperatures (T) by combining the pulsed light heating thermoreflectance technique with a laser-heated diamond anvil cell. The obtained thermal conductivity of platinum shows positive pressure and temperature dependences, reaching about 210 W/m/K at the highest P–T condition of 125 GPa and 1850 K. The thermal conductivity of periclase was determined up to 140 GPa and 1950 K, corresponding to the Earth's lowermost mantle, where the conductivity was about 90 W/m/K. Our measurements allow us to test models for the combined P–T dependence of the thermal conductivity of both metals and insulating materials up to Mbar pressures and thousands of kelvins.
1. Introduction
Quasi-static high pressure–temperature (P–T) experiments are being actively performed by combining high-pressure generators, such as a multi-anvil apparatus and a diamond anvil cell (DAC), with heating techniques using a metal (or semiconductor) heater and laser optics [Citation1]. In laser-heated DAC experiments, the thermal conductivities of the sample, laser absorber, and pressure medium strongly influence the temperature structure in the sample chamber [Citation2–4]. Therefore, information on the thermal conductivity of materials used in high-P–T experiments is essential for accurate temperature and pressure determination and for generating a homogeneous temperature field inside the sample chamber. In addition, determining the thermal conductivity of the Earth’s constituent materials is essential for understanding the dynamics and thermal evolution of the Earth.
Due to its structural stability and chemical inertia, platinum (Pt) has been widely used in high-pressure research as a pressure gauge (e.g. [Citation5,Citation6]) and laser absorber for high-temperature generation (e.g. [Citation7]). In addition, Pt has been used as an aid in determining the thermal conductivity of deep mantle minerals under high pressure [Citation8,Citation9]. Furthermore, since Pt is an unfilled d-band late transition metal, is paramagnetic, and has a close-packed structure at ambient and high P–T conditions, its transport properties at these conditions are expected to be similar to those of ϵ-Fe, which is considered to be the major constituent of the Earth’s inner core [Citation10]. Therefore, experiments measuring the thermal conductivity of Pt will facilitate the understanding of the thermophysical properties of the Earth's deep mantle and core. Free electrons and lattice vibrations are the main carriers of heat transport in metals. Carrier scattering due to lattice vibration is activated at high temperatures. Therefore, most pure metals have a negative temperature dependence on their thermal conductivities. The thermal conductivity of Pt exhibits a positive temperature dependence at ambient pressure [Citation11]. Pure metals that exhibit a positive temperature dependence of thermal conductivity are rare (only Pt, Pd, and several rare earth elements), and the physics of this property is still not fully understood [Citation11]. First-principles calculations have determined the thermal conductivity of Pt up to 200 GPa and 4800 K, suggesting that its temperature dependence remains positive at high pressures [Citation12]. In contrast, measurement of the high P–T thermal conductivity of Pt has been limited to about 60 GPa and 2000 K [Citation4,Citation13].
Magnesium oxide (MgO) is representative of the minerals that make up the rocky interior of the planet. For example, it is considered to be one of the main components of the Earth’s lower mantle. The P–T conditions of the lower mantle range from 25 GPa and >1900 K to 136 GPa and 3700 K [Citation14–16]. MgO periclase, a wide bandgap insulator, has a B1-type crystal structure up to several hundred GPa [Citation17,Citation18], whose properties are suitable for an internal pressure standard (e.g. [Citation19]). Therefore, the thermal conductivity of MgO periclase has been extensively studied [Citation20–34]. Ferropericlase, an Mg-rich member of (Mg,Fe)O, is considered to be the second most abundant mineral in the Earth’s lower mantle, and its thermal conductivity has considerable potential to influence the bulk thermal conductivity of the lower mantle, although its abundance is less than that of the bridgmanite [Citation35,Citation36].
Thermal conductivity measurements of MgO periclase in high-pressure experiments have not been realized at the deepest conditions of the Earth’s mantle. Katsura [Citation29] measured the thermal diffusivity of MgO up to 5 GPa and 1473 K using the Ångström method in a cylindrical geometry with a multi-anvil apparatus. The measurement conditions of their method have been extended to 14 GPa and 1273 K [Citation31], which is close to the conditions in the lower part of the Earth’s upper mantle. The pressure dependence of the thermal conductivity of MgO has been analyzed by numerous experimental and theoretical studies [Citation22–25,Citation27,Citation29,Citation31–34], including experiments conducted over the full range of pressure conditions in the Earth’s lower mantle [Citation27]. However, its temperature dependence under high-pressure conditions remains controversial in both experimental and theoretical studies [Citation23,Citation25,Citation29,Citation31,Citation33,Citation34].
We have recently developed a new apparatus for a high P–T thermal diffusivity (and conductivity) measurements [Citation4]. In this study, we measure the thermal diffusivity and conductivity of Pt and MgO periclase under P–T conditions relevant to a large part of the Earth’s mantle. Based on the experimental results, we formulate the pressure (or density) and temperature dependence of the thermal conductivity of Pt and MgO.
2. Methods
We used a laser-heated DAC of the symmetrical type with a 120-µm culet single-beveled or 300-µm flat diamond anvils. The samples used were Pt foil (The Nilaco Corporation) and MgO periclase single crystal (Crystal Base Co., Ltd.). The sample was loaded into the sample chamber at the center of the Re gasket with NaCl, which serves as both a pressure medium and a thermal insulator. The initial thickness of the Pt and MgO samples was ∼10 µm. The pressure was determined from the Raman shift of a diamond anvil [Citation37]. The temperature was determined from the radiation spectrum emitted by the sample. Uncertainties in the calibrated both pressure and temperature in this study were about 10%. The details of the method for estimating the sample temperature uncertainty were described in our previous paper [Citation4].
Thermal conductivity (κ) is a function of thermal diffusivity (D), density (ρ), and isobaric heat capacity (CP): κ = DρCP. We determined the thermal diffusivities of Pt and MgO (DPt and DMgO) using the pulsed light heating thermoreflectance (TR) method in a continuous-wave laser-heated DAC. Details of the technique and the data analysis for the TR measurement can be found in the literature [Citation4,Citation38]. The TR method allows the visualization of temperature changes on a sample surface over time. The heat diffusion through a Pt foil can be analyzed from the obtained transient temperature curve ((a)). The obtained curve was fitted with a theoretical curve based on the one-dimensional thermal conduction equation for the film thickness direction via pulse heating:
(1)
(1) where T(t) is the temperature,
is a constant, t is time, τ is the heat diffusion time through the sample, and γ is a fitting parameter describing the heat effusion into the pressure medium. Thus, the effect of thermal conduction of the pressure medium is accounted for by γ. The thermal diffusivity is determined from τ and the sample thickness (d): D = d2/τ. After the TR measurement, we recovered the Pt sample and prepared a sample section using a focused ion beam apparatus ((b)). The thickness of the Pt sample under high pressure was obtained by measuring the thickness of the sample cross-section and correcting for the effect of elastic deformation caused by the reduced pressure using an equation of state of Pt [Citation39]. In addition, the thermoelastic parameters of Pt determined by Matsui et al. [Citation39] were used to calculate its density and isobaric heat capacity at the conditions under which the TR measurements were performed.
Figure 1. Representative transient temperature curves and a cross-section image obtained in the same run. (a) The curves obtained at 121 GPa and 300 K and at 124 GPa and 1700 K. The black lines represent the obtained signals, and the red lines denote the fitting results obtained using Equation (1). (b) Cross-sectional SEM image of the Pt sample after the TR measurements. Representative transient temperature curves and a cross-section image for the Pt–MgO–Pt sample obtained in the same run. (c) The curves obtained at 130 GPa and 300 K and at 140 GPa and 1950 K. The black lines are the obtained signals, and the red lines are the fitting results obtained using Equation (1). (d) Cross-sectional SEM image of the Pt–MgO–Pt sample after the TR measurements.
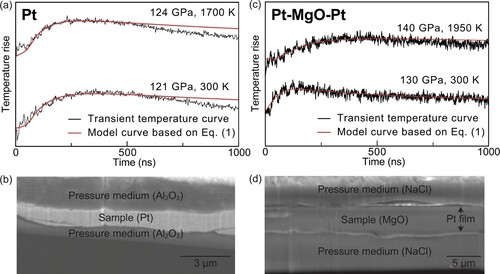
For MgO, the sample plate was coated on both sides with a sputtered Pt film for the TR measurement. Therefore, the obtained transient temperature curve shows heat propagation through MgO and the Pt film covering it ((c)). The obtained heat diffusion time τ using Equation (1) was analyzed as a three-layer heat diffusion model using the following equations [Citation40]:
(2)
(2)
(3)
(3)
where DPt is the thermal diffusivity of Pt; dMgO and dPt are the thicknesses of the MgO sample and Pt sputtered layer, respectively; and CMgO and CPt are the heat capacities per unit volume (C = ρCP) of MgO and Pt, respectively. They were estimated using the Debye approximation and the equations of state of Pt [Citation39] and MgO [Citation19]. In addtion, dMgO and dPt were determined from the thickness of the recovered sample and its elasticity as well as the case for the TR measurement of the Pt single layer ((d)). For the calculations of the MgO thermal diffusivity, we used the thermal diffusivity of Pt obtained here. In some runs, we collected the TR signals at 300 K before and after the high P–T TR measurements and compared the τ obtained from them. We confirmed that the τ of both Pt and Pt-MgO-Pt samples at 300 K does not change with heating, indicating that the plastic deformation caused by the laser heating is negligibly small. The above procedure of obtaining the thermal conductivity of minerals from the data obtained by the TR method has so far been carried out on various types of minerals with different sample thicknesses that we have used [Citation9,Citation27,Citation36,Citation38,Citation41–45].
3. Results and discussion
3.1. Thermal conductivity of Pt
We measured the thermal diffusivity and conductivity of the Pt sample up to 125 GPa and 1850 K ( and ). The experimental thermal diffusivity increases with pressure at 300 K. It also shows a very weak positive temperature dependence (a). The temperature dependence of the thermal conductivity of Pt shows a greater rate of increase with temperature than the diffusivity due to the effect of the increase in CP with temperature (b), which is in agreement with previous studies [Citation4,Citation11–13]. The obtained absolute values of the thermal conductivity of Pt are also consistent with the experimental results of previous studies [Citation4,Citation13]. At the highest temperature and pressure conditions of our experiments, 125 GPa and 1850 K, the thermal conductivity of Pt was 213.3 ± 44.5 W/m/K (b). Since the thermal conductivity of Pt at ambient conditions is about 70 W/m/K, the effect of temperature and pressure increases the thermal conductivity by about a factor of three.
Figure 2. Temperature dependence of the thermal diffusivity (a) and conductivity (b) of Pt at high pressures. Circles denote the results obtained here by the thermoreflectance method, red, 121 GPa; blue, 91 GPa; and yellow, 12 GPa, and those from our previous report [Citation4], green, 58 GPa and purple, 40 GPa. Our current and previous data are shown with closed and open circles, respectively. Open triangles indicate results obtained by the flash heating method [Citation16]: green, 55 GPa and purple, 35 GPa. Gray crosses indicate the recommended values at ambient pressure [Citation13]. Solid lines indicate our formulated thermal conductivity (Equation (4)). The colors of the solid lines represent the same pressures as the circles of the same color, and the gray line denotes the conductivity at 1 bar. Broken curves indicate the calculated thermal conductivity of Pt [Citation15]: red, 150 GPa; blue, 90 GPa; green, 60 GPa; purple, 40 GPa; yellow, 10 GPa; and gray, 0 GPa.
![Figure 2. Temperature dependence of the thermal diffusivity (a) and conductivity (b) of Pt at high pressures. Circles denote the results obtained here by the thermoreflectance method, red, 121 GPa; blue, 91 GPa; and yellow, 12 GPa, and those from our previous report [Citation4], green, 58 GPa and purple, 40 GPa. Our current and previous data are shown with closed and open circles, respectively. Open triangles indicate results obtained by the flash heating method [Citation16]: green, 55 GPa and purple, 35 GPa. Gray crosses indicate the recommended values at ambient pressure [Citation13]. Solid lines indicate our formulated thermal conductivity (Equation (4)). The colors of the solid lines represent the same pressures as the circles of the same color, and the gray line denotes the conductivity at 1 bar. Broken curves indicate the calculated thermal conductivity of Pt [Citation15]: red, 150 GPa; blue, 90 GPa; green, 60 GPa; purple, 40 GPa; yellow, 10 GPa; and gray, 0 GPa.](/cms/asset/c0a200ee-3abe-4f12-ab10-cd6138c55229/ghpr_a_2193892_f0002_oc.jpg)
Table 1. Experimental pressures (P), temperatures (T), heat diffusion times (τ), sample thicknesses (d), thermal diffusivity (D), densities (ρ), isobaric heat capacities (CP), and thermal conductivities (κ) of Pt.
McWilliams et al. [Citation13] proposed a model that describes the thermal conductivity of Pt (κPt) as a function of P and T: κPt = aP + bT + κ0 (a, b, and κ0 are constants). Here, we used the same form and determined the values of a, b, and κ0 from our current and previous κPt data and the recommended values at ambient pressure [Citation4,Citation11]. The revised model based on this study is as follows:
(4)
(4) All our obtained constants are smaller than those determined in McWilliams et al. [Citation13]. We believe that the credibility of the pressure coefficient (a) and the temperature coefficient (b) has increased due to the expansion of the experimental P–T ranges. Based on the result of the first-principles calculation, the thermal conductivity is approximately first-order correlated with the pressure, but near the melting point, the temperature dependence of the thermal conductivity changes from the previous temperature dependence and becomes weaker or changes to a negative tendency [Citation12]. However, no such change was observed here, where the maximum temperature remained at about 2000 K.
Pt can be an analogous material to highly compressed ϵ-Fe in terms of electron conduction properties (e.g. [Citation10]). The present results indicate that the thermal conductivity of Pt has a positive dependence under high pressure (b). This is consistent with all previous studies [Citation4,Citation11–13]. It has been observed that the thermal conductivity of ϵ-Fe at 50 GPa has a weak negative temperature dependence [Citation4]. It can be expected that the temperature derivative of the thermal conductivity of ϵ-Fe changes from negative to positive at a certain pressure above 50 GPa. Indeed, ab initio calculations showed a positive temperature dependence of the thermal conductivity of ϵ-Fe under the conditions of the Earth’s core [Citation46,Citation47].
3.2. Thermal conductivity of MgO
We measured the thermal diffusivity and conductivity of the MgO single crystal up to 140 GPa and 1950 K, with the highest temperature condition being 3170 K at 30 GPa (). Since MgO does not undergo a structural phase transition in the P–T range of the present experiments, the obtained thermal diffusivity showed a positive pressure dependence and a negative temperature dependence, similar to that of common insulating minerals ().
Figure 3. Thermal diffusivity of MgO at high P–T conditions. Triangles, ρ = 3.83 g/cm3 at 300 K (12 GPa); squares, ρ = 4.28 g/cm3 at 300 K (44 GPa); diamonds, ρ = 4.73 g/cm3 at 300 K (80 GPa); circles, ρ = 5.18 g/cm3 at 300 K (130 GPa). See for changes in experimental pressure due to the effect of thermal pressure during high-T TR measurements.
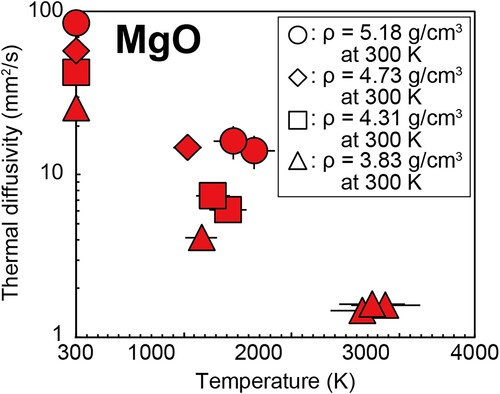
Table 2. Experimental pressures (P), temperatures (T), thermal diffusivity (D), densities (ρ), isobaric heat capacities (CP), and thermal conductivities (κ) of MgO.
The results of the thermal conductivity of MgO at room temperature are summarized in . Most of the values calculated in previous studies are higher than ours at any pressure [Citation23–25,Citation32]. Our values are in good agreement with the results of Stackhouse et al. [Citation33], but the black broken curve in is drawn based on an extrapolation of their results from 1000 to 2000 K, and it is not actually calculated at 300 K. Our obtained results are higher than the thermal conductivity of polycrystalline MgO [Citation27,Citation31] and similar to the previously determined conductivity of single crystal MgO by a different method than ours [Citation22]. The difference between the experimental and theoretical values may be related to the mean free path of MgO phonons, vacancies in the crystal structure, and/or lattice distortion of a compressed sample. In computational studies, the thermal conductivity is calculated assuming a perfect crystal. However, all real materials have vacancies in their structure that scatter phonons and reduce thermal conductivity, and uniaxial compression by a DAC applies differential stress to a sample and distorts its lattice, thus reducing the thermal conductivity of the sample. These factors have less effect on thermal conductivity at higher temperatures.
Figure 4. Thermal conductivity of MgO at 300 K as a function of pressure. Experimental data are shown as symbols. Red circles represent our results, open circles represent MgO single crystal [Citation22], open squares represent polycrystalline MgO [Citation27], and open triangles represent polycrystalline MgO [Citation31]. Our suggested density dependence based on Equation (5) and the theoretical data reported in literature are shown using solid curves: red represents this study, cyan represents Ref. [Citation23], green represents Ref. [Citation34], yellow represents Ref. [Citation25], purple represents Ref. [Citation24], and gray represents Ref. [Citation32]. The black broken curve is based on extrapolation from Ref. [Citation33].
![Figure 4. Thermal conductivity of MgO at 300 K as a function of pressure. Experimental data are shown as symbols. Red circles represent our results, open circles represent MgO single crystal [Citation22], open squares represent polycrystalline MgO [Citation27], and open triangles represent polycrystalline MgO [Citation31]. Our suggested density dependence based on Equation (5) and the theoretical data reported in literature are shown using solid curves: red represents this study, cyan represents Ref. [Citation23], green represents Ref. [Citation34], yellow represents Ref. [Citation25], purple represents Ref. [Citation24], and gray represents Ref. [Citation32]. The black broken curve is based on extrapolation from Ref. [Citation33].](/cms/asset/ac8cc26f-354e-47c2-a242-e1df1a87f24c/ghpr_a_2193892_f0004_oc.jpg)
Our results at high P–T conditions are summarized in . The obtained thermal conductivity of MgO was 284.6 ± 65.8 W/m/K at 130 GPa and 300 K and 88.5 ± 19.9 W/m/K at 140 GPa and 1950 K. Since MgO is a wide bandgap insulator, the effect of radiative heat conduction is negligible. Therefore, the experimental thermal conductivity of MgO represents the lattice thermal conductivity. The lattice thermal conductivity (κlatt) is often expressed as a function of T and ρ [Citation31]:
(5)
(5) where κref and ρref are the thermal conductivity and density at the reference pressure (Pref) and temperature (Tref), which has been used to formulate the experimental results [Citation31]. For Pref, Tref, κref, and ρref, we considered 0 GPa, 300 K, 55.0 W/m/K, and 3.58 g/cm3, respectively [Citation48]. Based on these values and our measurement results, we obtained m = 0.62 ± 0.06 and g = 4.4 ± 0.1. The present temperature dependence m = 0.62 ± 0.06 is more gradual than m = 0.76, which has been determined experimentally up to 14 GPa and 1270 K [Citation31]. These m values are consistent with the theoretical constraint T−x (0.5 ≤ x ≤ 1) [Citation49]. We determined the g value from the thermal conductivity of a single crystal MgO, while Manthilake et al. [Citation31] and Imada et al. [Citation27] evaluated the value from the thermal conductivity of a polycrystalline MgO. Note that the thermal conductivity of a polycrystalline MgO is smaller than that of a single crystal MgO [Citation22,Citation27] because the thermal resistance at grain boundaries potentially affects the thermal conduction in a polycrystalline sample [Citation50]. Our density dependence g = 4.4 ± 0.1 was consistent with that obtained in some previous studies [Citation22,Citation33] (), but some theoretical studies have shown higher density dependencies [Citation23–25]. The results of this study will help to tune the approximations in the existing theory.
Figure 5. Temperature dependence of the thermal conductivity of MgO with density of (a) 3.83 and 3.47 g/cm3, (b) 4.31 g/cm3, (c) 4.73 g/cm3, and (d) 5.18 g/cm3. Red circles represent our results. Theoretical data and our suggested density dependence based on Equation (5) are shown in curves in each panel. The symbols and curve colors correspond to those in .
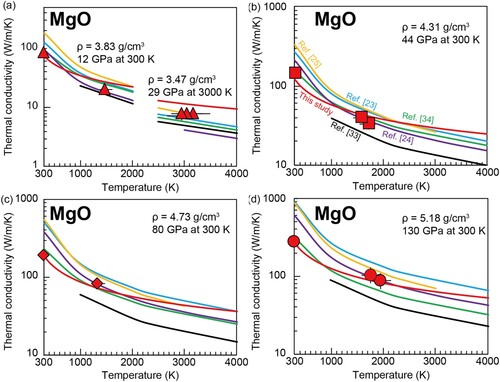
The thermal conductivity of the lowermost mantle controls the structure of the thermal boundary layer just above the CMB (e.g. [Citation9]). According to the model for MgO refined in this study (Equation 5), the lattice thermal conductivity of MgO at the CMB condition (136 GPa and 3700 K) is 51.8 (+10.5/−8.7) W/m/K, which is in the range of the previously proposed conductivity of MgO at the equivalent conditions (). In the lower mantle, it would exist as a ferropericlase in a solid solution with FeO, resulting in a decrease in lattice thermal conductivity due to the solid solution effect [Citation35,Citation36,Citation44]. In addition, the iron spin transition in ferropericlase also changes its conductivity [Citation35,Citation36]. To date, there are no measurements of the thermal conductivity of low-spin state ferropericlase under deep Earth's lower mantle conditions, but the method used in this study is suitable for this measurement and should be addressed in the future.
4. Conclusions
We have determined the high P–T thermal diffusivity and conductivity of Pt and MgO periclase using the pulsed light heating TR technique with a DAC. Our measurements of thermal conductivity of Pt up to 125 GPa and 1850 K allowed up to establish its P–T dependence as κ = 0.953P + 0.0137 T + 61.8 (W/m/K). The lattice thermal conductivity of MgO periclase, measured here to 140 GPa and 1950 K, followed . According to this model, at Earth’s CMB conditions, our estimated thermal conductivity of MgO periclase is 51.8 (+10.5/−8.7) W/m/K. Since Pt and MgO are commonly used materials in high-P–T experiments as pressure standard and pressure medium, the present results will help our understanding of the high-P–T behavior of condensed matter.
Acknowledgments
We thank two anonymous reviewers for their constructive comments that improved the quality of the manuscript.
Disclosure statement
No potential conflict of interest was reported by the author(s).
Data availability
The data that support the findings of this study are available from the corresponding author upon reasonable request.
Additional information
Funding
References
- Anzellini S, Boccato S. A practical review of the laser-heated diamond anvil cell for university laboratories and synchrotron applications. Crystals. 2020;10:459.
- Kavner A, Panero WR. Temperature gradients and evaluation of thermoelastic properties in the synchrotron-based laser-heated diamond cell. Phys Earth Planet Inter. 2004;143–144:527–539.
- Rainey ESG, Kavner A. Peak scaling method to measure temperatures in the laser-heated diamond anvil cell and application to the thermal conductivity of MgO. J Geophys Res. 2014;119:8154–8170.
- Hasegawa A, Yagi T, Ohta K. Combination of pulsed light heating thermoreflectance and laser-heated diamond anvil cell for in-situ high pressure-temperature thermal diffusivity measurements. Rev Sci Instrum. 2019;90:074901.
- Vohra YK, Ruoff AL. Static compression of metals Mo, Pb, and Pt to 272 GPa: comparison with shock data. Phys Rev B. 1990;42:8651–8654.
- Fratanduono DE, Millot M, Braun DG, et al. Establishing gold and platinum standards to 1 terapascal using shockless compression. Science. 2021;372:1063–1068.
- Murakami MH, Kawamura KK, Sata N, et al. Post-perovskite phase transition. Science. 2004;304:855–858.
- Goncharov AF, Beck P, Struzhkin VV, et al. Thermal conductivity of lower-mantle minerals. Phys Earth Planet Inter. 2009;174:24–32.
- Ohta K, Yagi T, Taketoshi N, et al. Lattice thermal conductivity of MgSiO3 perovskite and post-perovskite at the core–mantle boundary. Earth Planet Sci Lett. 2012;349–350:109–115.
- Ezenwa IC, Yoshino T. Electrical resistivity of solid and liquid Pt: insight into electrical resistivity of ϵ-Fe. Earth Planet Sci Lett. 2020;544:116380.
- Ho CY, Powell RW, Liley PE. Thermal conductivity of the elements. J Phys Chem Ref Data. 1972;1:279–421.
- Gomi H, Yoshino T. Resistivity, seebeck coefficient, and thermal conductivity of platinum at high pressure and temperature. Phys Rev B. 2019;100:214302.
- McWilliams RS, Konôpková Z, Goncharov AF. A flash heating method for measuring thermal conductivity at high pressure and temperature: application to Pt. Phys Earth Planet Inter. 2015;247:17–26.
- Katsura T. A revised adiabatic temperature profile for the mantle. J Geophys Res. 2022;127:e2021JB023562.
- Brown JM, Shankland TJ. Thermodynamic parameters in the earth as determined from seismic profiles. Geophys J Inter. 1981;66:579–596.
- Tateno S, Hirose K, Sata N, et al. Determination of post-perovskite phase transition boundary up to 4400 K and implications for thermal structure in D” layer. Earth Planet Sci Lett. 2009;277:130–136.
- McWilliams RS, Spaulding DK, Eggert JH, et al. Phase transformations and metallization of magnesium oxide at high pressure and temperature. Science. 2012;338:1330–1333.
- Coppari F, Smith RF, Eggert JH, et al. Experimental evidence for a phase transition in magnesium oxide at exoplanet pressures. Nat Geosci. 2013;6:926–929.
- Tange Y, Nishihara Y, Tsuchiya T. Unified analyses for P-V-T equation of state of MgO: A solution for pressure-scale problems in high P-T experiments. J Geophys Res. 2009;114:B03208.
- Beck P, Goncharov AF, Struzhkin VV, et al. Measurement of thermal diffusivity at high pressure using a transient heating technique. Appl Phys Lett. 2007;91:181914.
- Brown JM. Interpretation of the D” zone at the base of the mantle: dependence on assumed values of thermal conductivity. Geophys Res Lett. 1986;13:1509–1512.
- Dalton DA, Hsieh WP, Hohensee GT, et al. Effect of mass disorder on the lattice thermal conductivity of MgO periclase under pressure. Sci Rep. 2013;3:2400.
- de Koker N. Thermal conductivity of MgO periclase at high pressure: implications for the D” region. Earth Planet Sci Lett. 2010;292:392–398.
- Dekura H, Tsuchiya T. Ab initio lattice thermal conductivity of MgO from a complete solution of the linearized Boltzmann transport equation. Phys Rev B. 2017;95:184303.
- Haigis V, Salanne M, Jahn S. Thermal conductivity of MgO, MgSiO3 perovskite and post-perovskite in the earth's deep mantle. Earth Planet Sci Lett. 2012;355–356:102–108.
- Hofmeister AM. Thermal diffusivity and thermal conductivity of single-crystal MgO and Al2O3 and related compounds as a function of temperature. Phys Chem Minerals. 2014;41:361–371.
- Imada S, Ohta K, Yagi T, et al. Measurements of lattice thermal conductivity of MgO to core-mantle boundary pressures. Geophys Res Lett. 2014;41:4542–4547.
- Kanamori H, Fujii N, Mizutani H. Thermal diffusivity measurement of rock-forming minerals from 300° to 1100°K. J Geophys Res. 1968;73:595–605.
- Katsura T. Thermal diffusivity of periclase at high temperatures and high pressures. Phys Earth Planet Inter. 1997;101:73–77.
- Manga M, Jeanloz R. Thermal conductivity of corundum and periclase and implications for the lower mantle. J Geophys Res. 1997;102:2999–3008.
- Manthilake GM, de Koker N, Frost DJ, et al. Lattice thermal conductivity of lower mantle minerals and heat flux from earth's core. Proc Natl Acad Sci U S A. 2011;108:17901–17904.
- Song Y, He K, Sun J, et al. Effects of iron spin transition on the electronic structure, thermal expansivity and lattice thermal conductivity of ferropericlase: a first principles study. Sci Rep. 2019;9:4172.
- Stackhouse S, Stixrude L, Karki BB. Thermal conductivity of periclase (MgO) from first principles. Phys Rev Lett. 2010;104:208501.
- Tang X, Dong J. Lattice thermal conductivity of MgO at conditions of earth's interior. Proc Natl Acad Sci U S A. 2010;107:4539–4543.
- Hsieh WP, Deschamps F, Okuchi T, et al. Effects of iron on the lattice thermal conductivity of earth's deep mantle and implications for mantle dynamics. Proc Natl Acad Sci U S A. 2018;115:4099–4104.
- Ohta K, Yagi T, Hirose K, et al. Thermal conductivity of ferropericlase in the earth's lower mantle. Earth Planet Sci Lett. 2017;465:29–37.
- Akahama Y, Kawamura H. High-pressure Raman spectroscopy of diamond anvils to 250 GPa: method for pressure determination in the multimegabar pressure range. J Appl Phys. 2004;96:3748–3751.
- Yagi T, Ohta K, Kobayashi K, et al. Thermal diffusivity measurement in a diamond anvil cell using a light pulse thermoreflectance technique. Meas Sci & Technol. 2011;22:024011.
- Matsui M, Ito E, Katsura T, et al. The temperature-pressure-volume equation of state of platinum. J Appl Phys. 2009;105:013505.
- Baba T. Analysis of One-dimensional heat diffusion after light pulse heating by the response function method. Jpn J Appl Phys. 2009;48:05EB04.
- Okuda Y, Ohta K, Yagi T, et al. The effect of iron and aluminum incorporation on lattice thermal conductivity of bridgmanite at the earth’s lower mantle. Earth Planet Sci Lett. 2017;474:25–31.
- Okuda Y, Ohta K, Sinmyo R, et al. Effect of spin transition of iron on the thermal conductivity of (Fe, Al)-bearing bridgmanite. Earth Planet Sci Lett. 2019;520:188–198.
- Okuda Y, Ohta K, Hasegawa A, et al. Thermal conductivity of Fe-bearing post-perovskite in the earth’s lowermost mantle. Earth Planet Sci Lett. 2020;547:116466.
- Hasegawa A, Ohta K, Yagi T, et al. Composition and pressure dependence of lattice thermal conductivity of (Mg, Fe)O solid solutions. C R Geoscience. 2019;351:229–235.
- Zhang Z, Zhang D-B, Onga K, et al. Thermal conductivity of CaSiO3 perovskite at lower mantle conditions. Phys Rev B. 2021;104:184101.
- Pozzo M, Davies C, Gubbins D, et al. Thermal and electrical conductivity of solid iron and iron–silicon mixtures at earth's core conditions. Earth Planet Sci Lett. 2014;393:159–164.
- Kleinschmidt U, French M, Steinle-Neumann G, et al. Electrical and thermal conductivity of fcc and hcp iron under conditions of the earth’s core from ab initio simulations. Phys Rev B. 2023;107:085145.
- Marsh SP. LASL shock Hugoniot data. Berkeley: Univ of California Press; 1980.
- Roufosse MC, Klemens PG. Lattice thermal conductivity of minerals at high temperatures. J Geophys Res. 1974;79:703–705.
- Smith DS, Fayette S, Grandjean S, et al. Thermal resistance of grain boundaries in alumina ceramics and refractories. J Am Ceram Soc. 2003;86:105–111.