
ABSTRACT
A multianvil cell assembly with octahedral edge length 25 mm has been adapted for high pressure investigations involving water-rich environments up to 6.5 GPa and 400°C. Water-rich samples are confined in Teflon containers with a volume up to 300 mm3. Applicability tests were performed between 250 and 400°C by investigating the transformation of amorphous titania particles close to the rutile–TiO2-II (∼5 GPa) phase boundary, and the transformation of amorphous silica particles close to the quartz–coesite (∼2.5 GPa) and coesite–stishovite (∼7 GPa) phase boundaries. The performed experiments employed 25.4 mm tungsten carbide anvils with a truncation edge length of 15 mm. The sample pressure at loads approaching 820 t was estimated to be around 6.5 GPa. The large volume multianvil cell is expected to have broad and varied application areas, ranging from the simulation of geofluids to hydrothermal synthesis and conversion/crystal growth in aqueous environments at gigapascal pressures.
1. Introduction
Hydrothermal processes refer to heterogeneous reactions in aqueous media at elevated pressures and temperatures, i.e. above 1 bar and 100°C [Citation1]. Such reactions play an important role in geochemistry [Citation2] and for the manufacture of advanced ceramic materials where the hugely modified chemical reactivity of usually insoluble reagents is exploited [Citation3]. Products are crystallized directly from aqueous solution under the prevailing conditions and – depending on conditions – can be obtained as bulk single crystals, fine particles, or nanoparticles. Hydrothermal synthesis has been targeting a wide range of materials, including piezoelectric crystals (like α-quartz and lead zirconate titanate), wide band gap semiconductors (like ZnO), numerous nanocrystalline transition metal oxides with catalytic and magnetic properties (e.g. TiO2, Co3O4, NiO, Fe2O3, Fe3O4, CrO2) [Citation1,Citation3,Citation4], and, importantly, also microporous MOFs and zeolites for which hydrothermal synthesis often provides good control of particle morphologies [Citation5].
In laboratory settings hydrothermal synthesis typically takes place in sealed stainless steel vessels (autoclaves) whereby temperatures above the boiling point will generate autogenous pressure [Citation6]. Samples are encapsulated in a PTFE (Teflon) environment, which can withstand the acidic or alkaline conditions that are frequently required. Convenient temperature and pressure ranges are from 110 to ∼350°C and from a couple of bar up to several hundred bar, respectively [Citation4,Citation6]. However, water can exist at very high pressures and temperatures, and it is interesting to imagine the extension of hydrothermal synthesis to extreme conditions involving gigapascal pressures (). Water’s physicochemical properties such as autoionization constant, dielectric constant, and viscosity are changed drastically [Citation7] and significant reactivity of water has been predicted for the dense hot state [Citation8]. Because of water’s altered properties one can expect large changes in thermodynamic relations that are key for hydrothermal synthesis (e.g. solubilities, mixing behaviors, surface-fluid interactions) as well as for rates of reactions and phase transitions (e.g. through modified surfaces). The properties of extreme water (> 1 GPa) have been mainly estimated from computational studies and thus remain largely uncharted territory [Citation9]. So are the prospects for exploiting this medium for materials synthesis.
Figure 1. p,T phase diagram of water according to [Citation17]. Phase boundaries are indicated by solid lines. The critical point (p = 221 bar (22.1 MPa), T = 374°C) is marked with a ‘c’. The pressure range for various devices for hydrothermal investigations is indicated at the top.
![Figure 1. p,T phase diagram of water according to [Citation17]. Phase boundaries are indicated by solid lines. The critical point (p = 221 bar (22.1 MPa), T = 374°C) is marked with a ‘c’. The pressure range for various devices for hydrothermal investigations is indicated at the top.](/cms/asset/2ea22544-ed35-498e-943c-2800c910f9b2/ghpr_a_2230348_f0001_oc.jpg)
The extension of hydrothermal synthesis to gigapascal conditions requires piston cylinder (PC) or anvil devices driven by large volume presses (cf. ). PC devices connect to the pressure range of sealed vessels and may be operated up to 3 GPa with cells manufactured from chemically inert Teflon. Sample volumes (around 2.5 cm3) are large enough to allow the addition of a magnetic stirring function [Citation10]. Using anvil devices, pressures up to 10 GPa have been previously applied in conjunction with a water-rich environment [Citation11–16]. These experiments concerned single phase transitions/recrystallizations where samples were enclosed in welded noble metal capsules with volumes below 100 mm3. Such small volumes create difficulties in setting up more advanced reaction schemes (involving e.g. multiple components, mineralizers, buffered pH) and in obtaining sufficient amounts of sample for comprehensive ex-situ characterization of chemical and physical properties of reaction products.
Here we describe a 6–8 type multianvil (MA) cell assembly dedicated to hydrothermal synthesis and conversions up to 6.5 GPa. We show that inexpensive and inert Teflon containers familiar from vessel and PC experiments can be employed at temperatures up to 400°C and provide sample volumes up to 300 mm3.
2. Description of the cell assembly
The cell assembly is based on octahedra with edge length of 25 mm and is intended to be used with WC anvils that have a truncation edge length of 15 mm. The overall design, as shown in , follows the earlier described 25/15 large volume cell assembly by Stoyanov et al. [Citation18]. The major difference is that the MgO octahedron/pressure medium is replaced by mullite, which simplifies the cell design and also makes the cell more cost-effective. In addition, the dimensions of some parts of the Stoyanov et al. cell were reconsidered and adjusted after extensive testing.
Figure 2. Cross section showing design of the 25 mm high-pressure cell.
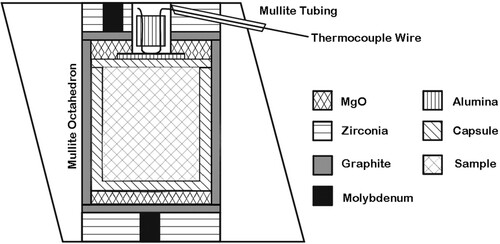
Mullite (3Al2O3 • 2SiO2) has favorable mechanical and thermal properties, in particular a low thermal expansion and conductivity from room temperature up to at least 1200°C [Citation19], and its bulk modulus is comparable to that of MgO [Citation20]. Mullite has been employed earlier as pressure medium in MA assemblies for in situ synchrotron studies in order to replace highly X-ray absorbing zirconia as thermal insulator [Citation21,Citation22]. Similarly, for the proposed cell a bulky ZrO2 insulating sleeve is abandoned and the heater directly inserted into the central hole of the mullite octahedron. The heater sleeve hosts the sample capsule, which is sandwiched between two MgO discs.
At room temperature mullite can be compressed to about 20 GPa above which amorphization is observed [Citation23]. However, at simultaneous high pressure (>6 GPa) and high temperature (>1000°C) conditions mullite breaks down to form silica (coesite) and alumina [Citation21]. When used as a pressure medium in MA assemblies this will cause a loss of thermal insulation and a drop in pressure. While the limited p,T stability of mullite may be concerning, we believe that the application range of the proposed assembly will fall well within its stability field. Firstly, the 25/15 cell presented here is dedicated for hydrothermal studies involving comparably low temperatures (up to 400°C using Teflon sample capsules and perhaps 800°C using Ag capsules). Secondly, when operating the cell with laboratory presses with 1000 t load capacity, maximum pressures with a 25/15 assembly are typically around 7 GPa.
2.1. Gasketing and octahedra
The gaskets, milled from pyrophyllite blocks by Bar-lo, Inc., were designed so that the carbide truncations would just touch the octahedron when assembled with the gaskets. Two gasket types, a long and a short, have dimensions given in . When using 25.4 mm WC cubes, the shape of long gaskets has to be slightly modified in order to fit the cube dimension, see inset in .
Table 1. Gasket dimensions.
Mullite octahedra with a porosity near 30% were injection-molded with the central hole and thermocouple grooves already in them (Ceramco, Center Conway, NH; material MUL6, first molded and then sintered at 1500°C). Specifications are given in . Since the porosity is higher than that of MgO octahedra used in other cell assembly types in our lab (20%), a somewhat reduced pressure efficiency when compared to prior trials can be expected.
Table 2. Dimensions and weights of the molded octahedra. The standard deviations are based on measurements of 40 randomly selected pieces.
2.2. Inner parts of the assemblies
The inner parts of the assembly are shown in and their dimensions are summarized in . The maximum length of the sample capsule is 10 mm. The bottom and the top of the capsule are surrounded by MgO discs of which the top one is recessed. The recess hosts a thin alumina disc, which protects the thermocouple junction and sample capsule from mutual damage. The bottom and the top of the cell are concluded with zirconia end-sleeves, which host molybdenum electrical wire leads. Samples are heated by passing a current through the cylindrical graphite furnace via the molybdenum leads in the end sleeves while in contact with the upper and lower tungsten carbide anvils. Due to the location of the thermocouple, the molybdenum electrical lead is placed off-centered in the top-end sleeve, see .
Figure 3. Photograph of cell assembly parts and Teflon sample capsules. (a). (1) Mullite octahedron. (2)Thermocouple made from W5%Re and W26%Re wires, 4-hole alumina tube, two mullite tubing per wire, and Teflon tubing. (3) From top to bottom, graphite furnace sleeve, furnace top with hole, and furnace bottom. (4) From top to bottom, alumina capsule-TC spacer, MgO bottom disc, MgO top disc with hole. (5) From top to bottom, bottom end sleeve, top end sleeve with grooves. (6) Two Mo electrical leads. Dimensions of cell assembly parts are given in and . Dimensions of sample capsules (b) and (c) are given in (a) and (b) respectively.
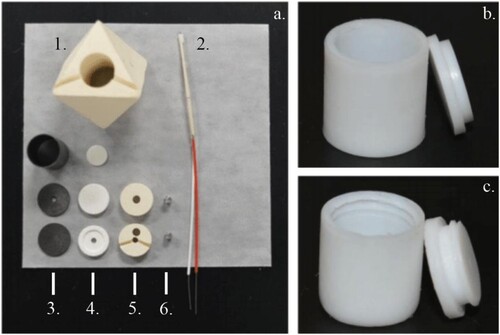
Table 3. Dimensions of the inner parts of the 25/15 cell.
2.3. Thermocouple
The temperature of the sample is measured by a thermocouple located on the top of the sample capsule. The thermocouple was prepared by crossing 0.2 mm in diameter W5%Re – W26%Re wires (thermocouple type C; manufacturer Concept Alloys, calibrated). The thermocouple is axially inserted into the cell to the top of the sample capsule by means of 4-hole alumina tubing. The tubing is precisely cut at 3 mm to ensure reproducible thermocouple placement. Once the thermocouple is placed on top of the capsule, the wires are bent apart and placed in mullite insulation, which is passed through straight grooves in the top end sleeve and the octahedron (cf. ). Then, the wires are bent once again and pass out along the (111) axis through a groove in the side of one of the short gaskets. Inside the pyrophyllite gasket, wires are surrounded by a second piece of mullite tubing. The mullite tubing was pre-cut with a length of 17 (inside octahedron) and 9 mm (inside gasket) and at a 45-degree angle in order to protect the wire at the two ends. Red and white Teflon tubing are placed around the wires to help differentiate positive and negative wires, and to protect the wires.
2.4. Sample capsules
Teflon is the material of choice for sample capsules in hydrothermal applications using vessel (Teflon liners) and PC devices because of a range of unique properties, such as chemical inertness even in corrosive environments, a high dielectric strength and a high mechanical stability/low coefficient of friction at temperatures up to 270–300°C. Therefore it was deemed important to also employ Teflon capsules when going to higher pressures with a 6–8 MA device. Both the material properties of Teflon and the corrosive behavior of extreme water at multiple gigapascal pressures are poorly known. The capsule has to safely confine the water-rich sample and keep it without significant loss at elevated temperature (several hundred°C) over prolonged periods of time (hours). At the same time sample volumes should be as large as possible.
Likhacheva et al. investigated Teflon at high pressure, high temperature conditions by Raman spectroscopy and found it stable with respect to graphitization within the range of 2–6 GPa at 500°C and up to 12 GPa at 400°C [Citation24]. Yet, when considering Teflon as capsule material for water-rich samples at gigapascal pressures these conditions appear too harsh. Rather than graphitization the integrity of Teflon’s mechanical/structural properties are important. Depending on the solubility of reactants and applied p,T conditions the sequence of compression – heating – cooling – decompression may involve two freezing-unfreezing cycles with sudden sample volume changes. These sudden volume changes require the sample capsule to maintain its structural integrity in order to contain the sample.
We present two versions for Teflon capsules, cf. , (b) and (c), and , (a) and (b): (1) a thin-walled capsule with a tight-fit slip lid for use at low pressures, up to 3.5 GPa, which has an effective volume of about 300 mm3 and (2) a reinforced capsule with a threaded lid for pressures up to 6.5 GPa with an effective volume of 240 mm3. Both capsules will work at temperatures up to 400°C, provided that heating times do not exceed 8 h. Capsules were manufactured from 13 mm diameter Teflon rod (Goodfellow). Prior use, machined capsules were annealed for 24 h at 125°C. Teflon sample capsules are directly inserted into the graphite heater sleeve of the 25/15 assembly.
Figure 4. Diagram of three proposed sample capsules. Units are given in mm. (a) Thin-walled Teflon capsule (cf. Figure 3b). (b) Reinforced Teflon capsule (cf. Figure 3c). (c) Suggested capsule for high temperature applications: an inner capsule made of silver (dark gray) is placed inside an outer capsule made of boron nitride (light gray) in order to prevent the silver from touching the graphite furnace. The silver capsule consists of a cylinder and two lids, which have been welded shut in order to ensure an airtight seal.
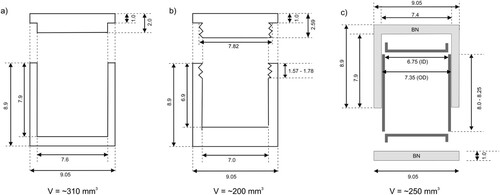
For high temperature hydrothermal applications (i.e. above 400°C) we suggest using inert metal capsules. Silver is preferred from a cost perspective – and may be applied at temperatures up to 800°C – but its inertness is limited [Citation25]. A slight modification of the assembly, shown in (c), will allow accommodation of welded metal (silver) capsules.
3. Operation of the cell assembly
The cell assembly was tested in a Walker-style multianvil system [Citation26] installed at Arizona State University with tungsten carbide anvils with edge length of 25.4 mm (WC cubes sourced from Fansteel Carbide Company). 25 experiments were performed with two sets of cubes, using compression loads between 200 and 825 t, temperatures between 250 and 400°C and heating times up to 8 h. During these experiments not a single cube was lost or even damaged which may be attributed to the comparatively low operation temperatures.
For our test experiments samples were compressed (at room temperature) with an approximate rate of 0.3–0.4 GPa/h, which was deemed necessary in order to not jeopardize the mechanical stability of the Teflon capsules. Then samples were heated to target temperature over periods between 60 to 90 min with a heating rate of 4–5°C/min and heated for durations between 2 and 8 h. Typically, target temperatures could be stably maintained to within a few degrees of the set-point with a Eurotherm 2404 programmable controller connected to the thermocouple. The power consumption of the furnace is rather low (150–250 W in the employed p,T range), in agreement with the description of the original assembly [Citation18]. The axial thermal gradient for the 25/15 assembly was specified as 6°C/mm at 500°C and referring to sintered MgO filling the sample space [Citation18]. For water-rich samples and at temperatures typically below 400°C we expect an even smaller, probably negligible gradient. Samples were cooled to room temperature over periods between 15–30 mins.
During decompression we frequently noticed a pressure drop toward the end, below 1 GPa, (cf. supporting information) which was attributed to a ‘soft blowout' caused by the melting of ice. At these low pressures the assembly may not be tightly confined anymore by the surrounding gaskets/cubes and the sudden volume expansion upon melting can rupture the Teflon sample capsule leading to a partial loss of sample. Soft blowouts can be largely prevented by using very slow decompression rates and/or performing decompression at elevated temperature (100°C). Here the solid – liquid transition occurs at higher pressures (2.5 GPa) where the assembly still is tightly enclosed by the gaskets/cubes.
4. Results and discussion
Our test experiments targeted (1) the conversion of amorphous silica to quartz and coesite at around 2.5 GPa. (2) the conversion of amorphous titania to rutile and TiO2-II at 5–5.5 GPa, and (3) the conversion of amorphous silica to coesite and stishovite at around 7 GPa. These conversions are known to be strongly promoted in a hydrothermal environment and the phase boundaries of quartz/coesite, rutile/TiO2-II, and coesite/stishovite stretch across the expected pressure application range of the proposed 25/15 assembly. shows the calibration curves of the original 25/15 assembly (based on MgO pressure medium/octahedron) in relation with the considered systems/transformations. Note, that the test experiments do not correspond to a calibration of the 25/15 ‘hydrothermal' assembly.
Figure 5. Room and high temperature (1200°C) calibration curves (upper and lower curves, respectively) for the original 25/15 assembly (taken from [Citation18]). The estimated pressure-load relation for the hydrothermal assembly runs in between. The experiments listed in are indicated as vertical arrows. Horizontal arrows indicated transition pressures at 350°C for the systems quartz-coesite [Citation30], rutile-TiO2-II [a] = Akaogi et al. [Citation36], [b] = Withers et al. [Citation37], and coesite-stishovite [Citation40].
![Figure 5. Room and high temperature (1200°C) calibration curves (upper and lower curves, respectively) for the original 25/15 assembly (taken from [Citation18]). The estimated pressure-load relation for the hydrothermal assembly runs in between. The experiments listed in Table 4 are indicated as vertical arrows. Horizontal arrows indicated transition pressures at 350°C for the systems quartz-coesite [Citation30], rutile-TiO2-II [a] = Akaogi et al. [Citation36], [b] = Withers et al. [Citation37], and coesite-stishovite [Citation40].](/cms/asset/21ec2165-408e-4dbb-8caa-754293ed1bc2/ghpr_a_2230348_f0005_oc.jpg)
Starting materials were amorphous silica and titania particles, which were prepared according to [Citation27] and [Citation28], respectively. Details on the synthesis and characterization of these materials are given as supporting information. Teflon sample capsules were typically prepared by first loading 100–120 mg water (milli-Q, type1, Merck) and then adding portion wise the amorphous particles (about 100 mg SiO2 and about 130 mg TiO2) while stirring with a stainless steel needle until a thick slurry was obtained. Considering the water content of the oxide precursor (∼30% for TiO2 and ∼10% for SiO2 (cf. Figure S1)), the molar ratios were approximately SiO2:H2O = 1:5 and TiO2:H2O = 1:6. The solubility of SiO2 and TiO2 is very small. Thus we expected that the p,T behavior of the water component follows largely that of ‘pure' water [Citation29]. lists the experiments which are discussed in more detail in the following. A complete run table is given as supporting information (Table S1).
Table 4. List of experiments as discussed in this work.
4.1. Quartz and coesite at 2.4–2.5 GPa and 350°C
The quartz – coesite transition and phase line appears to be well investigated. Bohlen et al. and Bose et al. performed equilibration experiments between 350 and 1000°C [Citation30] and between 500 and 1200°C [Citation31], respectively, using polycrystalline polymorph mixtures. The obtained p,T transition boundaries from the two investigations were very similar, essentially running parallel, with the Bose et al. one shifted by about 0.15 GPa to higher pressures. It is well known that the presence of water promotes quartz/coesite equilibration at low temperatures (below 600°C) [Citation32,Citation33], yet polycrystalline samples would still require durations on the order of days [Citation29]. In contrast, in a high pressure hydrothermal environment amorphous SiO2 converts into quartz and coesite (via intermediate quartz) within hours and at temperatures as low as 190°C [Citation34,Citation35].
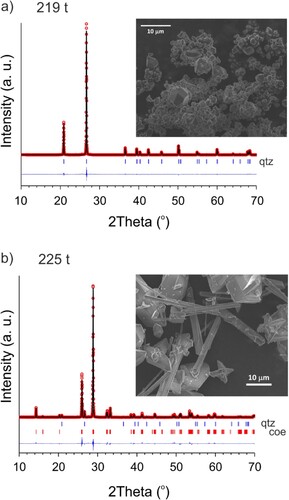
We report amorphous silica crystallization experiments targeting the quartz/coesite boundary at 350°C and using an annealing time of 3.5 h. At this temperature the quartz/coesite boundary is at 2.46 GPa according to Bohlen et al. and at 2.62 GPa according to Bose et al.. We also note that the ice-VII melting point at this pressure is around 100°C [Citation29]. We observed a sharp transition between the loads 219 and 225 t, the former producing a single-phase quartz ((a)) and the latter a near single-phase coesite sample ((b)). This fits the room-temperature calibration curve of the original assembly at around 2.5 GPa (cf. ). The quartz sample appears segregated into small, 0.2–0.3 µm sized, crystallites and bulkier crystals which are significantly larger than 1 µm having well-defined euhedral shape with distinguished faces, which is typical of Ostwald ripening. Following the Ostwald rule, the conversion of amorphous SiO2 in the coesite stability field would initially produce (nanocrystalline) quartz, from which coesite evolves. The near single-phase coesite sample shows crystals with two different morphologies, needle shaped and bulky with sizes up to 10 µm. It can be expected that at pressures around 2.5 GPa well crystallized coesite can be produced at temperatures below 200°C (and rather close to water solidification).
Figure 6. Observed (circles) and calculated (line) powder X-ray diffraction (PXRD) patterns of the SiO2 219 t/350°C sample (a) and the 225 t/350°C sample (b) after Rietveld refinement. The insets show SEM images of these samples. The sample in (a) is single-phase quartz, the sample in (b) is 96.9(4) wt.% coesite and 3.1(1) wt.% quartz. The PXRD patterns were collected with Cu-Kα radiation.
4.2. Rutile and TiO2-II at 5–6 GPa and 250–400°C
The rutile-TiO2-II phase boundary has been investigated by Akaogi et al. and Withers et al. between 500 and 900°C [Citation36] and between 500 and 1200°C [Citation37], respectively, using polycrystalline polymorph mixtures. The proposed phase lines deviate significantly which has been attributed to extreme sluggishness of the rutile-TiO2-II transition below 700°C. To improve kinetics, Withers et al performed their equilibration experiments in the presence of water (5 wt.%). Yet equilibration times were on the order of a day. Spektor et al. reported appreciable transformation rates (2 h) for the rutile-TiO2-II conversion at 6 GPa and 650°C [Citation38]. The phase boundary between rutile and TiO2-II has also been determined from thermodynamic calculations [Citation39,Citation40]. The results by Yong et al. [Citation39] align rather well with the Akaogi boundary [Citation36], whereas the results by Kojitani et al. [Citation40] are more in agreement with the Withers et al. boundary [Citation37].
We report amorphous titania crystallization experiments targeting the rutile-TiO2-II boundary at 250–400°C and using annealing times between 6 and 7 h. When extrapolating the phase lines by Akaogi et al. and Withers et al., the rutile/TiO2-II boundary at 350°C is at about 5.0 and 3.2 GPa, respectively, see . Ice-VII melting is near 250°C at 5 GPa [Citation29]. We observed small amounts of TiO2-II (ca. 10 wt.% phase fraction next to rutile) in initial experiments where we applied loads 445–480 t (which according to the room temperature calibration of the original assembly would translate to a pressure range 4.5–5 GPa), temperatures in a range 250–350°C, and annealing times around 3 h. The TiO2-II phase fraction appeared remarkably similar despite the varying p and T conditions.
Significantly increased TiO2-II phase fractions were then observed at loads >550 t (experiments were performed at 565, 607, and 660 t, cf. ). The product obtained at 660 t, 350°C and 6 h corresponded to near single-phase TiO2-II (96.6(9) wt.%, ). SEM shows segregation into larger 0.5–1 micron-sized well faceted crystals and smaller-sized (0.2–0.3 µm sized) pebble-shaped crystallites, typical of Ostwald ripening. The TiO2-II phase fraction of the product obtained at 565 t, 350°C and 6 h is considerably lower, 64.1(9) wt.%, whereas the one at 607 t and 400°C and 6 h again appeared almost completely converted (91.0(9) wt.% TiO2-II), see supporting information for details.
Figure 7. Observed (circles) and calculated (line) PXRD patterns of the TiO2 659 t/350°C sample after Rietveld refinement. The difference is the line at the bottom (R = 5.71, Rf = 7.52, Chi2 = 0.949). The weight fraction ratio TiO2-II/rutile is 96.6(9)/3.4(5). The inset shows a SEM image of this sample. The PXRD pattern was collected with Cu-Kα radiation.
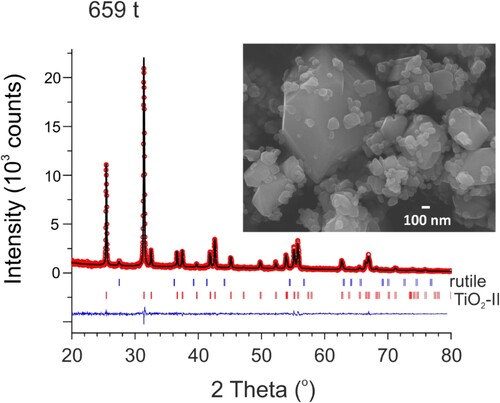
We suspect that the amorphous TiO2 precursor initially transforms into rutile upon compression (according to the Ostwald rule) and if rutile crystals are sufficiently small (i.e. nano-sized) TiO2-II conversion may proceed without significant kinetic hindrance in the TiO2-II phase field. However, if rutile crystals grow too large the transition will become sluggish and higher pressures and/or temperatures are needed for appreciable kinetics. Given the uncertainty of the rutile-TiO2-II phase boundary below 600°C we estimate that the loads of 565 and 659 t correspond to around 5.3 and 6 GPa, respectively. We believe that with longer duration times the runs at 565, 607, and 660 t should have resulted in single-phase TiO2-II samples, which would represent the mildest conditions reported for manufacturing single-phase TiO2-II. In the end, the extrapolated phase lines by Akaogi et al. and Withers et al. do not allow a good assessment of the pressure efficiency of the hydrothermal cell in the pressure range 4–5 GPa and, vice versa, our experiments do not give more insight into the rutile-TiO2-II phase boundary.
4.3. Coesite at around 6.5 GPa and 300–350°C
Similar to the rutile-TiO2-II transition, the SiO2 coesite-stishovite transition is not observed below a certain threshold temperature at dry conditions. In a recent work, Ono et al. could bracket the boundary between 927–1327°C [Citation41]. In contrast, it has been shown that the hydrothermal treatment of silica glass near 10 GPa produces hydrous stishovite (h-stishovite) at remarkably low temperatures (350–550°C), which stretch into the solid ice-VII region [Citation14]. In h-stishovite up to 5 at.% of Si are replaced by 4 protons, Si1−xH4xO2 (x up to 0.05) [Citation15]. The mechanism behind the formation of h-stishovite is not clear, but it appears that water is incorporated at the same time coesite with tetrahedrally coordinated Si transforms to denser stishovite. Thus, extreme water acts simultaneously as a catalyst in the coesite-stishovite transition and reactant by being incorporated in stishovite.
We report amorphous silica crystallization experiments targeting the coesite-stishovite boundary at 300–350°C. When extrapolating the phase line of Ono et al. to lower temperatures, the coesite-stishovite boundary is at 6.8 GPa at 350°C (and at 6.5 GPa at 300°C), see . Note that it is not clear whether and how h-stishovite changes the coesite-stishovite phase line. We also note that ice-VII melting is at around 300°C at 6.5 GPa [Citation29]. Specifically, experiments were performed at 750 t/350°C, 793 t/350°C, and 824 t/300°C with annealing times of 3, 6, and 6 h, respectively.
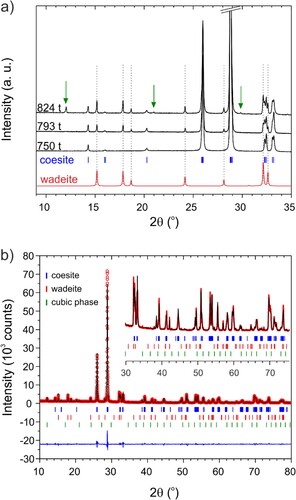
The evolution of products with increasing load is shown in (a). The sample produced at 750 t corresponded to single-phase coesite. Interestingly, the PXRD pattern of products obtained at higher loads/pressure contained extra reflections at low 2θ angles. For the 793 t product these extra reflections could be indexed with a hexagonal cell with a = 6.7213(1) Å and c = 9.4853(3) Å. Reflections from this hexagonal phase are then also present in the pattern of the 824 t product and with increased relative intensities. In addition, the 824 t pattern contains another set of reflections that can be indexed with a primitive cubic cell (a = 7.3182(2) Å). (b) shows the result of the Rietveld analysis of the 824 t pattern where the hexagonal pattern was refined with a wadeite model structure (space group P63/m). Actual wadeite K2Si4O9 has been reported with somewhat different lattice parameters, a = 6.6124 Å and c = 9.5102 Å [Citation42]. Also, in the refined structure the electron density of the K position (1/3, 2/3,z) is significantly reduced, see supporting information for details. At this point it is not clear whether the hexagonal and cubic phases correspond to pure silica (or hydrous forms of silica) or may have formed due to the presence of an impurity.
Figure 8. (a) Compilation of PXRD patterns (Cu Kα1, low angles 2θ range) of SiO2 products obtained at 750 t/350°C after 3 h, 793 t/350°C after 6 h, and 824 t/300°C after 6 h. The 750 t patterns correspond to single-phase coesite. The 793 t pattern contains reflections from a hexagonal (wadeite-like) phase. The 824 t pattern contains in addition reflections from a cubic phase. (b) Observed (circles) and calculated (line) powder patterns of the SiO2 824 t/300°C sample after simultaneous Rietveld refinement of monoclinic coesite and hexagonal wadeite-like phase, and LeBail fitting of cubic phase. The difference is the line at the bottom (R = 7.02, Rf = 9.42, Chi2 = 10.3). The inset shows an enlarged section of the higher 2θ angle range. The ratio coesite: wadeite is 8.99(3): 1.01(1) (wt.% fraction).
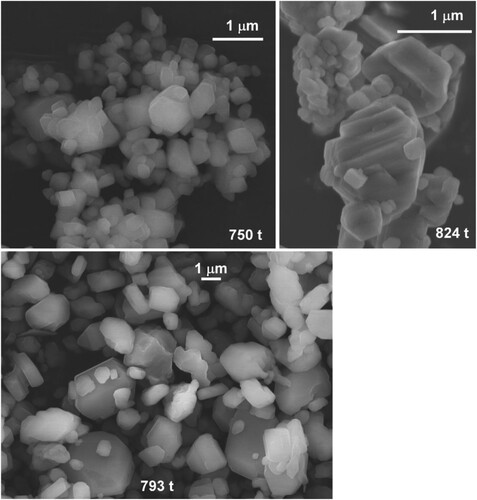
presents SEM images for these three samples, which look very similar. Again, samples appear segregated into two fractions, small-sized (0.2–0.3 µm) crystallites and bulky (>1 µm) facetted crystals which we consider typical of Ostwald ripening. The presence of several phases in the 824 t sample cannot be deduced from the crystals’ morphology. It is interesting to note that the morphology of coesite crystals produced at high pressure (>750 t load) is radically different from that of crystals obtained from conversions close to the quartz boundary (cf. inset (b)). Since (hydrous) stishovite has not been obtained at highest load (824 t), we are not able to tell what maximum pressures may be reached with the proposed hydrothermal assembly. As indicated in we estimate it to 6.5 GPa. However, earlier work at 10 GPa has shown that temperatures of 350°C are needed to overcome kinetic barriers in the coesite – h-stishovite transition [Citation14,Citation15]. Therefore our 824 t run might have been performed at too low temperature for seeing this transition. Also there could be the presence of hitherto unknown (hydrous) silica between the coesite and hydrous stishovite phase fields, thus shifting the latter to higher pressures.
Figure 9. SEM images of products obtained at 750 t/350°C after 3 h, 793 t/350°C after 6 h and 824 t/300°C after 6 h.
4.4. Performance assessment of assembly and Teflon capsules
Considering the rather low temperatures employed for hydrothermal test experiments it was expected that the pressure-load efficiency of the ‘hydrothermal' assembly would be similar to that of the original 25/15 assembly at room temperature. Yet, the test experiments suggest that the pressure-load performance of the hydrothermal assembly is somewhat lower (cf. ), just reaching 6.5 GPa at highest loads (∼820 t). This is most likely due to a combination of the mullite pressure medium having a higher porosity than the usually employed MgO octahedra, and that the water-rich sample and Teflon capsule have a considerably higher compressibility than ‘regular' solid samples.
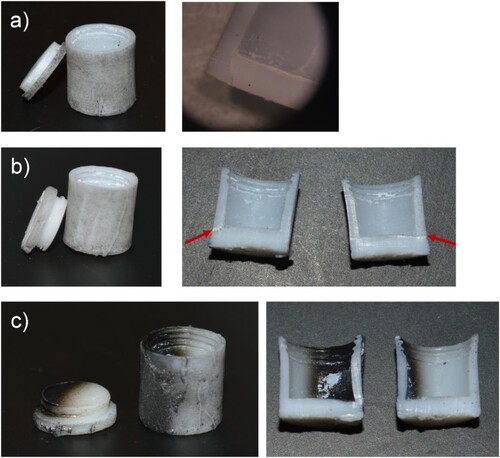
The Teflon capsules performed surprisingly well up to highest pressures, provided that temperatures did not exceed 350°C. shows a collection of recovered capsules that were at conditions close or beyond their failure. (a) displays a failed thin-walled capsule after application at 480 t (∼4.5 GPa) and we recommend using this capsule only for pressures below 3.5 GPa. Reinforced capsules can also develop cracks when employed at higher pressures ((b)). Higher temperatures than 350°C lead to degradation/graphitization ((c)). It must be also noted that samples typically suffered water losses of up to 10%, irrespective of applied temperature, which is attributed to the formation of microcracks in the Teflon material. From inspection with an optical microscope it is difficult to determine whether a crack is located on the surface or runs through the entire wall. Finally, it is worth noting that all soft blowouts took place using the tight-fit slip lids. No soft blowouts occurred during runs using the threaded-lid Teflon capsules although water loss was still observed. Completely tight capsules would require fabrication from noble metals, in particular silver [Citation25] which at the same time would allow for high temperature hydrothermal applications (up to 800°C), cf. suggested design shown in (c).
Figure 10. Photographs of Teflon capsules after runs at conditions close or beyond their failure. (a) thin-walled capsule with a pronounced crack at the wall/bottom boundary after 480 t (∼4.5 GPa), 350°C, 6 h; (b) reinforced capsule with crack (marked with arrows) after 824 t (∼6.5 GPa), 290° C, 7 h. (c) reinforced capsule partially carbonized (but staying tight) after 607 t (∼5.4 GPa), 400°C, 7 h.
5. Conclusions
We described a simple and robust 25/15 multianvil high pressure cell that is dedicated to the study of processes in water-rich environments up to at least 6.5 GPa. Teflon sample containers may be used for temperatures up to 400°C and duration periods of 7 –8 h. For higher operation temperatures (up to 800°C) and longer duration periods it is suggested to use Ag capsules. The proposed assembly will prove useful for the simulation of geofluids, the study of hydrothermally promoted conversions and/or crystal growth, and for performing hydrothermal synthesis in extreme water environments.
Supplemental Material
Download MS Word (3.1 MB)Acknowledgements
We acknowledge the assistance of FORCE staff members. The Facility for Open Research in a Compressed Environment (FORCE) at ASU is funded by NSF-EAR under the Mid-scale Research Infrastructure-1 award #2131833. We acknowledge the use of facilities within the Eyring Materials Center at Arizona State University supported in part by NNCI-ECCS-1542160. We acknowledge Jekabs Grins at Stockholm University for his help in analyzing some of the powder diffraction patterns. We are especially grateful to William Chapin at the ASU CLAS Research Technical Serv., Instrument Design & Fabrication Core for skillfully fabricating the Teflon sample capsules.
Disclosure statement
No potential conflict of interest was reported by the author(s).
Additional information
Funding
References
- Rabenau A. The role of hydrothermal synthesis in preparative chemistry. Angew Chem Int Ed 1985;24:1026–1040. DOI:10.1002/anie.198510261
- Yoshimura M, Byrappa K. Hydrothermal processing of materials: past, present, future. J Mater Sci. 2008;43:2085–2103. DOI:10.1007/s10853-007-1853-x
- Yardley BWD, Bodnar RJ. Geochemical perspectives. Fluids Cont Crust. 2014;3:1–123. doi:10.7185/geochempersp.3.1.
- Yoshimura M, Byrappa K. Handbook of hydrothermal technology. Elsevier; 2013. ISBN:978-0123750907.
- Cundy CS, Cox PA. The hydrothermal synthesis of zeolites: precursors, intermediates and reaction mechanism. Micropor Mesopor Mat. 2005;82:1–78. DOI:10.1016/j.micromeso.2005.02.016
- Feng S-H, Li G-H. Hydrothermal and solvothermal syntheses. In: Modern inorganic synthetic chemistry (second edition), chapter 4. Elsevier; 2017. p. 73–104. DOI:10.1016/B978-0-444-63591-4.00004-5
- Weingärtner H, Franck EU. Supercritical water as a solvent. Angew Chem Int Ed. 2005;44:2672–2692. DOI:10.1002/anie.200462468
- Wu CJ, Fried LE, Yang LH, et al. Catalytic behavior of dense hot water. Nat Chem. 2009;1:57–62. DOI:10.1038/nchem.130
- Hou R, Quan Y, Pan D. Dielectric constant of supercritical water in a large pressure-temperature range. J Chem Phys. 2020;153:101103. DOI:10.1063/5.0020811
- Hsu Y-J, Gordeeva A, Antlauf M, et al. Development of a high pressure stirring cell up to 2 GPa: a new window for chemical reactions and material synthesis. High Press Res. 2020;40:358–368. DOI:10.1080/08957959.2020.1775200.
- Dyuzheva TI, Lityagina LM, Bendeliani NA. Hydrothermal crystal growth of the high-pressure phases of α-PbO2 and TiO2 II. J Alloys Compd. 2004;377:17–20. DOI:10.1016/j.jallcom.2004.01.033
- Dyuzheva TI, Lityagina LM, Nikolaev NA, et al. Growth of single crystals of the high-pressure ε-FeOOH phase. Crystallogr Rep. 2006;51:342–343. DOI:10.1134/S1063774506020234
- Nikolaev NA, Lityagina LM, Dyuzheva TI, et al. Synthesis and single crystal growth of the new high-pressure phase of GaOOH. J Alloys Compd. 2008;459:95–97. DOI:10.1016/j.jallcom.2007.04.244
- Spektor K, Nylen J, Stoyanov E, et al. Ultrahydrous stishovite from high-pressure hydrothermal treatment of SiO2. Proc Natl Acad Sci U S A. 2011;108:20918–20922. DOI:10.1073/pnas.1117152108
- Spektor K, Nylen J, Mathew R, et al. Formation of hydrous stishovite from coesite in high pressure hydrothermal environments. Am Miner. 2016;101:2514–2524. DOI:10.2138/am-2016-5609
- Spektor K, Fischer A, Häussermann U. Crystallization of LiAlSiO4 glass in hydrothermal environments at gigapascal pressures – dense hydrous aluminosilicates. Inorg Chem. 2016;55:8048–8058. DOI:10.1021/acs.inorgchem.6b01181
- Chaplin MF. Structure and properties of water in its various states. In: PA Maurice, editor. Encyclopedia of water: science, technology, and society. John Wiley & Sons, Inc; 2019. p. 1–19. DOI:10.1002/9781119300762.wsts0002
- Stoyanov E, Häussermann U, Leinenweber K. Large-volume multianvil cells designed for chemical synthesis at high pressures. High Press Res. 2010;30:175–189. DOI:10.1080/08957950903422444
- Schneider H, Schreuer J, Hildmann B. Structure and properties of mullite – a review. J Eur Ceram Soc. 2008;28:329–344. DOI:10.1016/j.jeurceramsoc.2007.03.017
- Kalita P. High pressure behavior of mullite-type oxides: phase transitions, amorphization, negative linear compressibility and microstructural implications; 2015. UNLV Theses, Dissertations, Professional Papers, and Capstones. 2369. DOI:10.34917/7645928.
- Leinenweber K, Mosenfelder J, Diedrich T, et al. High-pressure cells for in-situ multi-anvil experiments. High Press Res. 2006;26:283–292. DOI:10.1080/08957950600894671
- Leinenweber K, Tyburczy JA, Sharp TG, et al. Cell assemblies for reproducible multi-anvil experiments (the COMPRES assemblies). Am Miner. 2012;97:353–368. DOI:10.2138/am.2012.3844
- Kalita PE, Schneider H, Lipinska K, et al. High-pressure behavior of mullite: an X-ray diffraction investigation. J Am Ceram Soc. 2013;96:1635–1642. DOI:10.1111/jace.12191
- Likhacheva AY, Chanyshev AD, Goryainov SV, et al. High-pressure–high temperature (HP-HT) stability of polytetrafluoroethylene: Raman spectroscopic study up to 10 GPa and 600 C. Appl Spectrosc. 2017;71:1842–1848. DOI:10.1177/0003702817691529
- Kolis JW, McMillen CD. High temperature hydrothermal synthesis of inorganic compounds. Compreh Inorg Chem III. DOI:10.1016/B978-0-12-823144-9.00088-1
- Walker D, Carpenter MA, Hitch CM. Some simplifications to multianvil devices for high-pressure experiments. Am Miner. 1990;75:1020–1028. http://www.minsocam.org/ammin/AM75/AM75_1020.pdf.
- Hayashi H, Torii K. Hydrothermal synthesis of titania photocatalyst under subcritical and supercritical water conditions. J Mater Chem. 2002;12:3671–3676. DOI:10.1039/b207052a
- Bogush GH, Tracy MA, Zukoski IV CF. Preparation of monodisperse silica particles: control of size and mass fraction. J Non Crystal Solids. 1988;104:95–106. DOI:10.1016/0022-3093(88)90187-1
- Datchi F, Loubeyre P, LeToullec R. Extended and accurate determination of the melting curves of argon, helium, ice (H2O), and hydrogen (H2). Phys Rev B. 2000;61:6535–6546. DOI:10.1103/PhysRevB.61.6535
- Bohlen SR, Boettcher AL. The quartz ⇆ coesite transformation: a precise determination and the effects of other components. J Geophys Res Solid Earth. 1982;87:7073–7078. DOI:10.1029/JB087iB08p07073
- Bose K, Ganguly J. Quartz-coesite transition revisited; reversed experimental determination at 500-1200 degrees C and retrieved thermochemical properties. Am Miner. 1995;80:231–238. DOI:10.2138/am-1995-3-404
- Naka S, Inagaki M, Kameyama T. The effect of water on the crystal growth of coesite. J Cryst Growth. 1974;24:614–616. DOI:10.1016/0022-0248(74)90389-3
- Huang W-L. The nucleation and growth of polycrystalline quartz: pressure effect from 0.05 to 3 GPa. Eur J Miner. 2003;15:843–853. DOI:10.1127/0935-1221/2003/0015-0843
- Arasuna A, Okuno M, Mizukami T, et al. The role of water in coesite crystallization from silica gel. Eur J Miner. 2013;25:791–796. DOI:10.1127/0935-1221/2013/0025-2331
- Zhang G, Xu Y, Xu D, et al. Pressure-induced crystallization of amorphous SiO2 with silicon–hydroxy group and the quick synthesis of coesite under lower temperature. High Press Res. 2008;28:641–650. DOI:10.1080/08957950802510091
- Akaogi M, Kusaba K, Susaki JI, et al. High-pressure high-temperature stability of αPbO2-type TiO2 and MgSiO3 majorite: calorimetric and in situ X-ray diffraction studies. In: Syono Y, Manghnani MH, editor. High-pressure research: application to earth and planetary sciences. Washington, DC: TERRAPUB American Geophysical Union; 1992. p. 447–455.
- Withers AC, Essene EJ, Zhang Y. Rutile/TiO2II phase equilibria. Contrib Miner Petr. 2003;145:199–204. DOI:10.1007/s00410-003-0445-2
- Spektor K, Tran DT, Leinenweber K, et al. Transformation of rutile to TiO2-II in a high pressure hydrothermal environment. J Solid State Chem. 2013;206:209–216. DOI:10.1016/j.jssc.2013.08.018
- Yong W, Dachs E, Benisek A, et al. Heat capacity and entropy of rutile and TiO2II: thermodynamic calculation of rutile-TiO2II transition boundary. Phys Earth Planet Inter. 2014;226:39–47. DOI:10.1016/j.pepi.2013.10.004
- Kojitani H, Yamazaki M, Kojima M, et al. Thermodynamic investigation of the phase equilibrium boundary between TiO2 rutile and its α-PbO2-type high-pressure polymorph. Phys Chem Miner. 2018;45:963–980. DOI:10.1007/s00269-018-0977-7
- Ono S, Kikegawa T, Higo Y, et al. Precise determination of the phase boundary between coesite and stishovite in SiO2. Phys Earth Planet In. 2017;264:1–6. DOI:10.1016/j.pepi.2017.01.003
- Swanson DK, Prewitt CT. The crystal structure of K2SiVISi3IVO9. Am Miner. 1983;68:581–585.