
 ?Mathematical formulae have been encoded as MathML and are displayed in this HTML version using MathJax in order to improve their display. Uncheck the box to turn MathJax off. This feature requires Javascript. Click on a formula to zoom.
ABSTRACT
High pressure circular dichroism (HP-CD) spectroscopy below 200 MPa, especially in the near-ultraviolet region, has long been expected to probe the protein self-association phenomena. However, its experimental difficulties have hampered obtaining the data available for quantitative analyses. In this paper, near-ultraviolet CD spectra measurements under various temperatures and pressures were demonstrated on nitrilase from Rhodococcus rhodochrous J1 (J1-NTase), which thermally self-associates from inactive protomer to active oligomer at atmospheric pressure. The exploration of instrumental conditions and simple raw data correction enabled us to complete the spectra in a temperature-pressure plane. The quality of data was checked by multivariate curve resolution with the alternating least squares method (MCR-ALS), which gave model-free decomposition into component spectra and their concentration profiles. The resultant two components pointed out that the obtained data were self-consistent and appeared to reflect free and bound protomers.
1. Introduction
Pressure, like temperature, is an essential variable for Gibbs free energy and dictates the equilibrium of a chemical reaction. As for protein chemistry, pressure has been known to perturb the protein quaternary structure without any significant effect on the tertiary structure [Citation1,Citation2]. In addition, pressure-induced shifts in dissociation equilibria are related to volumetric parameters with changes in hydration and intermolecular packing [Citation3,Citation4]. Since many proteins are known to regulate their biological functions by self-association [Citation5,Citation6], such thermodynamic properties of oligomeric protein dissociation obtained from high pressure experiments are very important for understanding oligomeric protein systems. Several techniques have been developed to detect the dissociation of oligomeric proteins under high pressure, including light scattering [Citation7–9], fluorescence depolarization [Citation10,Citation11], NMR [Citation12], and small-angle X-ray scattering (SAXS) [Citation13–16]. Of these, only SAXS has the potential to detect intermediates, if any, during the dissociation process [Citation17]. However, its interpretation is not yet straightforward [Citation18].
Circular dichroism (CD) spectroscopy is routinely used to characterize protein structure. Far-ultraviolet CD spectroscopy reflects the secondary structure of proteins, while near-ultraviolet CD spectroscopy is sensitive to the spatial arrangement and relative orientation of aromatic side chains in proteins [Citation19,Citation20]. The latter may correlate with the tertiary and quaternary structure though its application is few. Compared to other spectroscopy, such as fluorescence or RAMAN, CD spectroscopy follows Lambert-Beer’s law, so that the spectrum of a mixture system is expressed as the linear combination of those constituent components. CD spectra are, then, amenable for multivariable curve analyses to give more detailed components’ properties. Therefore, high pressure CD (HP-CD) spectroscopy has long been expected to track the conformational changes of proteins caused by pressure.
The experimental setup of HP-CD spectroscopy is simple. It simply uses conventional CD instruments with a high pressure CD cell in the place of the standard one. Nevertheless, a few studies, using HP-CD spectroscopy, have been reported because of the cell window problem [Citation21–23]. The window material of HP-CD cell necessitates optically transmissive and isotropic as well as mechanically tolerant upon compression. So far, amorphous materials, such as fused quartz or equiaxed crystals such as diamond and Yttrium Aluminum Garnet (YAG), have been reported [Citation21,Citation23]. Uniaxial crystals such as magnesium fluoride can also be used when the optical axis is precisely manufactured perpendicular to the window surface [Citation22]. Among these, fused quartz is promising. It is inexpensive, easy to manufacture, and has high transmittance for the near-ultraviolet region. Its pressure tolerance is not very high, but still tolerant below 200 MPa, where dissociation of oligomeric proteins rather than collapse of secondary structure would occur [Citation1,Citation2]. Even below 200 MPa, however, Young's modulus is not high enough to avoid deformation or depolarization upon compression. To reduce its effect, especially in the edge region of the window, a pinhole aperture was introduced [Citation21], but the introduction of the aperture cannot completely eliminate the deformation effect. To make matters worse, it further loses the transmitted light intensity and lowers the signal-to-noise ratio. The cell window problem is, then, coupled with instrumental limit. Careful inspection of the data collection protocol is more critical for the protein solution samples compared to the polymer sample [Citation23] because the former signal is much weaker.
In this study, we attempted to apply HP-CD spectroscopy in the near-ultraviolet region to the association/dissociation process of the oligomer protein, Rhodococcus rhodochrous J1 nitrilase (J1-Ntase). Nitrilases are nitrile-hydrolytic enzymes, expressed in bacteria, fungi, and plants, and share the common feature of forming left-handed helical assemblies of various lengths with dimers as protomers [Citation24–26]. The relationship between enzyme activity and self-association of J1-NTase is well characterized. Nagasawa et al. [Citation27] measured the association number of the J1-NTase under various conditions by static light scattering, analytical ultracentrifugation, and size exclusion chromatography. The results showed that the J1-NTase exhibits an equilibrium between an inactive dimer and an active oligomer, which is induced by increasing temperature or concentration, or by the addition of neutral salt, substrate, or glycerol, without any coenzyme or ATP’s. In the article, we first demonstrated that the near-ultraviolet CD spectrum of J1-NTase reflected its oligomerization state at ambient pressure. Next, based on the result, we explored the data collection protocol of HP-CD spectroscopy. Then, multivariable curve analysis was applied to each temperature-pressure condition and its validity was checked by the continuity of the result in the temperature-pressure plane. To the best of our knowledge, this is the first time to use near-ultraviolet HP-CD spectroscopy to quantitatively trace the association/dissociation process of proteins.
2. Materials and methods
2.1. Sample preparation
Recombinant nitrilase from Rhodococcus rhodochrous J1 (J1-NTase) was expressed in transformed E. coli JM109 cells, kindly gifted by Dr. T. Yoshida of Gifu University, Japan [Citation28], and purified according to previously described procedures [Citation27]. Purified J1-NTase was dissolved in 10 mM potassium phosphate buffer pH 7.5 containing 1 mM dithiothreitol (DTT) at a concentration of 5 mg/mL and stored at −80°C. Just prior to use, J1-NTase was dialyzed against 10 mM potassium phosphate buffer pH 7.5 containing 200 mM KCl and 1 mM DTT, and diluted to 4 mg/mL. Protein concentration was measured via absorption spectroscopy at 280 nm using ϵ280 = 1.118 mL mg−1 cm−1, which was estimated from the amino acid sequence of J1-NTase using the ProtParam tool in Swiss Institute of Bioinformatics (https://web.expasy.org/protparam/).
2.2. CD spectroscopy
CD spectra measurements were performed using a JASCO J-820 spectropolarimeter. For measurement under atmospheric pressure, quartz cells with optical-path lengths of 1 and 10 mm were used, and 4 and 8 scans were accumulated in the far- and near-ultraviolet region, respectively. Each spectrum was obtained after 15-min equilibration at each temperature from 5 to 30°C.
For HP-CD spectroscopy, a high pressure optical cell, PCI-400 (Syn Corporation) was used. A pair of 8-mm-thick quartz windows were used as the pressure-resistant optical windows, and their apertures were reduced to 1.5 mm so that deformation due to the applied pressure would not affect the optical isotropy. The J1-NTase sample was introduced to an inner quartz cell with a 2-mm optical-path length and was settled in a high pressure optical cell, the temperature of which was controlled at the desired temperature from 15 to 30°C, and was pressurized up to desired pressure using NOVA SWISS hand pump (550.0400-2). The pressure was measured by an electrical resistance strain gage (AZZ03696, Tokyo Instrument Laboratory, Inc.) equipped with a digital indicator (CSD-701B, MinebeaMitsumi Co., Ltd.), and was maintained within a precision of ±1 MPa during the equilibration and the spectral measurement. Each spectrum was obtained by accumulating 32 scans, after 30-min equilibration at each pressure from 5 to 80 MPa.
2.3. Numerical calculation
All calculations were made by our own developed program written in Python 3.7. The program used the SciPy linear algebra library (https://www.scipy.org/) for the singular value decomposition (SVD) calculation. As for MCR-ALS, we imported a public pyMCR library developed by Dr. Camp [Citation29]. For initial values for MCR-ALS, random values (containing elements from 0 to 1) were set for weight fractions, and the maximum number of optimization iterations was 1000. Since the calculation of MCR-ALS has a stochastic nature, the mean and standard deviation of one hundred runs was evaluated.
3. Results and discussion
3.1. CD spectral change due to association/dissociation of J1-NTase
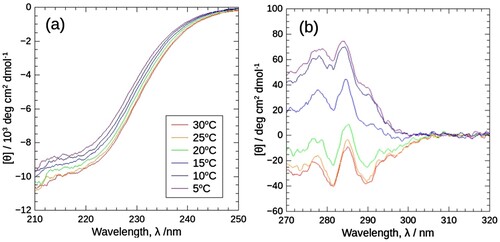
As described above, J1-NTase self-associates with increasing temperature under atmospheric pressure. shows the far- and near-ultraviolet CD spectra of J1-NTase at various temperatures from 5 to 30°C, under atmospheric pressure. The far-ultraviolet CD spectrum showed a slight change with temperature ((a)). According to the traditional secondary structure analysis [Citation30], this spectral change corresponds to ca. 10% change in α-helix and β-sheet content (data not shown), which may originate from the packing of unstructured C-terminal proposed by Thuku et al. [Citation31], rather than from protomer (dimer) folding. In sharp contrast to far-ultraviolet CD spectra, the near-ultraviolet CD spectra changed markedly in the region of 275–305 nm spectrum changed from positive to negative peaks with increasing temperature, while in the region of 305–320 nm CD spectrum retained at zero ((b)). The presence of both changed and unchanged regions in the near-ultraviolet spectrum is the key to the establishment of the data collection protocol of HP-CD spectroscopy.
Figure 1. CD spectra of J1-NTase at various temperatures under atmospheric pressure in the far (a) and near (b) ultraviolet regions. In common with (a) and (b), the spectra are plotted in colors ranging from violet (5°C) to red (30°C). The far-ultraviolet spectrum (a) decreases slightly with temperature, while the near-ultraviolet one (b) decreases significantly with temperature, with positive peaks becoming negative peaks.
CD spectrum around 290 nm is primarily ascribed to Trp residues. Four Trp residues per monomer are distributed in the homology model of the J1-NTase oligomer [Citation31], as shown in . Among them, especially Trp 59 is located at the protomer-protomer interface, namely the C-interface, and approaches the Trp residues in other protomers, which may originate the spectral change during the association/dissociation process. Hence, the marked change in the near-ultraviolet spectra points to the temperature-induced association of J1-NTase.
Figure 2. (Left) Negative stain electron microscopy map of the J1-NTase helical assembly (EMD-1313) and the homology model based on it [Citation31]. (Right) Magnified view of one of the contiguous dimers. The top left (blue) and bottom left (green) monomers combine at the A-interface to form a protomer, as do the top right (orange) and bottom right (red) monomers. Unstructured and intertwined C-terminal chains are supposed to situate on the backside of the figure. The two protomers combine at the C-interface. Trp residues which primarily contribute to the near-ultraviolet CD spectrum are represented by space-filling model. Because one of the four Trp residues in each monomer, Trp59, is located at the C-interface, protomer-protomer binding may alter the spatial arrangement and relative orientation of the Trp residues without major conformational changes within the protomer, resulting in changes in the near-ultraviolet CD spectrum.
![Figure 2. (Left) Negative stain electron microscopy map of the J1-NTase helical assembly (EMD-1313) and the homology model based on it [Citation31]. (Right) Magnified view of one of the contiguous dimers. The top left (blue) and bottom left (green) monomers combine at the A-interface to form a protomer, as do the top right (orange) and bottom right (red) monomers. Unstructured and intertwined C-terminal chains are supposed to situate on the backside of the figure. The two protomers combine at the C-interface. Trp residues which primarily contribute to the near-ultraviolet CD spectrum are represented by space-filling model. Because one of the four Trp residues in each monomer, Trp59, is located at the C-interface, protomer-protomer binding may alter the spatial arrangement and relative orientation of the Trp residues without major conformational changes within the protomer, resulting in changes in the near-ultraviolet CD spectrum.](/cms/asset/7d03b8cd-6c75-4d81-9ca7-653359ad202f/ghpr_a_2341805_f0002_oc.jpg)
3.2. HP-CD spectra measurement of J1-NTase
In making the data collection protocol of HP-CD spectroscopy, we should consider two problems: the low signal-to-noise ratio and the mechanical depolarization or repositioning of windows upon compression.
As for the former problem, we first optimized the sample concentration for the HP-CD cell. To compensate for the low signal-to-noise ratio, increasing sample concentration would be effective. However, it will further lower the transmitted light. The lower the transmitted light, the higher the high-tension (HT) voltages of the photomultiplier (PM). The sample concentration should be maximized to keep the linearity of the spectrum. To optimize sample concentration, we employed a ‘no-association buffer’ of 10 mM potassium phosphate buffer pH 7.5 containing 1 mM DTT, in which J1-NTase should be protomer (dimer) regardless of sample concentration and temperature (according to Nagasawa et al. [Citation27]).
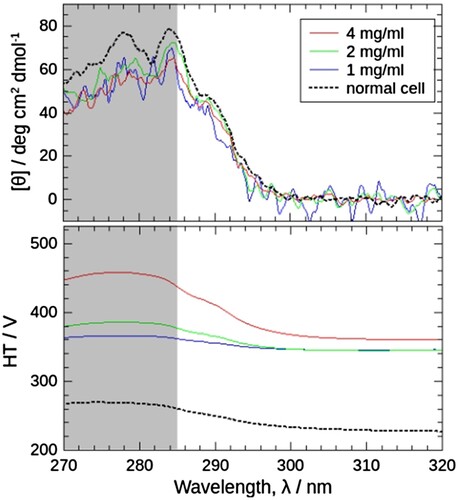
shows the HP-CD spectra at 5 MPa and normal spectrum at 0.1 MPa (upper panel) and the corresponding HT voltages of the PM (lower panel). HP-CD spectra from 1 to 4 mg/mL were almost the same as the normal CD spectrum. Lambert-Beer's law, then, holds true. On the other hand, HTs of high pressure cells were much higher than normal cells, indicating that the transmitted light darkened. This is true for increasing sample concentration. At sample concentrations above 4 mg/mL, the spectra were ‘flattened’ (data not shown) where HT voltages were above 450 V, so 450 V is the upper limit of HT voltage in this case. This upper HT voltage also depends on instrumental conditions such as the specification of the CD instrument or the size of the aperture. If we use a larger aperture, the transmitted light would be brighter, whereas the deformation effects of windows would become more conspicuous in lower pressures [Citation21].
Figure 3. Comparison of near-ultraviolet CD spectra of J1-NTase (top) and the corresponding high-tension (HT) voltages of the photomultiplier (PM) (bottom) obtained using a high-pressure optical cell and those using a normal quartz cell. The spectra using a high-pressure optical cell were obtained with sample concentrations of 4, 2, and 1 mg/mL, at 5 MPa, 25°C (red, green, and blue solid lines). The spectra using a normal quartz cell were with 4 mg/mL, at atmospheric pressure, 25°C (dotted lines). CD spectrum (top) does not show significant changes depending on the sample concentration or cell used. On the other hand, the HT voltage (bottom) varies, and that with the high-pressure cell is higher than that with the normal cell, and the higher the sample concentration. The solvent used for sample preparation was ‘no-association buffer’, i.e. 10 mM potassium phosphate buffer pH 7.5 containing 1 mM DTT, in which J1-NTase protomer does not associate. The wavelength range of 270-285 nm is screened because data correction shown in would be failed in this range, as discussed in the text.
Next, we dealt with the latter problem, shown as spectral drift and shift. shows how raw CD spectra changed upon compression and how we corrected them. (a) shows the raw CD spectra of the solvent. As buffer is isotropic, its CD signal, i.e. baseline should be zero for all wavelengths. However, one can see a drift in all spectra: a linear dependency of CD signals against wavelength rather than zero constant. One can also notice that a linear drift in the region of 305–320 nm can be seen in the raw spectra of the sample ((b,c)). We suspected that this linear drift arose from instrumental: CD instrument generates right- and left-handed circular polarized incident light alternately and records the transmitted light. The difference in the transmitted lights corresponds to the CD value. When the aperture is narrowed, a drift may occur. After subtraction of the linear drift, the spectra change in the region of 285–305 nm appeared physically sound, which exhibited a negative to positive change upon compression ((d)), just opposite to the change with increasing temperature at atmospheric pressure ((b)), corresponding to pressure-induced dissociation. We, therefore, assumed that the apparent spectra consist of base drift and true signal.
Figure 4. The raw spectra obtained by HP-CD spectroscopy at 5 MPa (red), 40 MPa (green), and 80 MPa (blue), 30°C, and the flow of data correction. (a) and (b) Raw CD spectra of solvent (10 mM potassium phosphate buffer pH 7.5 containing 200 mM KCl and 1 mM DTT) and 4 mg/mL J1-NTase sample. The spectra of the solvent and sample drift and shift with each pressure; 5 MPa, middle; 40 MPa, top; 80 MPa, bottom. Cancelling these modulations by simply subtracting the solvent from the sample becomes more difficult with increasing pressure. (c) As alternative baselines to cancel the drift and shift, regression lines were calculated for the 305–320 nm sample spectra, since the CD spectral intensity of J1-NTase would remain zero in this range. (d) Data correction by subtraction of the regression line resulted in CD spectra that varied with pressure; 5 MPa, the lowest negative, 40 MPa, negative; 80 MPa, positive spectra.
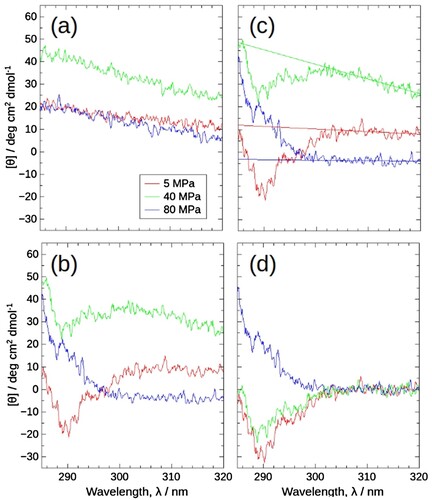
Besides the above spectral drift, one can also see a shift in all spectra: vertical CD value change of spectrum. To make things worse, these spectral shifts occurred unsystematically with pressures ((a,b)): At 40 MPa the signal shifted upward while downward at 80 MPa. The spectral shift could be almost canceled by simply subtracting the buffer spectrum at low pressure, i.e. 5 MPa. Even at higher pressures, the shifts had a tendency to some extent: from 5 to 80 MPa, the direction of the drift in sample spectra coincided with those in buffer spectra ((a,b)). However, the subtraction did not work. The spectral drift and shift appeared to be connected with mechanical stress applied on window material, which normally accompanies the positional change upon compression. Accordingly, its effect would become conspicuous, especially for small apertures, which may result in drifting and shifting spectra.
Since the spectral drift and shift seemed difficult to control, we took regression lines in 305–320 nm as a baseline ((c)) and the baseline-subtracted spectra were taken as HP-CD spectra of the sample ((d)). We should note that this baseline subtraction can only be applicable in 285–320 nm. Below 285 nm the solvent spectra showed some undulation (data not shown).
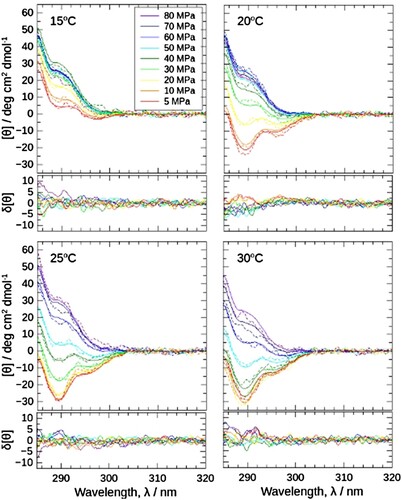
The proposed data collection protocol was simply applied to single data. We further verified it by applying a series of data under various temperatures and pressures. Successful data should show the interdependency among different conditions and consistent trends in the temperature-pressure plane. (a) shows the near-ultraviolet CD spectra of J1-NTase under various pressures from 5 to 80 MPa, at each temperature from 15 to 30°C. In (b), the [θ] value at 290 nm, [θ]290, is plotted against pressure, as an indicator of the association state of the J1-NTase (the higher [θ]290, the more dissociation proceeds). Although the simple correction was applied for each raw spectrum, the change of spectra was smooth and continuous in sequential order with varying conditions. The direction of spectrum change upon compression appeared negative to positive, that is, the associated state to the dissociated one. Besides, CD values themselves appeared sound: the [θ]290 value at 5 MPa matched with that of a normal cell (open symbols) (Notice that these 5 MPa data were corrected in the same manner as high pressures). Also, at 80 MPa [θ]290 values of different temperatures converged to a similar value.
Figure 5. (a) Near-ultraviolet CD spectra of J1-NTase under various pressures at 15, 20, 25, and 30°C. In common with all boxes, the spectra are plotted in colors ranging from red (5 MPa) to violet (80 MPa), indicating that the spectrum increases with pressure. (b) The [θ]290 values read in (a) are plotted against pressure. The different colors of the symbols represent the respective temperatures, and the open symbols at 0.1 MPa corresponds to the value measured using a normal quartz cell at atmospheric pressure. The [θ]290 increases with pressure, shifting to higher pressures at higher temperatures.
![Figure 5. (a) Near-ultraviolet CD spectra of J1-NTase under various pressures at 15, 20, 25, and 30°C. In common with all boxes, the spectra are plotted in colors ranging from red (5 MPa) to violet (80 MPa), indicating that the spectrum increases with pressure. (b) The [θ]290 values read in (a) are plotted against pressure. The different colors of the symbols represent the respective temperatures, and the open symbols at 0.1 MPa corresponds to the value measured using a normal quartz cell at atmospheric pressure. The [θ]290 increases with pressure, shifting to higher pressures at higher temperatures.](/cms/asset/721b4ee3-8ddf-48d9-90e9-910aaf268dcb/ghpr_a_2341805_f0005_oc.jpg)
urged us to analyze the data quantitatively by a more sophisticated numerical analysis, the multivariate curve resolution (MCR) method, to assess the validity of the data collection protocol.
3.3. Spectra decomposition by MCR
The MCR method is one of the multivariate curve resolution algorithms applied for a series of data from a multicomponent mixed system. If spectral data are represented by a linear combination of the spectra of constituent components, MCR decomposes a series of data into the component spectra and its evolving concentration profiles with minimum constraints [Citation32,Citation33]. Compared to global fitting that optimizes parameters of a given formula, MCR accordingly becomes very sensitive to the nature of original data because of its freedom. The MCR method has been successfully applied to a variety of evolving spectra data, including far-ultraviolet CD and absorption spectroscopy [Citation34–36], small-angle X-ray scattering [Citation37], and electron energy-loss spectroscopy with positional data [Citation38]. It should be noted that all these data were well represented by a linear function of evolving parameters. If non-linear terms, such as an erroneous background contribution, were involved in the original data, the output of MCR would become physically meaningless. Therefore, the inspection of MCR results from the present data may be a good measure of the correctness of our data collection protocol.
Firstly, prior to MCR, the number of components or oligomeric states, n, should be determined. Based on Lambert-Beer’s law, the present evolving data system can be represented as
(1)
(1) D (r × c) is the CD spectra data matrix. Each spectrum consisted of c = 351 wavelength points (285–320, 0.1 nm steps), and r = 4 × 9 = 36 spectra were measured under different conditions (4 temperatures: 15, 20, 25, 30°C, 9 pressures: 5, 10, 20, 30, 40, 50, 60, 70, and 80 MPa). C (r × n) and ST (n × c) are matrices containing compositional changes with conditions and spectra of pure states. The elements of D and ST are average residual molar ellipticity values, and those of C are weight fractions of each oligomeric state.
Then, n, the number of oligomeric states, was estimated by the singular value decomposition (SVD) method. The experimental data matrix can be written as
(2)
(2) where U and V are the orthogonal matrices relating to the spectrum and the concentration change of each oligomeric state, respectively. Σ is the rectangular diagonal matrix, with singular values as its diagonal elements in descending order. The plot of singular values (Supporting Materials and inset of (a)) pointed out that the two main oligomeric states were clearly distinguished from the noise level. The spectral features of U and V also support that n = 2 (Supporting Materials).
Next, we decomposed D using the MCR-ALS method. In the alternating least squares (ALS) algorithm, the C and ST solutions were alternately and iteratively optimized. In this study, two constraints, ‘non-negativity’ (the solution must not be negative) and ‘normalization’ (the sum of each row must be one), were applied to C since C consists of weight fractions of the states. We assessed the validity of the present analysis in two aspects.
Firstly, the reconstruction ability with Equation (1) was verified. The poor background corrections often accompany non-linear terms in D, which may lead to poor reconstruction with Equation (1). All spectra reconstituted from C and ST well matched with the experimental spectra (), pointing that our HP-CD data followed Equation (1) ideally.
Figure 6. The reconstituted spectra obtained by MCR-ALS (solid lines) and the corresponding experimental spectra (dashed lines) in (a). The difference values between them are also shown under each spectral box.
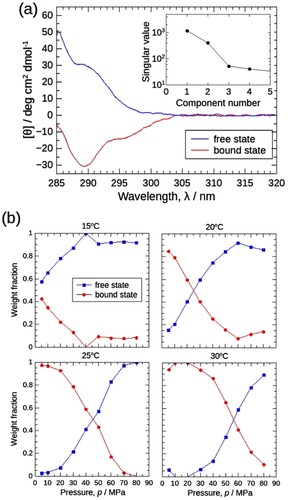
Secondly, the result of ST and C was focused. shows the decomposed two spectra from ST ((a)), and pressure-dependent weight-fraction profiles at various temperatures from C ((b)), where the blue and red were attributed to the free and bound state, respectively. The assignment appears physically reasonable: two spectra from ST, protomer (blue) and oligomer (red) had positive and negative values, respectively as in (b) and . From the oligomer weight fraction profile (red) in C, the association proceeded with temperature at each pressure, similar to ambient pressure [Citation27]. The smoothness of the weight fraction profile is another important issue to be considered. The ‘normalization’ constraint in C was applied only for each condition and no further continuity restriction across them. In theory, the weight fraction could jump around with conditions, hence, the smoothness of weight fractions along temperature and pressure axes in C can also be a good measure for the validity of the analysis. In (b) the weight fractions changed very smoothly not only with pressure but also with temperature.
Figure 7. MCR-ALS results for the CD spectral set in (a). (a) Decomposed positive (blue) and negative (red) spectra corresponding to the free (protomer) and bound (oligomer) states, respectively. Starting with the random matrix as C, 100 calculations were performed to obtain the mean spectra. The standard deviation of the results was also calculated and plotted as error ranges, but they were too small to visualize. Inset: Singular values of the Σ matrix obtained by SVD analysis (Supporting Materials), pointing that two components are sufficient to explain the entire CD spectral data set. (b) Weight fractions of the protomers in free and bound states were plotted against pressure as blue squares and red circles, respectively.
Based on all of these points the author concludes that the output of MCR-ALS is robust and physico-chemically sound.
3.4. Dissociation profile in temperature-pressure plane
The dissociation behavior of J1-NTase in the temperature-pressure plane was further discussed from the weight fractions of two states extracted by MCR-ALS of the CD spectra, namely, the free and bound states.
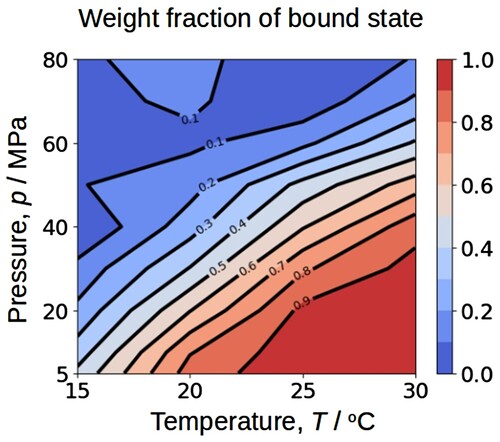
shows the contour map of the weight fraction of the bound state as a function of temperature and pressure. Dissociation of the J1-NTase should roughly follow a decrease in temperature and an increase in pressure. In other words, the dissociation midpoint temperature increased with pressure. This contour map may be comparable to the ellipsoidal phase diagram proposed by Hawley [Citation39] on temperature-pressure denaturation of globular proteins. He showed that quantitative analysis of such a temperature-pressure phase diagram could provide various volumetric parameters associated with the dissociation process that reflects the intermolecular packing and the hydration.
Figure 8. Contour map of the weight fraction of the bound state as a function of temperature and pressure, read from (b). The lower the temperature and the higher the pressure, the lower fraction of the bound state.
Unfortunately, rigorous thermodynamic analysis of the dissociation process of J1-NTase could not be performed because it requires reaction stoichiometry, i.e. the number of components and the association numbers of each component. Most spectral data including the present study only reflect the local environment near the protomer-protomer interfacial surface and inherently contain information on neither molecular dimensions nor the association number of oligomers. Besides, J1-NTase forms a helical assembly by side-by-side association [Citation31], so that multiple lengths of oligomers with different association numbers coexist in equilibrium [Citation40]. The fact that only two states were extracted from MCR-ALS is consistent with the possibility that multiple components are involved in the dissociation process. The value of this study is not diminished even if rigorous thermodynamic quantities could not be obtained. The weight fractions of bound and free states are prerequisites for the quantitative analysis of the self-assembly system. It is noteworthy that MCR-ALS can handle various types of experimental data simultaneously, integrating other high pressure experiments that provide molecular dimensions may further advance thermodynamic characterization.
4. Conclusion
This article demonstrated the use of near-ultraviolet CD spectra for probing association/dissociation of proteins. The application of near-ultraviolet CD spectra has been barely reported, because the interpretation of the spectra is not straightforward compared to the far-UV region. The near-ultraviolet CD is also susceptible to not only association/dissociation but also aggregation. In that sense, the present sample system, where J1-NTase has a single Trp at the interface of protomers, was suitable for tracing protein association/dissociation phenomena.
HP-CD spectroscopy has had difficulty in obtaining reproducible and valid spectral data, so in most cases, a qualitative demonstration of spectral change for a few sample conditions was dealt with. Here, the present data collection protocol was successful in MCR analyses over the temperature-pressure plane. It should be noted that our protocol completes within one single spectrum and does not require buffer spectra subtraction. Besides, we disassembled HP cell to exchange samples at each temperature point. Yet, the interdependence among different temperatures looked very sound.
To the best of our knowledge, this is the first case for quantitative HP-CD data in the temperature-pressure plane. We would also note that the MCR can combine different types of data with a common weight fraction matrix C. Since the CD spectrum itself cannot directly correlate the association/dissociation phenomena, the success of MCR analyses would lead more integrative view of the phenomena.
Supplemental Material
Download PDF (306.1 KB)Acknowledgements
The authors wish to acknowledge Dr. Toyokazu Yoshida of Gifu University, for kindly providing E. coli transformed to express nitrilase from Rhodococcus rhodochrous J1.
Disclosure statement
No potential conflict of interest was reported by the author(s).
Additional information
Funding
References
- Silva JL, Weber G. Pressure stability of proteins. Annu Rev Phys Chem. 1993;44:89–113. doi:10.1146/annurev.pc.44.100193.000513
- Randolph TW, Seefeldt M, Carpenter JF. High hydrostatic pressure as a tool to study protein aggregation and amyloidosis. Biochim Biophys Acta. 2002;1595:224–234. doi:10.1016/S0167-4838(01)00346-6
- Chalikian TV, Breslauer KJ. On volume changes accompanying conformational transitions of biopolymers. Biopolymers. 1996;39:619–626. doi:10.1002/(SICI)1097-0282(199611)39:5<619::AID-BIP1>3.0.CO;2-Z
- Chalikian TV. Volumetric properties of proteins. Annu Rev Biophys Biomol Struct. 2003;32:207–235. doi:10.1146/annurev.biophys.32.110601.141709
- Monod J, Wyman J, Changeux JP. On the nature of allosteric transitions: a plausible model. J Mol Biol. 1965;12:88–118. doi:10.1016/S0022-2836(65)80285-6
- Goodsell DS, Olson AJ. Structural symmetry and protein function. Annu Rev Biophys Biomol Struct. 2000;29:105–153. doi:10.1146/annurev.biophys.29.1.105
- Pande C, Wishnia A. Pressure dependence of equilibria and kinetics of Escherichia coli ribosomal subunit association. J Biol Chem. 1986;261:6272–6278. doi:10.1016/S0021-9258(19)84559-3
- Silva JL, Villas-Boas M, Bonafe CFS, et al. Anomalous pressure dissociation of large protein aggregates. J Biol Chem. 1989;264:15863–15868. doi:10.1016/S0021-9258(18)71557-3
- Crisman RL, Randolph TW. Refolding of proteins from inclusion bodies is favored by a diminished hydrophobic effect at elevated pressure. Biotechnol Bioeng. 2009;102:483–492. doi:10.1002/bit.22082
- King L, Weber G. Conformational drift of dissociated lactate dehydrogenases. Biochemistry. 1986;25:3632–3637. doi:10.1021/bi00360a023
- Pin S, Royer CA, Gratton E, et al. Subunit interactions in hemoglobin probed by fluorescence and high-pressure techniques. Biochemistry. 1990;29:9194–9202. doi:10.1021/bi00491a013
- Niraula TN, Konno T, Li H, et al. Pressure-dissociable reversible assembly of intrinsically denatured lysozyme is a precursor for amyloid fibrils. Proc Natl Acad Sci USA. 2004;101:4089–4093. doi:10.1073/pnas.0305798101
- Fujisawa T, Kato M, Inoko Y. Structural characterization of lactate dehydrogenase dissociation under high pressure studied by synchrotron high-pressure small-angle x-ray scattering. Biochemistry. 1999;38:6411–6418. doi:10.1021/bi982558d
- Popp D, Narita A, Oda T, et al. Molecular structure of the ParM polymer and the mechanism leading to its nucleotide-driven dynamic instability. EMBO J. 2008;27:570–579. doi:10.1038/sj.emboj.7601978
- Gao M, Berghaus M, Mobitz S, et al. On the origin of microtubule’s high-pressure sensitivity. Biophys J. 2018;114:1080–1090. doi:10.1016/j.bpj.2018.01.021
- Julius K, Al-Ayoubi SR, Paulus M, et al. The effects of osmolytes and crowding on the pressure-induced dissociation and inactivation of dimeric LADH. Phys Chem Chem Phys. 2018;20:7093–7104. doi:10.1039/C7CP08242H
- Spinozzi F, Mariani P, Saturni L, et al. Met-myoglobin association in dilute solution during pressure-induced denaturation: an analysis at pH4.5 by high-pressure small-angle x-ray scattering. J Phys Chem B. 2007;111:3822–3830. doi:10.1021/jp063427m
- Fujisawa T. High pressure small-angle a-ray scattering. Subcell Biochem. 2015;72:663–675. doi:10.1007/978-94-017-9918-8_30
- Woody RW. Theory of circular dichroism of proteins. and Woody RW, Dunker AK. Aromatic and cystine side-chain circular dichroism in proteins. In: Fasman GD, editor. Circular dichroism and the conformational analysis of biomolecules. New York: Plenum Press; 1996. p. 25–67 and p. 109–157.
- Rogers DM, Jasim SB, Dyer NT, et al. Electronic circular dichroism spectroscopy of proteins. Chem. 2019;5:2751–2774. doi:10.1016/j.chempr.2019.07.008
- Hayashi R, Kakehi Y, Kato M, et al. Circular dichroism under high pressure. Progr Biotechnol. 2002;19:583–590. doi:10.1016/S0921-0423(02)80157-5
- Lerch MT, Horwitz J, McCoy J, et al. Circular dichroism and site-directed spin-labeling reveal structural and dynamical features of high-pressure states of myoglobin. Proc Natl Acad Sci USA. 2013;110:E4714–E4722. doi:10.1073/pnas.1320124110
- Nagata Y, Takeda R, Suginome M. High-pressure circular dichroism spectroscopy up to 400 MPa using polycrystalline yttrium aluminum garnet (YAG) as pressure-resistant optical windows. RSC Adv. 2016;6:109726–109729. doi:10.1039/C6RA23736C
- Thuku RN, Brady D, Benedik MJ, et al. Microbial nitrilases: versatile, spiral forming, industrial enzymes. J Appl Microbiol. 2009;106:703–727. doi:10.1111/j.1365-2672.2008.03941.x
- Woodward JD, Trompetter I, Sewell TB, et al. Substrate specificity of plant nitrilase complexes is affected by their helical twist. Commun Biol. 2018;1:186, doi:10.1038/s42003-018-0186-4
- Mulelu AE, Kirykowicz AM, Woodward JD. Cryo-EM and directed evolution reveal how Arabidopsis nitrilase specificity is influenced by its quaternary structure. Commun Biol. 2019;2:260, doi:10.1038/s42003-019-0505-4
- Nagasawa T, Wieser M, Nakamura T, et al. Nitrilase of Rhodococcus rhodochrous J1. Conversion into the active form by subunit association. Eur J Biochem. 2000;267:138–144. doi:10.1046/j.1432-1327.2000.00983.x
- Yoshida T, Mitsukura K, Mizutani T, et al. Enantioselective synthesis of (S)-2-cyano-2-methylpentanoic acid by nitrilase. Biotechnol Lett. 2013;35:685–688. doi:10.1007/s10529-012-1131-0
- Camp CH. pyMCR: a python library for multivariate curve resolution analysis with alternating regression. J Res Natl Inst Stan. 2019;124:124018, doi:10.6028/jres.124.018
- Yang JT, Wu CS, Martinez HM. Calculation of protein conformation from circular dichroism. Methods Enzymol. 1986;130:208–269. doi:10.1016/0076-6879(86)30013-2
- Thuku RN, Weber BW, Varsani A, et al. Post-translational cleavage of recombinantly expressed nitrilase from Rhodococcus rhodochrous J1 yields a stable, active helical form. FEBS J. 2007;274:2099–2108. doi:10.1111/j.1742-4658.2007.05752.x
- de Juan A, Tauler R. Chemometrics applied to unravel multicomponent processes and mixtures. Revisiting latest trends in multivariate resolution. Anal Chim Acta. 2003;500:195–210. doi:10.1016/S0003-2670(03)00724-4
- de Juan A, Tauler R. Multivariate curve resolution: 50 years addressing the mixture analysis problem – a review. Anal Chim Acta. 2021;1145:59–78. doi:10.1016/j.aca.2020.10.051
- Mendieta J, Diaz-Cruz MS, Esteban M, et al. Multivariate curve resolution: a possible tool in the detection of intermediate structures in protein folding. Biophys J. 1998;74:2876–2888. doi:10.1016/S0006-3495(98)77994-9
- Cutler P, Gemperline PJ, de Juan A. Experimental monitoring and data analysis tools for protein folding. Study of steady-state evolution and modeling of kinetic transients by multitechnique and multiexperiment data fusion. Anal Chim Acta. 2009;632:52–62. doi:10.1016/j.aca.2008.10.052
- Tauler R. Multivariate curve resolution applied to second order data. Chemom Intell Lab Syst. 1995;30:133–146. doi:10.1016/0169-7439(95)00047-X
- Herranz-Trillo F, Groenning M, van Maarschalkerweerd A, et al. Structural analysis of multi-component amyloid systems by chemometrics SAXS data decomposition. Structure. 2017;25:5–15. doi:10.1016/j.str.2016.10.013
- Kojima Y, Muto S, Tatsumi K, et al. Degradation analysis of a Ni-based layered positive electrode active material cycled at elevated temperatures studied by scanning transmission electron microscopy and electron energy-loss spectroscopy. J Power Sources. 2011;196:7721–7727. doi:10.1016/j.jpowsour.2011.05.017
- Hawley SA. Reversible pressure-temperature denaturation of chymotrypsinogen. Biochemistry. 1971;10:2436–2442. doi:10.1021/bi00789a002
- Oosawa F, Asakura S. Thermodynamics of the polymerization of protein. New York: Academic Press; 1975.