
 ?Mathematical formulae have been encoded as MathML and are displayed in this HTML version using MathJax in order to improve their display. Uncheck the box to turn MathJax off. This feature requires Javascript. Click on a formula to zoom.
Abstract
Direct physicochemical interactions between the major components of electronic cigarette liquids (e-liquids): glycerol (VG) and propylene glycol (PG), and lung surfactant (LS) were studied by determining the dynamic surface tension under a simulated breathing cycle using drop shape method. The studies were performed for a wide range of concentrations based on estimated doses of e-liquid aerosols (up to 2500 × the expected nominal concentrations) and for various VG/PG ratios. The results are discussed as relationships among mean surface tension, surface tension amplitude, and surface rheological properties (dilatational elasticity and viscosity) versus concentration and composition of e-liquid. The results showed that high local concentrations (>200 × higher than the estimated average dose after a single puffing session) may induce measurable changes in biophysical activity of LS; however, only ultra-high e-liquid concentrations inactivated the surfactant. Physiochemical characterization of e-liquids provide additional insights for the safety assessment of electronic nicotine delivery systems (ENDS).
Introduction
Electronic cigarettes (ECs) – the most common type of electronic nicotine delivery systems (ENDS) – are often presented as alternatives to cigarettes (Farsalinos & Le Houezec, Citation2015). They comprise a wide variety of electronically powered devices used to evaporate a liquid mixture – often referred to as an e-liquid – typically composed of varying flavors, with or without nicotine, diluted in aerosol formers like propylene glycol (PG) and/or glycerol (VG – this commonly used abbreviation comes from “vegetable glycerin”) (Brown & Cheng, Citation2014). The aerosol in ECs (“EC-vapor”) is generated by heating the e-liquid and forming the supersatured vapors, which condense next to fine droplets after mixing with the external air. The aerosol composed of droplets is inhaled by the user in a process commonly called “vaping” (Brandon et al., Citation2015). Although ECs have only been on the market for about a decade, they have rapidly evolved from the first-generation disposable or rechargeable units, to new devices with built-in tank systems, large batteries, and integrated circuits allowing users to control the amount of delivered aerosol by adjusting the heating power (Brandon et al., Citation2015; Farsalinos & Polosa, Citation2014). As compared with cigarette smokers, EC users (“vapers”) have a substantially lower exposure to the toxicants and carcinogens present in inhaled aerosol (Farsalinos et al., Citation2013; Farsalinos & Polosa, Citation2014; McRobbie et al., Citation2014; Polosa et al., Citation2016). On the other hand, EC users inhale considerable amounts of the solvents (e.g. PG/VG) in the aerosol produced by the ECs and such non-standard lung exposure should not be a priori regarded as harmless although inhaled PG and VG are considered to be generally non-toxic (Hajek et al., Citation2014). Concerns were raised related to the presence of toxicants in the inhaled aerosol (e.g. metals, acetaldehyde, formaldehyde, acrolein, and other organics formed during extensive heating of e-liquid in the EC) (Cheng, Citation2014; Goniewicz et al., Citation2014). Moreover, the issue of the direct defense response of the respiratory system to a load of highly concentrated aerosols of e-liquid components may be raised as a factor leading to disturbance of pulmonary functions. This effect may be more relevant in subjects suffering from other pulmonary disorders of various etiologies (e.g. allergy, asthma, chronic obstructive pulmonary disease, or infection in various parts of the respiratory tract) (Cho & Paik, Citation2016; Rowell & Tarran, Citation2015). As the predominant mass of the e-liquid is formed by aerosol formers (VG, PG) in aqueous solution, which are mixed in various proportions to obtain desired quality of the inhaled aerosol, these compounds always constitute the highest mass of the aerosol inhaled during EC use.
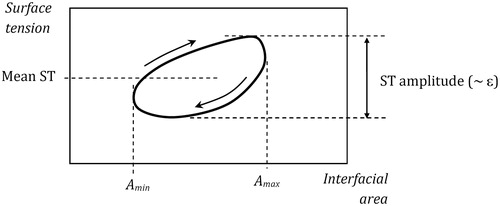
The ongoing debate around the long-term health effects of ECs in humans (Callahan-Lyon, Citation2014; Schraufnagel et al., Citation2014) is at least partly attributed to the absence of clear regulatory requirements for an appropriate scientific assessment of ECs and ENDS in general (Orr, Citation2014). The situation may be improved by new step-wise testing strategies for an in vitro toxicology assessment of e-liquids and their aerosols (Iskandar et al., Citation2016). Such approach may be extended by the additional step of aerosol fate in the human pulmonary system that has not been extensively explored before – the interactions of inhaled e-liquid with the lung surfactant (LS). LS is a sensitively structured pulmonary (alveolar) lipid–protein complex that is directly exposed to inhaled gaseous and particulate contaminants present in the air. Inhaling high doses of air contaminants leads to acute severe pulmonary dysfunction that is at least partially caused by a disturbance in the LS system (Green et al., Citation2000; Haagsman & Van Golde, Citation1985; Matalon et al., Citation1996; Wallace et al., Citation2007). LS – being a mixture of surface active lipids and proteins – is responsible for the homogeneous lung inflation and minimization of breathing effort (Notter, Citation2000). The large surface area of the pulmonary region (up to 100 m2 in adult humans) requires a considerable mechanical energy (work) for expansion during inhalation from the minimum lung volume (and surface area Amin) to the maximum (Amax). This work is described by:
(1)
(1)
Surface tension, denoted as γ, is a function of surface concentration of the LS at the air/liquid interface of the pulmonary liquid. By dynamic adsorption LS decreases the surface tension, hence diminishes the work of breathing. Additionally, dynamic surface tension gradients are produced during variations of the alveolar area during breathing, and they are responsible for the micro-flows of pulmonary fluid (Marangoni effects) which facilitate the mass transfer in the lungs (Gradoń & Podgórski, Citation1989). These alveolar flows contribute to the lung clearance of insoluble deposits and also can affect the gas-exchange rate in the lungs (Sosnowski et al., Citation1998).
Deficiency or inactivity of LS leads to severe health consequences, including life-threatening conditions, such as acute lung injury (ALI) or acute respiratory distress syndrome (ARDS) that often occurs as an outcome of inhaling aggressive agents (Gorguner & Akdun, Citation2010; McKay, Citation2014). The capability to modulate surface tension in alveolar fluid during respiration is the most essential feature of LS in view of its physiological functions related to lung mechanics and clearance. The surface-tension lowering properties of LS can be studied experimentally under specialized in vitro settings that mimic the natural dynamic conditions of the lungs during a breathing cycle (Enhörning, Citation1977; Gradoń et al., Citation1996; Herold et al., Citation1996; Lunkenheimer et al., Citation1996). Such investigations are capable of detecting the undesired action of inhaled pollutants on the physicochemical stability of the LS (Kondej & Sosnowski, Citation2013, Citation2016; Sosnowski et al., Citation2000). One of the most important indicators of dynamic surface-active properties of the LS is the hysteresis of surface tension observed during periodic, breathing-like variations in the air/liquid area (compression/expansion). This hysteresis that is also related (together with the elastic properties of the pulmonary tissue) to the well-known p-V hysteresis during lung ventilation, is a very sensitive feature of the LS system (Banerjee & Bellare, Citation2001; Notter et al., Citation1982).
The aim of this study was to establish the effects of adding VG and PG as essential components of e-liquids on the interfacial dynamics of LS. The measurements were conducted under simulated physiological conditions corresponding to human breathing.
Methods
Estimates of relevant doses
The e-liquid doses deposited in the alveolar region of the lungs were estimated using available data on vaping topography. Robinson et al. (Citation2015) reported that that the total volume of inhaled aerosol during a single vaping session by 23 subjects was in the range of 29–1224 mL, with an average value of 132 mL. The average number concentration of aerosol particles (more precisely: droplets) was taken from Fuoco et al. (Citation2014) and Manigrasso et al. (Citation2015), who reported range of 3.5–6 × 10⁹ particles/mL, depending on the nicotine content and puff duration. We assumed that inhaled aerosol contains 5 × 10⁹ particles in 1 mL of inhaled air/vapor mixture. After simple calculations, the number of droplets entering the lungs during the average puffing session was 6.6 × 10¹¹.
To estimate the total mass of droplets deposited in the lung alveoli, data on their size distribution, density, and the efficiency of deposition are needed. The material density of inhaled droplets depends on their composition, i.e. the concentration of each solvent (VG and PG) contained in e-liquid. Data regarding aerosol quality and deposition efficiency were taken from Sosnowski & Kramek-Romanowska (Citation2016), who measured EC particle size distribution by a laser diffraction technique and provided regional deposition calculations for such particles in the respiratory system for various breathing parameters using the multiple path particle dosimetry (MPPD, Citation2015) model. According to these data, EC droplets have a log-normal size distribution with a mean diameter of ∼410 nm (based on the volumetric distribution) and a geometric standard deviation equal to ∼1.6. The highest expected alveolar deposition of particles with this size range is close to 35% (although for the majority of breathing maneuvers it is <20%, Sosnowski & Kramek-Romanowska, Citation2016). Using this information, the average pulmonary dose deposited in the e-cigarette user’s alveoli after the average puffing session should be between 3.5 and 4.3 mg of VG/PG mixture. We call this mass the nominal dose delivered per session (NDDS). The exact value depends on the composition of e-liquid as the aerosol formers have different densities (VG: 1.26 g/mL; PG: 1.04 g/mL). It is assumed that this amount of deposited e-liquid is homogeneously distributed throughout all of the pulmonary fluid. The volume of this fluid can be found assuming that it covers the whole alveolar surface formed by 4.8 × 10⁸ quasi-spherical structures with a diameter of ∼200 µm (Mercer et al., Citation1994; Ochs et al., Citation2004; Stone et al., Citation1992), which yields 60.3 m2 with the ∼0.5 µm-deep layer (Bastacky et al., Citation1995; Notter, Citation2000). The total volume of LS fluid was estimated then to be ∼30.2 mL (the total surface area of alveoli × the average depth of the liquid layer), so the average concentration of e-liquids in the alveolar fluid is 0.117–0.142 mg/mL for the NDDS.
The amount of each mixture component was precisely calculated for five different e-liquid compositions to be used in the planned experiments containing the LS, i.e. PG/VG v./v.: 100/0 (pure PG), 80/20, 50/50, 20/80, 0/100 (pure VG). This would allow us to determine the possible effects of the composition of inhaled e-liquid on surfactant properties. The NDDS and pulmonary liquid concentration data for the different composition of e-liquid are shown in .
Table 1. Nominal deposited dose per session (NDDS) and the corresponding mixture concentrations in the pulmonary fluid for different propylene glycol/vegetable glycerin (PG/VG) ratios in the inhaled aerosolized e-liquid.
Experimental methods
The LS model used in the studies was based on the Survanta product (Beractantum, Abbott Labs., Abbott Park, IL) that is a commercially available LS substitute derived from calf lungs. In all experiments, Survanta was diluted with ultra-pure water to obtain a final phospholipid concentration equal to 2.5 mg/mL, which corresponds to the one naturally found in humans (Neumann et al., Citation2011).
Test e-liquid mixtures were prepared without nicotine and flavorings by mixing PG and VG at known volumetric proportions, according to the data presented, i.e. 100/0 (pure PG), 80/20, 50/50, 20/80, 0/100 (pure VG). These aerosol former compositions were used in mixtures including LS at various concentrations corresponding to 1×, 10×, 100×, 200×, 1000×, and 2500 × NDDS to scan for the effects that may appear even at hypothetically ultra-high inhaled doses of deposited EC aerosols.
Experimental investigations of the dynamic surface tension in such mixtures were performed using the drop shape method implemented in a commercial PAT-1M tensiometer (Sinterface, Berlin, Germany). The dynamic surface tension at each instant of harmonic variation of the air/liquid interfacial area was determined by solving the Young-Laplace equation to approximate the shape of a small droplet (12 mm3) formed at the tip of a capillary tube. The droplet was continuously pulsated at physiological temperature (36.8 ± 0.2 °C) with the adjusted frequencies corresponding to the breathing rate at various levels of activity. Assumption regarding the physiological temperature of the alveolar gas-liquid system after vapor inhalation is justified by a fast cooling of inhaled vapor in the upper airways and the first generations of the bronchial tree. Available data from hot air (160 °C) inhalation studies indicate that the airstream is cooled down to almost physiological temperature when reaching the trachea (Rong et al., Citation2011). It is because of heat losses related to evaporation of saliva and mucus, but also to the mixing with the air contained in the upper airways which remain open during expiration. When EC-vapor is inhaled, the temperature of air-vapor mixture at the inlet to the mouth is expected to be below 90 °C and is reduced to 37 °C along the first 10 cm of the oral cavity (Asgharian et al., Citation2018). These observations allow to us to exclude the possibility of heating of the surface of lower airways by inhaled EC-vapor. Based on time profiles of dynamic surface tension, the essential numerical parameters needed to characterize the interfacial properties of the LS under breathing-like oscillations were evaluated. The most important ones are: mean surface tension, surface tension amplitude, dilatational surface elasticity, ε, and dilatational surface viscosity, μ, that are two rheological parameters of the air/liquid interface. Both ε and μ describe the visco-elastic response of the interfacial region to the mechanical perturbation, i.e. changes in surface tension, γ, induced by changes in surface area, A. Surface elasticity and viscosity were determined from the fast Fourier transform analysis of a time series of the surface tension and surface area (procedure available in the PAT-1M tensiometer software).
Each experiment for the given concentration and composition of the mixtures including the LS model was performed in triplicate to obtain the average value and standard deviation of the quantitative parameters that are described in detail in the following section.
Data analysis
Four numerical parameters were evaluated to illustrate the influence of the various mixtures on interfacial dynamics of the LS model under harmonic area changes:
Mean surface tension (mean ST),
Surface tension amplitude (ST amplitude),
Surface elasticity (ε),
Surface viscosity (μ).
is a schematic diagram visualizing the meaning of the first two parameters.
The influence of mixtures on LS properties was expressed by changes in the above parameters compared to the control values (i.e. determined for pure LS); however, these changes may be dose- and material-dependent. Thus, it would be helpful to define a single parameter that combines the essential information on the effects induced by each tested mixture. As ST amplitude is linearly proportional to ε (according to the definition ε ∼ const × Δσ), we may introduce the total deviation parameter (TDP), based on the departure of three independent parameters (mean ST, ε, and μ) from their initial values, i.e. values determined in the control sample without aerosol formers. The relative deviation Di of any parameter i (where i: 1 is mean ST, 2 is surface elasticity, and 3 is surface viscosity) will be defined as:
(2)
(2)
where,
denotes the value of parameter i, and
is the value of this parameter in the control sample. Simple average over the deviations gives us the TDP as:
(3)
(3)
Figure 1. Definition of the mean surface tension (mean ST) and the surface tension amplitude (ST amplitude) in the experimental γ-A relationship (hysteresis loop).
Both the Di and TDP values are between zero and the unity, where 0 means no effect ( and 1 – is a very strong effect (
.
Results
The impact of mixture composition and concentration on the mean ST and ST amplitude while varying the air/liquid interfacial area of the LS model is presented in and . The effect on the rheological properties of the LS system interface is presented in and . All data were obtained for a typical breathing frequency (4 s/cycle, i.e. 0.25 Hz). Similar relationships were obtained for the other oscillation frequencies studied (0.1; 0.125; and 0.5 Hz) but they are not discussed here as they led to a similar conclusion and showed no particular influence of breathing rate on the changes in surfactant dynamics in the presence of e-liquids. As the mixture concentrations were changed in a very wide range (1–2500 × NDDS), the results are presented using a logarithmic scale of the mixtures concentrations. Consequently, we decided to use the lowest value on this axis (0.01) as a representation of the control system, i.e. pure LS without the addition of aerosol formers.
Figure 2. Mean surface tension of lung surfactant (LS) in the presence of e-liquid mixture of various compositions and concentrations (NDDS – estimated nominal deposition dose per session). Data for the normal rate of breathing (0.25 Hz). Dashed lines show the control range (pure LS).
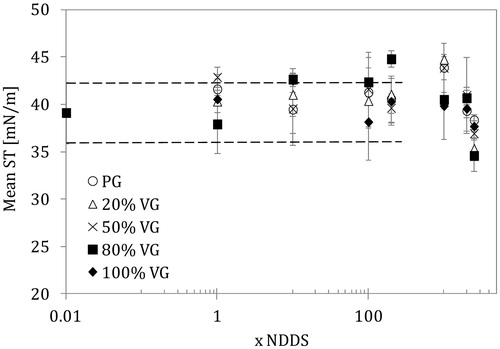
Figure 3. Amplitude of surface tension variations (amplitude ST) in the lung surfactant (LS) in the presence of e-liquid mixture of various compositions and concentrations (NDDS – estimated nominal deposition dose per session). Data for the normal rate of breathing (0.25 Hz). Dashed lines show the control range (pure LS).
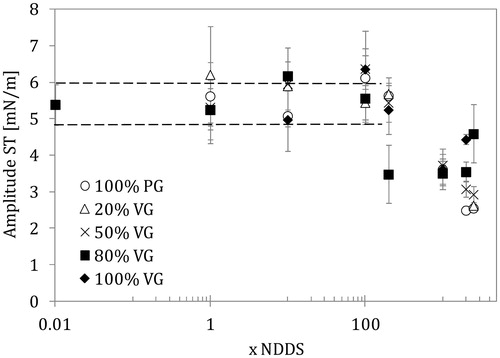
Figure 4. Surface dilatational elasticity of the lung surfactant (LS) liquid interface in the presence of e-liquid mixtures of various compositions and concentrations (NDDS – estimated nominal deposition dose per session). Data for the normal rate of breathing (0.25 Hz). Dashed lines show the control range (pure LS).
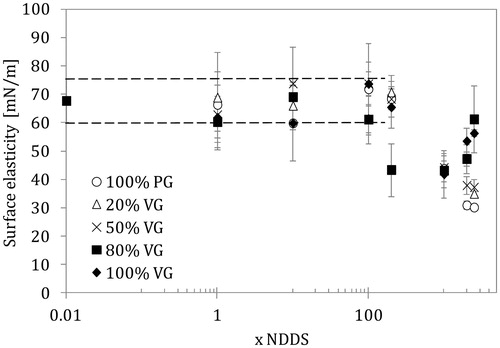
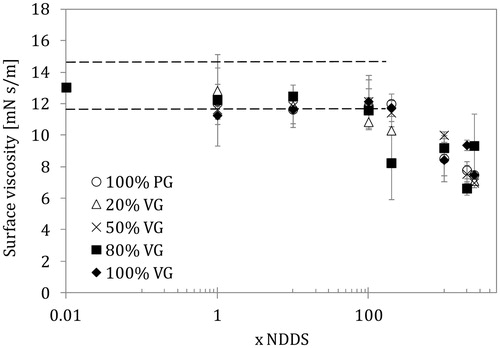
Figure 5. Surface dilatational viscosity of the lung surfactant (LS) liquid interface in the presence of e-liquid mixtures of various compositions and concentrations (NDDS – estimated nominal deposition dose per session). Data for the normal rate of breathing (0.25 Hz). Dashed lines show the parameter range as in .
The data for all types of tested solutions (even for a control sample – pure LS) were scattered, which was attributed to the dynamic (unstable) character of the system but also to the use of the realistic LS material, i.e. the multi-component mixture of biosurfactants characterized by complex physicochemical properties. As shown in , the average ST remained in the same range (39 ± 3 mN/m) for all samples up to the 100 × NDDS concentration of the mixtures. Above this value, some deviations occurred (either increase or a decrease of mean ST at very high concentration). These changes were not directly linked to any particular mixture composition, although an increase in the mean ST was found at 200 × NDDS for 20/80 VG/PG. On the other hand, at higher mixture concentrations (1000 × NDDS) there was a stronger effect for mixtures rich in PG. The ultra-high contents of mixture concentration reduces the mean ST of the LS sample down to 35–36 mN/m, and this effect was more evident for PG/VG mixtures than for the pure components. It is possible that there was a synergistic action of both aerosol formers.
More visible effects of the high concentrations of mixtures were detected in the amplitude of ST changes recorded during harmonic variations in the interfacial area (). Mixtures with 20/80 VG/PG content caused a significant drop in ST amplitude from approximately 5.0 to 3.5 mN/m at 200 × NDDS, while other mixtures induced similar changes only at higher concentrations (1000 × NDDS and above). A drop in ST amplitude during an area oscillation means that the surfactant has partially lost its natural property to modulate ST during the breathing cycle suggesting impaired LS function.
The relationship between surface elasticity and surface viscosity versus mixture concentration shown in and agrees with previous observations. Only the 20/80 PG/VG mixture caused a drop in surface elasticity (from the control value of 60–70 mN/m to 45 mN/m) already at 200 × NDDS, whereas the other PG/VG mixtures required higher doses to induce such effects. The strongest reduction in elasticity was observed for pure PG and mixtures with a low VG content at ultra-high doses (2000–2500 × NDDS).
A decrease in surface viscosity was observed at 100 × NDDS for the 20/80 PG/VG mixture, but more pronounced effects were visible at concentrations corresponding to ≥200 × NDDS. At ultra-high concentrations (>1000 × NDDS), the reduction in surface viscosity was similar and independent of mixture composition; however, high VG content was related to a smaller effect at the highest aerosol formers concentration (2500 × NDDS). The lowest surface viscosity value was about 6.5 mN s/m, which was 50% of the value found in a system without aerosol formers. Surface viscosity is directly related to the phase-shift between ST and surface deformation (extension/contraction); therefore, it indirectly informs about the size of ST hysteresis. As stated earlier, this hysteresis is closely linked to the mechanics of breathing (similar to the p-V relationship), so essential changes in this dynamic characteristics of the LS system may disturb the ventilation process.
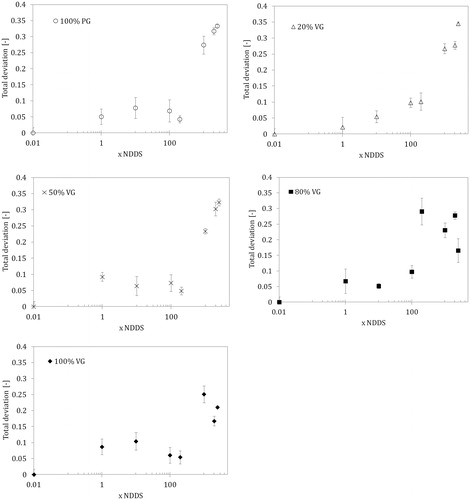
As discussed earlier, the TDP defined by the EquationEquation (3)(3)
(3) can be used to generalize the information on the overall influence of e-liquid mixtures on the dynamic properties of the LS. The relationship between TDP and concentrations for various e-liquid compositions is shown in . These results show that concentrations up to 10 × NDDS have practically no effect on the interfacial activity of the LS; however, a 20–30% deviation from the control state (i.e. pure LS) was observed when the mixture concentration approached 200 × NDDS. At this concentration, the mixture with a 20/80 PG/VG composition had the most striking effect. Ultra-high concentrations (≥1000 × NDDS) clearly changed the dynamic surface-active properties (TDP = 0.15–0.3). In addition, pure PG and mixtures with a high PG content had a greater influence on TDP than VG alone and mixtures with high VG contents.
Figure 6. Total deviation (TDP) based on the combined deviations of three numerical parameters according to Equation (3) for e-liquids with different compositions and concentrations in the lung surfactant (LS) solution (NDDS – estimated nominal deposition dose per session). Data for the normal rate of breathing (0.25 Hz).
The influence of the measured parameters on the surface tension hysteresis can be also evaluated. Calculations of the normalized hysteresis area (HAN – according to Notter et al., Citation1982) in the control sample and in the samples above 1000 × NDDS showed that HAN was reduced by almost 40%, (from 1.6 mN/m to 1.0 mN/m, respectively). A decrease of the hysteresis clearly indicates unfavorable changes in the LS dynamic surface activity and function (Sosnowski et al., Citation2000).
Discussion
A step-wise testing strategy for an in vitro toxicology assessment of e-liquids and their aerosols has been extensively discussed by Iskandar et al. (Citation2016). One important issue is the physicochemical identification of mechanisms that can contribute to direct interactions of inhaled compounds with the organism. Nevertheless, these authors had not considered the role of aerosol formers and LS interactions, which we indicate here as an important step in such evaluation. As suggested by Schleh et al. (Citation2013), LS should be also an important component of in vitro toxicity investigation protocols.
In our study, we use Survanta (Beractantum) as functional biophysical LS model. Survanta is bovine LS that is clinically used to treat RDS. Several studies reported use of Survanta in studies in characterizing LS properties in Langmuir trough (Kodama et al., Citation2014; Zhang et al., Citation2011). Results of such studies deviate from ours due to completely different experimental set-up, and dissimilarity in concentrations, compression ratio and rate. There are also several studies with the oscillating bubble method, where the equilibrium ST values measured at 37 °C for Survanta solutions with phospholipid concentration 2–3 mg/mL were equal to ∼35–40 mN/m, which are similar to those obtained in our study, i.e. mean ST (Bernhard et al., Citation2000; Sosnowski et al., Citation2011). The minimum surface tension in oscillated Survanta samples was as low as <10 mN/m (Herting et al., Citation2001), however, these results have been obtained for higher surface compression (∼50%) compared to the compression used in our research (10%). All these data suggest that Survanta is an adequate experimental model for in vitro studies of biophysical activity of the LS, although results obtained for this compound in the oscillating drop measuring system followed by their discussion based on surface rheology parameters are scarce (Rüdiger et al., Citation2005; Selladurai et al., Citation2016).
Some very recent studies were focused on the analysis of the surfactant alteration by constituents of EC-vapor. Przybyla et al. (Citation2017) investigated the influence of the vapor on the surface tension of Infasurf as a LS model in the Langmuir trough at room temperature and relatively slow surface compression. The EC-vapor components were added to the aqueous phase by bubbling the vapor in external beaker. The concentration of EC-vapor components in the sub-phase could not be controlled with this mixing procedure, but surely it was rather low being obtained from max. 900 mL of vapor. At tested conditions, the authors found no effect of EC-vapor on the compression isotherm (surface tension versus surface area) of Infasurf. On the other hand, atomic force microscopy studies of the surfactant layer transferred to solid support revealed some alterations in lateral arrangement of surfactant components at the interface even at these low concentrations of EC-vapor components. Studies with the Langmuir trough were also published by Davies et al. (Citation2017) who used main LS lipids instead of animal-based surfactant. Lipid monolayer was directly exposed to vapor (aerosol), which was drawn into the experimental chamber. Also in this case, it was impossible to estimate the real concentration of deposited vapor in the studied gas–liquid system. Contrary to the results of Przybyla et al. (Citation2017), Davies et al. (Citation2017) found a deflection and a shift of compression isotherm which suggested a direct interactions of EC-vapor components with the interfacial film of model LS. As a result, the surface tension could not be reduced to the same degree as if the EC-vapor components were absent. Extending these findings to the real life, the authors concluded that exposure to EC-vapor could result in adverse effects for breathing mechanics taking into account the expected impairment of the surfactant function.
Comparing to discussed investigations, our research was performed under the realistic experimental conditions regarding both the temperature and the rate of surface variations. Moreover, due to the applied method of sample preparation, we were able to precisely control the concentration of each e-liquid component and the surfactant. The results of presented studies indicate that there is no direct physicochemical effect of aerosol formers (PG and VG) on LS at concentrations that correspond to the estimated standard doses of inhaled e-liquid, but they are likely to appear if the concentration exceeds these conditions by more than 100-fold. However, it should be noted that the estimated doses are based on the averaged puffing pattern, but significantly larger inhaled volumes have been observed (Robinson et al., Citation2015). In addition, it was assumed that the deposited mass of the aerosol formers is evenly distributed across the lungs and the pulmonary region, which is not necessarily true. It was demonstrated that inhaled aerosols of ECs and tobacco cigarettes have variable deposition in different lung lobes (Manigrasso et al., Citation2015). Non-homogeneous deposition is also caused by the fact that inhaled aerosol contains a finite number of droplets. Therefore, it is very probable that some alveoli will be inflated with the air without droplets but at the same time some alveoli will receive above-average doses. If uneven ventilation and imperfect mixing of the aerosol in the airways are considered, then the actual concentration of deposited e-liquid in a single alveolus can be significantly higher than the average concentration that corresponds to the NDDS. Because the amount of pulmonary liquid and LS in any alveolus is very small, even a low number of deposited e-liquid droplets may locally elevate the concentration of aerosol formers ().
Figure 7. Schematic illustration of the local boost of humectants concentration in the pulmonary liquid after deposition and spreading of a single inhaled e-liquid droplet.
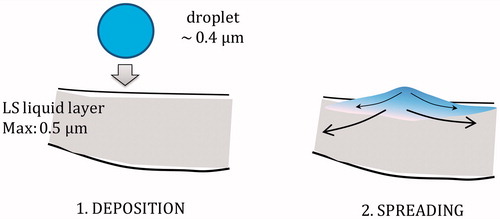
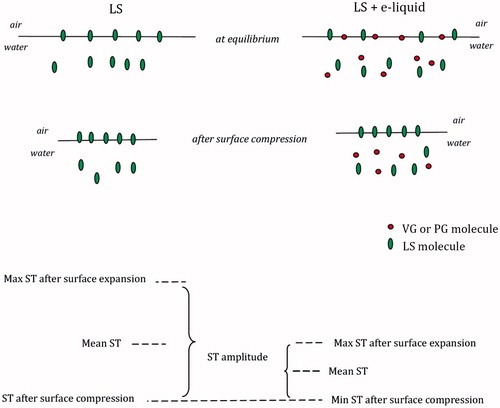
Figure 8. Proposed mechanism for lung surfactant (LS) – aerosol former (e-liquid) interactions.
An additional factor that should be considered is related to the over-simplified deposition model implemented in the MPPD software used to estimate the deposition efficiency of inhaled EC aerosol droplets. This model probably underrates the deposition efficiency by neglecting some important phenomena that occur during flow of submicron aerosol droplets into the lungs (Sosnowski & Kramek-Romanowska, Citation2016).
All of these factors should lead to elevated local concentrations of deposited aerosol formers above the estimated NDDS; therefore, the results we obtained for much higher concentrations may not be purely hypothetical but may reflect reality. Since LS also plays a role in pulmonary clearance (Gradoń et al., Citation1996; Gradoń & Podgórski, Citation1989; Sosnowski et al., Citation2000), even partial inactivation of the surfactant may cause increased lung accumulation of inhaled particulate air contaminants originating from other sources (e.g. atmospheric PM2.5) that could produce synergistic, but adverse, health effect. The chance of pulmonary effects may be higher in subjects who already suffer from lung disorders, especially those influencing the LS functions.
A physicochemical explanation of the effects of aerosol formers on the LS system must consider the possible surface-active properties of these liquids. Interesting results have been published regarding direct interactions between glycerol and phospholipids (DPPC or DPPC/DOPG) studied in Langmuir balance at room temperature (Pocivavsek et al., Citation2011). These authors found that glycerol present in the liquid sub-phase stiffens the compressed phospholipid monolayer by producing an ultrathin (∼10 Å) sublayer (called also adlayer) beneath the lipid film that directly interacts with the lipids at the air/liquid interface. The glycerol is preferentially enriched in the adlayer by mechanism known as demixing of glycerol–water mixture. By such mechanism, glycerol would replace water from solvation shells of hydrophilic parts of lipid molecules. It can be argued that such behavior is similar to adsorption of amphiphilics from the solution at air/water interface, and such enrichment of glycerol at air/water interface has been previously reported (Baldelli et al., Citation1997). The situation is different when lipids are present in the interface, and strong hydrogen bonding between glycerol hydroxyl groups and the lipid phosphate. In such case, reduced mobility of headgroups may lead to stiffening of the interfacial film. It has some consequences on film collapse (folding) at very high compression which, however, are not present in our system. Similar mechanism of water exclusion from solvation shell was proposed in the analysis of glycerol influence on surfactant micellization (D’Errico et al., Citation2005). Addition of glycerol may change electrostatic interactions in solution opposing the attraction of surfactant molecules during their aggregation into micelles. Glycerol can also compete with surfactants for water molecules causing a dehydration of headgoups.
Neither PG nor VG decrease the surface tension of water at low concentrations (D’Errico et al., Citation2005; Dow Chemicals, Citation2017). However, for the highest tested concentrations of 2500 × NDDS, the final concentration of aerosol formers was in the range of 0.29–0.35 g/mL (i.e. approx. 30–35% by mass), and VG or PG at such concentrations reduces the equilibrium ST of water to 65 mN/m or 50 mN/m, respectively (D’Errico et al., Citation2005; Dow Chemicals, Citation2017). Because VG and PG have some surface active properties at higher concentrations, they can affect ST in a mixed system with LS. This decrease is probably related to co-adsorption of aerosol formers and the LS at the air/liquid interface, resulting in a lower ST compared with a system that contains only LS. A synergistic effect was found in the results of the quasi-equilibrium surface tension in mixed systems that were ∼38 mN/m and ∼35 mN/m for PG-LS or VG-LS, respectively, compared to ∼42.5 mN/m for pure LS (detailed data available in the Supplemental Material). This explains why high aerosol former concentrations decrease ε (i.e. ST amplitude) and µ (i.e. ST hysteresis). The reduction of ST during quick compression of the air/liquid interface is caused by an abrupt increase of the surface concentration of the most surface-active compounds, i.e. LS phospholipids. Phospholipid molecules are most stable at the air/liquid interface, so they remain adsorbed during dynamic surface contraction, while other molecules are expelled from the interface (so-called “squeeze-out” effect, Boonman et al., Citation1987; Pastrana-Rios et al., Citation1994). If the equilibrium (mean) ST is lowered because of the presence of VG/PG and LS, then compressing the air/liquid interface that removes VG/PG, causes a smaller drop in ST compared to a system without aerosol formers. This results in a lower ST amplitude during surface oscillations in a mixed systems. The mechanism for this phenomenon can be schematically explained by .
By the same rationale, the time-shift between the variations in surface area and ST is reduced if re-adsorption (return to the air/liquid interface) of the aerosol formers during surface expansion is faster. The recovery of the initial (i.e. quasi-equilibrium) state is faster compared to a system with pure LS. Consequently, the ST fluctuations are smaller and follow the dynamics of interfacial area variations closer in systems with high VG or PG mixed with LS. This takes effect in a reduction of surface tension hysteresis.
Conclusions
The results of this study demonstrate a possible direct physicochemical effects of inhalable e-liquid aerosol in LS, as revealed by changes in ST lowering properties during breathing-like surface variations for high concentrations of aerosol formers, practically independently of the relative content of each component (VG/PG ratio) in the mixture. Notably, the concentrations considered in our work as “high” or “ultra-high” (according to certain assumptions and simplifications of the deposition model for inhaled e-cigarette aerosol), under certain circumstances may reflect concentrations that could be locally achieved in the pulmonary system of e-cigarette users. Thus, the alveolar deposition of inhaled e-liquid aerosols may be responsible for at least partial inactivation of the native biophysical function of the LS. This change in the native function may contribute to some respiratory problems at the local level of a single alveolus or a group of alveoli. The effect might be of special importance in persons with known lung disease and decreased airway clearance, who should have a higher risk of adverse effects of PG/VG on surfactant and airway function. There is a little evidence in the literature for the acute adverse effects of inhaled e-liquids (McCauley et al., Citation2012), but they cannot be completely ignored and should be considered in a safety assessment of EC-vapor. However, the purely physicochemical analysis presented here should be supported by future studies, e.g. on the surfactant harvested from the lungs of active vapers.
Supplemental Material
Download PDF (328.5 KB)Acknowledgments
We thank Dr. Julia Hoeng for a critical review of the manuscript and Dr. Stefan Frentzel for fruitful discussions on the topic.
Disclosure statement
No potential conflict of interest was reported by the authors.
Additional information
Funding
Related Research Data
References
- Asgharian B, Price OT, Rostami AA, Pithawalla YB. (2018). Deposition of inhaled electronic cigarette aerosol in the human oral cavity. J Aerosol Sci 116:34–47.
- Baldelli S, Schnitzer C, Shults MJ. (1997). Sum frequency generation investigation of glycerol/water surfaces. J Phys Chem B 101:4607–12.
- Banerjee R, Bellare JR. (2001). Scoring of surface parameters of physiological relevance to surfactant therapy in respiratory distress syndrome. J Appl Physiol 90:1447–54.
- Bastacky J, Lee CY, Goerke J, et al. (1995). Alveolar lining layer is thin and continuous: low-temperature scanning electron microscopy of rat lung. J Appl Physiol (1985) 79:1615–28.
- Bernhard W, Mottaghian J, Gebert A, et al. (2000). Commercial versus native surfactants. Surface activity, molecular components, and the effect of calcium. Am J Respir Crit Care Med 162:1524–33.
- Boonman A, Machiels FHJ, Snik AFM, Egberts J. (1987). Squeeze-out from mixed monolayers of dipalmitoylphosphatidylcholine and egg phosphatidylglycerol. J Coll Interface Sci 120:456–68.
- Brandon TH, Goniewicz ML, Hanna NH, et al. (2015). Electronic nicotine delivery systems: a policy statement from the American Association for Cancer Research and the American Society of Clinical Oncology. J Clin Oncol 33:952–63.
- Brown CJ, Cheng JM. (2014). Electronic cigarettes: product characterisation and design considerations. Tob Control 23:ii4–10.
- Callahan-Lyon P. (2014). Electronic cigarettes: human health effects. Tob Control 23:ii36–40.
- Cheng T. (2014). Chemical evaluation of electronic cigarettes. Tob Control 23:ii11–7.
- Cho JH, Paik SY. (2016). Association between electronic cigarette use and asthma among high school students in South Korea. PLoS One 11:e0151022.
- Davies MJ, Birkett JW, Kotwa M, et al. (2017). The impact of cigarette/e-cigarette vapour on simulated pulmonary surfactant monolayers under physiologically relevant conditions. Surf Interface Anal 49:654–65.
- D'Errico G, Ciccarelli D, Ortona O. (2005). Effect of glycerol on micelle formation by ionic and nonionic surfactants at 25 degrees C. J Colloid Interface Sci 286:747–54.
- Dow Chemicals. (2017). Available from: https://dowac.custhelp.com/app/answers/detail/a_id/7484/∼/propylene-glycols—surface-tension. [Last accessed: 1 May 2017].
- Enhörning G. (1977). Pulsating bubble technique for evaluating pulmonary surfactant. J Appl Physiol Respir Environ Exerc Physiol 43:198–203.
- Farsalinos KE, Le Houezec J. (2015). Regulation in the face of uncertainty: the evidence on electronic nicotine delivery systems (e-cigarettes). Risk Manag Healthc Policy 8:157–67.
- Farsalinos KE, Polosa R. (2014). Safety evaluation and risk assessment of electronic cigarettes as tobacco cigarette substitutes: a systematic review. Ther Adv Drug Saf 5:67–86.
- Farsalinos KE, Romagna G, Allifranchini E, et al. (2013). Comparison of the cytotoxic potential of cigarette smoke and electronic cigarette vapour extract on cultured myocardial cells. Int J Environ Res Public Health 10:5146–62.
- Fuoco FC, Buonanno G, Stabile L, Vigo P. (2014). Influential parameters on particle concentration and size distribution in the mainstream of e-cigarettes. Environ Pollut 184:523–9.
- Goniewicz ML, Knysak J, Gawron M, et al. (2014). Levels of selected carcinogens and toxicants in vapour from electronic cigarettes. Tob Control 23:133–9.
- Gorguner M, Akdun M. (2010). Acute inhalation injury. Eurasian J Med 42:28–35.
- Gradoń L, Podgórski A. (1989). Hydrodynamical model of pulmonary clearance. Chem Eng Sci 44:741–9.
- Gradoń L, Podgórski A, Sosnowski TR. (1996). Experimental and theoretical investigations of transport properties of DPPC monolayer. J Aerosol Med 9:357–67.
- Green FHY, Schürch S, Gehr P, Lee MM. 2000. The role of surfactant in disease associated particle exposure. In: Gehr P, Heyder J (eds.) Particle-lung interactions. New York-Basel: Marcel Dekker, Inc.; Chapter 14, 533–76.
- Haagsman HP, Van Golde LMG. (1985). Lung surfactant and pulmonary toxicology. Lung 163:275–303.
- Hajek P, Etter JF, Benowitz N, et al. (2014). Electronic cigarettes: review of use, content, safety, effects on smokers and potential for harm and benefit. Addiction 109:1801–10.
- Herold R, Bünger H, Pison U. (1996). Assessment of pulmonary surfactant function using a captive-bubble surfactometer. Coll Surf A: Physicochem Eng Aspects 114:211–9.
- Herting E, Rauprich P, Stichtenoth G, et al. (2001). Resistance of different surfactant preparations to inactivation by meconium. Pediatr Res 50:44–9.
- Iskandar AR, Gonzales-Suarez I, Majeed S, et al. (2016). A framework for in vitro systems toxicology assessment of e-liquids. Toxicol Mech Methods 26:392–413.
- Kodama AT, Kuo CC, Boatwright T, Denninin M. (2014). Investigating the effect of particle size on pulmonary surfactant phase behavior. Biophys J 107:1573–81.
- Kondej D, Sosnowski TR. (2013). Alteration of biophysical activity of pulmonary surfactant by aluminosilicate nanoparticles. Inhal Toxicol 25:77–83.
- Kondej D, Sosnowski TR. (2016). Effect of clay nanoparticles on model lung surfactant: a potential marker of hazard from nanoaerosol inhalation. Environ Sci Pollut Res 23:4660–9.
- Lunkenheimer K, Winsel K, Fruhner H, et al. (1996). Dynamic surface tension and surface area elasticity of adsorbed pulmonary surfactant layers. Coll Surf A: Physicochem Eng Aspects 114:199–210.
- Manigrasso M, Buonanno G, Fuoco FC, et al. (2015). Aerosol deposition doses in the human respiratory tree of electronic cigarette smokers. Environ Pollut 196:257–67.
- Matalon S, DeMarco V, Haddad IY, et al. (1996). Inhaled nitric oxide injures the pulmonary surfactant system of lambs in vivo. Am J Physiol 270:L273–80.
- McCauley L, Markin C, Hosmer D. (2012). An unexpected consequence of electronic cigarette use. Chest 141:1110–3.
- McKay CA. Jr. (2014). Toxin-induced respiratory distress. Emerg Med Clin North Am 32:127–47.
- McRobbie H, Bullen C, Hartmann-Boyce J, Hajek P. (2014). Electronic cigarettes for smoking cessation and reduction. Cochrane Database Syst Rev 12:CD010216.
- Mercer RR, Russell ML, Crapo JD. (1994). Alveolar septal structure in different species. J Appl Physiol 77:1060–6.
- MPPD. (2015). Multiple-path particle dosimetry model. Albuquerque, NM, USA: Applied Research Associates, Inc. Available from: http://www.ara.com/products/mppd.htm (Accessed on August 30, 2015).
- Neumann AW, David R, Zuo Y. (2011). Applied surface thermodynamics, 2nd ed. Boca Raton-London-New York: CRC Press.
- Notter RH. 2000. Lung surfactants: basic science and clinical applications. New York-Basel: Marcel Dekker, Inc.
- Notter RH, Taubold R, Davis RD. (1982). Hysteresis in saturated phospholipid films and its potential relevance for lung surfactant function in vivo. Exp Lung Res 3:109–27.
- Ochs M, Nyengaard JR, Jung A, et al. (2004). The number of alveoli in the human lung. Am J Respir Crit Care Med 169:120–4.
- Orr MS. (2014). Electronic cigarettes in the USA: a summary of available toxicology data and suggestions for the future. Tob Control 23:ii18–22.
- Pastrana-Rios B, Flach CR, Brauner JW, et al. (1994). A direct test of the “squeeze-out” hypothesis of lung surfactant function. External reflection FT-IR at the air/water interface. Biochemistry 33:5121–7.
- Pocivavsek L, Gavrilov K, Cao KD, et al. (2011). Glycerol-induced membrane stiffening: the role of viscous fluid adlayers. Biophys J 101:118–27.
- Polosa R, Campagna D, Sands MF. (2016). Counseling patients with asthma and allergy about electronic cigarettes: an evidence-based approach. Ann Allergy Asthma Immunol 116:106–11.
- Przybyla RJ, Wright J, Parthiban R, et al. (2017). Electronic cigarette vapor alters the lateral structure but not tensiometric properties of calf lung surfactant. Respir Res 18:193.
- Robinson RJ, Hensel EC, Morabito PN, Roundtree KA. (2015). Electronic cigarette topography in the natural environment. PLoS One 10:e0129296.
- Rong Y-H, Liu W, Wang C, et al. (2011). Temperature distribution in the upper airway after inhalation injury. Burns 37:1187–91.
- Rowell TR, Tarran R. (2015). Will chronic e-cigarette use cause lung disease? Am J Physiol Lung Cell Mol Physiol 309:L1398–409.
- Rüdiger M, Tölle A, Meier W, Rüstow B. (2005). Naturally derived commercial surfactants differ in composition of surfactant lipids and in surface viscosity. Am J Physiol Lung Cell Mol Physiol 288:L379–83.
- Schleh C, Kreyling WG, Lehr CM. (2013). Pulmonary surfactant is indispensable in order to simulate the in vivo situation. Part Fibre Toxicol 10:6.
- Schraufnagel DE, Blasi F, Drummond MB; Forum of International Respiratory Societies, et al. (2014). Electronic cigarettes. A position statement of the forum of international respiratory societies. Am J Respir Crit Care Med 190:611–8.
- Selladurai SL, Lamarche RM, Schmidt R, DeWolf CE. (2016). Model lung surfactant films: why composition matters. Langmuir 32:10767–75.
- Sosnowski TR, Gradoń L, Podgórski A. (2000). Influence of insoluble aerosol deposits on the surface activity of the pulmonary surfactant: a possible mechanism of alveolar clearance retardation. Aerosol Sci Technol 32:52–60.
- Sosnowski TR, Gradoń L, Skoczek M, Droździel H. (1998). Experimental evaluation of the importance of the pulmonary surfactant for oxygen transfer rate in human lungs. Int J Occup Saf Ergon 4:391–409.
- Sosnowski TR, Koliński M, Gradoń L. (2011). Interactions of benzo[a]pyrene and diesel exhaust particulate matter with the lung surfactant system. Ann Occup Hyg 55:329–38.
- Sosnowski TR, Kramek-Romanowska K. (2016). Predicted deposition of e-cigarette aerosol in the human lungs. J Aerosol Med Pulm Drug Deliv 29:299–309.
- Stone KC, Mercer RR, Gehr P, et al. (1992). Allometric relationships of cell numbers and size in the mammalian lung. Am J Respir Cell Mol Biol 6:235–43.
- Wallace WE, Keane MJ, Murray DK, et al. (2007). Phospholipid lung surfactant and nanoparticle surface toxicity: lessons from diesel soots and silicate dusts. J Nanopart Res 9:23–38.
- Zhang H, Wang YE, Fan Q, Zuo YY. (2011). On the low surface tension of lung surfactant. Langmuir 27:8351–8.