
 ?Mathematical formulae have been encoded as MathML and are displayed in this HTML version using MathJax in order to improve their display. Uncheck the box to turn MathJax off. This feature requires Javascript. Click on a formula to zoom.
Abstract
We compared early biological changes in mice after inhalation exposures to cigarette smoke or e-vapor aerosols (MarkTen® cartridge with Carrier, Test-1, or Test-2 formulations; 4% nicotine). Female C57BL/6 mice were exposed to 3R4F cigarette smoke or e-vapor aerosols by nose-only inhalation for up to 4 hours/day, 5 days/week, for 3 weeks. The 3R4F and e-vapor exposures were set to match the target nose port aerosol nicotine concentration (∼41 µg/L). Only the 3R4F group showed postexposure clinical signs such as tremors and lethargy. At necropsy, the 3R4F group had significant increases in lung weight and changes in bronchoalveolar lavage parameters, as well as microscopic findings in the respiratory tract. The e-vapor groups had minimal microscopic changes, including squamous metaplasia in laryngeal epiglottis, and histiocytic infiltrates in the lung (Test-2 group only). The 3R4F group had a higher incidence and severity of microscopic findings compared to any e-vapor group. Transcriptomic analysis also showed that the 3R4F group had the highest number of differentially expressed genes compared to Sham Control. Among e-vapor groups, Test-2 group had more differentially expressed genes but the magnitude of gene expression-based network perturbations in all e-vapor groups was ∼94% less than the 3R4F group. On proteome analysis in the lung, differentially regulated proteins were detected in the 3R4F group only. In conclusion, 3-weeks of 3R4F exposure induced molecular and microscopic changes associated with smoking-related diseases in the respiratory tract, while e-vapor exposures showed substantially reduced biological activities.
Introduction
Chronic cigarette smoking causes lung cancer, heart disease, emphysema and other serious diseases in smokers (US DHHS, Citation2014). It is generally recognized that the combustion byproducts, rather than nicotine per se, are primarily responsible for inducing adverse biological responses that lead to the development of chronic diseases. While smoking cessation remains the most effective approach to minimize smoking related diseases, alternative nicotine-delivery products that are devoid or devised to limit the generation of combustion byproducts may offer substantially reduced risk to those who would otherwise continue to smoke. One of the promising alternative tobacco product categories is electronic nicotine delivery systems (ENDS), also known as e-vapor products.
An increasing number of published literature suggests that e-vapor products may have a significantly lower risk potential than combustible tobacco products (NAS, Citation2018; Nutt et al., Citation2014; RCP UK, Citation2016). This is biologically plausible considering that e-formulation ingredients (aerosol formers; flavors) are “generally recognized as safe (GRAS)” in systemic effects, as in food additives, and more importantly chemical compositions of e-vapor aerosols, generated from heating e-liquids typically lower than 350 °C (coil temperature), is much simpler than cigarette smoke (generated from combustion at up to 900 °C). As a result, e-vapor aerosols typically contain no or significantly reduced levels of smoking-related harmful and potentially harmful chemicals (Cheng, Citation2014; Flora et al., Citation2017; Wagner et al., Citation2018), resulting in substantially lower biological activities in vitro (Cervellati et al., Citation2014; Misra et al., Citation2014; Taylor et al., Citation2016) and biomarkers of exposure in clinical trials (McRobbie et al., Citation2015). However, the health risks of long-term chronic inhalation exposures to e-vapor aerosols are currently unknown.
In the United States, all tobacco products including e-vapor products are now regulated under the Food and Drug Administration (FDA) following the deeming regulations (FDA, Citation2016). FDA stated that ‘(We) believe in the concept of a continuum of risk related to tobacco products, and we believe there is a role for modified risk products. Further, we want to preserve e-cigs as one among a number of possible options for adult smokers and believe that fully transitioning smokers to ENDS can reduce the morbidity and mortality associated with tobacco use.’ (https://www.fda.gov/newsevents/speeches/ucm611033.htm). FDA also released the draft ENDS Premarket Tobacco Applications (PMTA) Guidance where they recommend a full assessment of the toxicological profile associated with the new tobacco product including ‘in vivo toxicological studies (to address unique toxicology issues that cannot be addressed by alternative approaches)’. In order to conduct an in vivo inhalation study of e-vapor aerosols, one must first ensure that respirable aerosols are generated consistently over the course of the study and that aerosols to which animals are exposed are characterized and quantified in a reproducible manner. There is currently no standard or consensus on the e-vapor exposure regimen for nonclinical (in vivo or in vitro) inhalation testing. This is challenging, in part because of diverse e-vapor products available on the market and the manner in which they are used by users. A literature search showed very limited rodent inhalation studies on e-vapor aerosols which often did not include fully characterized exposure atmospheres (Crotty Alexander et al., Citation2018; Glynos et al., Citation2018; Werley et al., Citation2016).
In this study, we performed a subacute (3 weeks) mouse inhalation study using MarkTen® e-vapor products and a combustible reference (3R4F) cigarette. The objectives were: (1) to consistently generate and expose e-vapor aerosols to mice via a nose-only inhalation exposure system, and (2) to evaluate biological changes in e-vapor groups compared to the Sham (air) Control as well as the cigarette smoke group. The inhalation exposure to e-vapor aerosols was designed to match the smoke nicotine concentration at the noseport, and the daily exposure duration was the maximum (4 hours/day) recommended for nose-only inhalation exposures for mice (OECD, Citation2009). We measured standard toxicological endpoints (in-life measurements, biomarkers of exposures, respiratory function and histopathology) as well as mechanistic molecular endpoints (inflammatory markers, lung transcriptomics and proteomics). Considering that the exposure duration was short, the observed changes would primarily reflect acute and direct responses on the site of entry (respiratory tract). Nonetheless, mechanistic changes such as molecular markers of inflammation or cellular stress can serve as early indicators toward disease progression upon chronic exposures (Obot et al., Citation2004; Tsuji et al., Citation2011, Citation2015).
Materials and methods
Test materials
All e-vapor products were prepared and supplied by Nu-Mark, a subsidiary of Altria: the MarkTen® cartridge (version 2.6.8; Richmond, VA) and three different e-liquid formulations (Carrier and two Test formulations) () were used in the study. The Carrier formulation was composed of aerosol formers (propylene glycol [PG] and vegetable glycerol [VG]) and 4% nicotine by weight. The Test-1 and Test-2 formulations consisted of the Carrier formulation plus two different (non-menthol) flavor mixtures. The 3R4F commercial reference cigarettes were purchased from the University of Kentucky.
Table 1. Test materials and exposure concentrations.
Animals and group allocation
The housing and animal care practices at the testing facility (Battelle, West Jefferson, OH) met the Association for Assessment and Accreditation of Laboratory Animal Care (AAALAC) standards and the requirements stated in the Guide for the Care and Use of Laboratory Animals [National Research Council (NRC, Citation2011)] and approved by the Institutional Animal Care and Use Committee.
Female C57BL/6 mice (∼10 weeks old) were purchased from Envigo (Indianapolis, IN) and were ∼12 weeks of age on the first day of exposure. Mice were assigned to study groups based on body weight: (1) confirmation of exposure (COE) cohort (6/group), (2) bronchoalveolar lavage (BAL) cohort (15/group), (3) histopathology (HISTO) cohort (12/group), and (4) transcriptomics/proteomics (OMIC) cohort (8/group). Prior to the start of exposure, they were acclimatized to the nose-only exposure tubes for an increasing duration (up to 5 h/day) over 5 consecutive days. Mice had ad libitum access to certified feed (Purina Certified Rodent Diet, LabDiet 5002) and water, except during removal from the home cage for daily exposures or sample collection. The light/dark cycle was maintained at 12 hours of light and dark cycles starting at 6:00 am each day, and the housing room conditions were maintained at 22 ± 2 °C and 50 ± 15 percent humidity. Cages and feeders were changed and sanitized at least weekly.
Exposure regimen and characterization
In this study, a total of four (Carrier, Test-1, Test-2, and 3R4F) exposure systems were used, each including a rotary smoking machine and a nose-only exposure chamber. The Sham Control group was exposed to the high-efficiency particulate air (HEPA)-filtered building air using a separate nose-only exposure chamber. While there is no regulatory guidance on e-vapor product puffing regimen, the Cooperation Centre for Scientific Research Relative to Tobacco (CORESTA, Citation2015) recommended a puffing regimen that is supposed to reflect an average (3-sec) puffing by typical cig-a-like e-vapor users (Vansickel et al., Citation2018). The CORESTA Reference Method 81 regimen (55/30/3; a 55 ± 0.3 mL puff volume, a puff every 30 seconds, a 3-second puff duration, and a near-square puff profile) was used for all three e-vapor products and for 180 puffs/cartridge. Mainstream smoke from 3R4F cigarettes was generated using a modified Canadian Intense regimen (55/30/2; a 55 ± 0.3 mL puff volume, a puff every 30 seconds, a 2-second puff duration, and a near-square puff profile) for 8 puffs/cigarette.
Exposure concentrations were checked daily based on the total aerosol collection mass, hereafter referred to as total particulate matter (TPM) for both cigarette smoke and e-vapor aerosols. Aerosol TPM samples were collected from the exposure noseports using 47 mm Cambridge filters and weighed. While using the term TPM, we note that e-vapor aerosols have no solid carbon-based particles and, unlike cigarette smoke, are not truly “particulate” but more like liquid droplets. The noseport carbon monoxide (CO) concentration, temperature, and percent humidity were monitored daily, and the aerosol particle size was determined weekly. The following analytes were measured twice (Weeks 1 and 3).
PG, VG and nicotine
Cigarette smoke or e-vapor aerosols were collected using filters and sorbent tubes, and the samples were extracted with heptadecane in anhydrous 2-propanol and analyzed by gas chromatography and flame ionization detection (GC-FID).
Carbonyls
Cigarette smoke or e-vapor aerosols were collected using bubblers containing 2,4-dinitrophenylhydrazine (DNPH) and perchloric acid in acetonitrile, for 10 minutes for 3R4F and 15 minutes for e-vapor exposure. Carbonyls (acrolein, acetaldehyde, formaldehyde, propionaldehyde and crotonaldehyde) were analyzed by liquid chromatography and tandem mass spectrometry (LC-MS/MS).
Animal exposures and daily observations
Mice were restrained in polycarbonate tubes and exposed via nose-only inhalation up to 4 hours/day, 5 days/week for 3 weeks, yielding a total of 13 or 14 exposure days. During the first exposure week, the daily exposure was progressively increased to 0.5, 1, 2, 3 and 4 hours for Days 1, 2, 3, 4 and 5, respectively, to allow exposure acclimation. Mice were checked daily for mortality and moribundity. Clinical signs were observed at least twice daily on exposure days, prior to exposure and immediately following exposure, and once daily on non-exposure days. Individual body weights were collected prior to the first exposure, twice weekly (on Mondays and Fridays), and prior to terminal sacrifice. Food consumption was recorded weekly.
Biological measurements (in-life)
The COE cohort was subjected to blood collection immediately after the last exposure. All other cohorts, including BAL, HISTO and OMIC, were subjected to sample collections the day after the last exposure.
Week 1 – carboxyhemoglobin (COHb)
During the exposure acclimation, the blood COHb levels were checked for the 3R4F group (3/group). Whole blood was collected into tubes containing tri-potassium ethylenediaminetetraacetic acid (K3EDTA) and analyzed for COHb using an OSM3 Hemoximeter (Radiometer America Inc., Brea, CA).
Week 2 – respiratory physiology
Respiratory function (respiratory rate [RR], tidal volume [TV], and minute ventilation or volume [MV]) were collected during Week 2, over the first 60 minutes of exposure (6/group). Prior to data collection, mice were placed in nose-only restraint tubes and then subsequently placed in volume displacement plethysmographs. The pneumotach signals were recorded by BioSystemXA (Data Sciences International, St. Paul, MN) data acquisition software (version 2.5.2, Buxco Electronics/Data Sciences International). The MV and the actual mean exposure (TPM) concentration were used to estimate the total inhaled mass.
Week 3 – biomarkers of exposure
Following the last day of exposure (after >3.5 hours of exposure), the COE cohort (6/group) were anesthetized with an intraperitoneal (i.p.) injection of pentobarbital sodium and bled via closed-chest cardiac puncture, using tubes containing K3EDTA. Three out of six samples were analyzed for COHb using an OSM3 Hemoximeter. The remaining three samples were centrifuged for 10 minutes at ∼1500–2000 × g and the resulting plasma samples were analyzed for nicotine and cotinine using high-performance liquid chromatography coupled with tandem mass spectrometry (HPLC-MS/MS).
Biological measurements (terminal)
Bronchoalveolar lavage (BAL)
The day after the last exposure, the BAL cohort (15/group) was anesthetized with an i.p. injection of pentobarbital sodium and whole blood was collected via the retro-orbital plexus into a tube containing K3EDTA. Blood samples were centrifuged for 10 minutes at ∼1500–2000 × g and the plasma samples were frozen until analysis. Following blood collection, each mouse was subjected to BAL collection. Lungs and trachea were exposed by removing the rib cage and sternum, and the trachea was cannulated with a 20-gauge needle and ligated in place. A total of five, 1 mL washes were performed on each mouse. For the first wash of the BAL fluid (BALF), 1 mL of warmed (37 °C) Dulbecco’s phosphate buffered saline (PBS), without magnesium and calcium, was slowly instilled into the lung. The plunger was pulled back to aspirate the fluid back into the syringe and, without removing the syringe, the fluid was instilled once more. The fluid was aspirated once again and this sample was collected as the first wash. For the following four washes, the procedure was repeated (i.e. instilled 1 mL; aspirated, instilled again; aspirated again and then collected) using a PBS solution that also contained 0.325% bovine serum albumin. These four washes were pooled together. The two BALF tubes from each mouse consisted of tube 1, which contained the first wash, and tube 2, which contained washes 2 through 5, and were centrifuged at 300 × g for 5 minutes. The cell pellets from both BALF tubes were combined and assessed for cytology. The supernatant from the first wash was collected into a 1.5-mL screw-top Eppendorf RNase free LoBind tube and frozen (< −60 °C) until analysis.
BALF cytology
The cell pellets from the two BALF tubes from each mouse were combined and resuspended in 1 mL of saline containing 1% CD16/CD32 antibody (BD Bioscience, San Diego, CA) for flow cytometry analysis (see Supplemental Materials). Fluorescence-missing-one (FMO) controls were generated with C57BL/6 whole blood. Cells were washed with BD Stain Buffer and resuspended in 2 mL of 1× Fix Lyse Solution (eBioscience, San Diego, CA) to both lyse the red blood cells and fix the cells prior to storing specimens for 15 minutes, at room temperature, in the dark. The cells were then stored at 2–8 °C protected from light for up to 48 hours prior to analysis. Flow cytometry data were acquired on an LSR Fortessa using FACSDIVA (Version 8.0.1; BD Biosciences, San Jose, CA). The samples were exhausted to ensure the maximum cell numbers for rare populations. Gates were generated for the target populations based upon bimodal responses and FMO stains. Using the absolute number of cells per milliliter of BALF, the percentage of the target population was applied to calculate the absolute number of immune cells obtained from the BAL.
BALF (first wash) analyses
The BALF samples were randomized before analysis for (1) Multi-Analyte Profiling (MAP) of pro-inflammatory mediators including cytokines, (2) matrix metalloproteinase (MMP) activity, and (3) cytokines with targeted proteomics, using parallel reaction monitoring (PRM) (see Supplemental Materials). The MAP analyses were performed using Luminex® xMAP® technology (Luminex, Austin, TX) and commercially available Milliplex panels (MCYTOMAG-70KPMX and MCVD1MAG-77K kits; EMD Millipore, Burlington, MA; Supplemental Materials). The MMP activity was measured using gelatinolytic activity assays with fluorescence-labeled gelatin (EnzChek® Gelatinase/Collagenase Assay Kit; Invitrogen, Carlsbad, CA). Samples were processed using a Biognosys Sample Prep Pro kit (P/N 3013, Biognosys, Zurich, Switzerland) and the LC/MS analysis. Retention time scheduling was performed based on reference runs using SpectroDive software (Biognosys, Zurich, Switzerland) and the Xcalibur user guide for proteomics analysis (Thermo Fisher Scientific, Waltham, MA). The raw data were analyzed using SpectroDive software.
Plasma matrix metalloproteinase (MMP) and myeloperoxidase (MPO)
Plasma samples were processed using the Biognosys Sample Prep Pro kit (P/N 3013, Biognosys, Zurich, Switzerland) and tested for MPO abundance using PRM. The plasma MMP abundance was measured by Luminex technology with the mouse MMP Magnetic Bead Panel 2 (proMMP-9, MMP-12, EMD Millipore).
Lung transcriptomics/proteomics
The day after the last exposure, the OMIC cohort mice (8/group) were anesthetized by i.p. injection of pentobarbital sodium. Mice were whole-body perfused at a rate of 7 mL/minute transcardially with cold saline, and the left and right lungs were collected separately. Efforts were made to minimize RNA degradation, including the use of RNase-free sterile collection tubes and petri dishes, cleaning surfaces, and surgical tools with RNaseZap® reagent (Ambion), performing dissection and collection within 15 minutes after perfusion, and rapidly snap-freezing tissues in liquid nitrogen.
Left lung samples were randomized and 20-µm serial sections (Leica CM3050 cryostat; Leica Biosystems, Nussloch, Germany) were collected for RNA isolation followed by transcriptomics analysis, or for protein isolation followed by multiplexed isobaric Tags for Relative and Absolute Quantitation (iTRAQ®; AB Sciex, Framingham, MA, USA). For iTRAQ®, ∼6 times more slices were collected. During sectioning, all tubes containing slices were maintained on dry ice or in a cryostat chamber (−20 °C) to avoid thawing and were subsequently stored at −80 °C.
Samples were randomized prior to processing. Total RNA in lung tissue slices, including miRNA, was extracted using the RNeasy mini kit RLT protocol (Qiagen, Hilden, Germany). The quantity of the isolated RNA was determined using a NanoDrop 1000 instrument (Thermo Fisher Scientific, Waltham, MA) and concentrations were distributed from 33.1 to 167.8 ng/μL (average 83.4). Quality was determined using a 2100 Bioanalyzer (Agilent Technologies, Santa Clara, CA). Only samples with an RNA integrity number greater than 6 were kept for further analysis (from 6.1 to 8.5 with an average of 7.0).
Gene expression profiling
The High Throughput 3′ In Vitro Transcription PLUS (HT 3′ IVTPLUS) kit (Affymetrix, Santa Clara, CA) was used. cDNA was hybridized on Affymetrix GeneChip® Mouse Genome 430 2.0 arrays (Affymetrix, Santa Clara, CA). Raw CEL files were background-corrected, normalized and summarized using frozen-robust microarray analysis (McCall et al., Citation2010). Microarray expression values were generated from all arrays passing quality control checks that were derived using the custom Chip Description File environment mouse4302mmentrezg v16.0 (R-package, Brainarray, University of Michigan, Ann Arbor, MI). Quality controls, including pseudo-images, normalized unscaled standard error plots, relative log expression (RLE) plots, and median absolute value RLE (MARLE) were performed according to Gautier et al. (Citation2004). Moderated p values, calculated with the empirical Bayes approach, for the treatment versus control comparisons were generated using the limma package (Smyth, Citation2004) and adjusted using the Benjamini-Hochberg false discovery rate (FDR) multiple test correction (Benjamini and Hochberg, Citation1995).
Biological impact factor (BIF)
We used the causal biological network models (http://causalbionet.com; Talikka et al., Citation2015) to assess an exposure impact on lung biology and computed the Network Perturbation Amplitude (NPA) for each network, as previously described (Martin et al., Citation2014). The network models have two layers. The upper layer or the model backbone represents the actual network model and consists of causal molecular interactions and signaling pathways known to be regulated in lung tissue. The lower layer represents gene expression changes known to be elicited by the entities (signaling molecules) in the model backbone. The network models were scored with transcriptomics datasets using the differential gene expression to infer whether entities in the network were activated, inhibited, or altered. NPA scores carried a confidence interval accounting for the experimental variation, and the associated p values were computed. In addition, companion statistics which were derived to inform on the specificity of the NPA score to the biology described in the network models were reported as *O and K* if their p values fell below the threshold of significance of .05. A network was considered to be significantly impacted by exposure if the three values (the p value for experimental variation and the *O, and K* statistics) were below .05. The BIF was derived by aggregating the scores from individual network perturbations into one holistic score (Hoeng et al., Citation2014; Thomson et al., Citation2013).
Untargeted proteomics analysis/isobaric tagging
The LC-MS/MS-based quantitative analysis with iTRAQ® technology was used for lung proteomics. iTRAQ® analysis sets were defined to consist of one sample replicate from each of the five treatment groups, with eight separate iTRAQ® sets corresponding to the eight replicates. In addition, a pooled reference mix was included in each iTRAQ® set. The sample replicates from each treatment group were randomly assigned to the iTRAQ® sets; within each iTRAQ® set, the isobaric-reporter labels were randomly assigned to each sample and the reference mix.
The iTRAQ® procedure has been described previously (Phillips et al., Citation2015). Briefly, lung samples were homogenized in tissue lysis buffer and the proteins were precipitated using acetone. The extracted protein quantity and quality were determined using the Bradford assay (Bradford, Citation1976) and the Labchip GX II instrument (Caliper Life Sciences, Hopkinton, MA), respectively. Fifty micrograms of protein were used for iTRAQ® 8-plex labeling according to the manufacturer’s instructions (AB Sciex, Framingham, MA, USA). An Easy-nLC 1000 instrument connected online to a Q-Exactive MS mass-analyzer (Thermo Fisher Scientific, Waltham, MA) was used for LC-MS/MS analysis. Identification and relative quantitation of proteins were conducted using Proteome Discoverer software (Thermo Fisher Scientific, Waltham, MA) and were further processed in the R statistical environment.
The quantification data were filtered for a q value <.01 and for ‘unique’ quantification results, as defined by the Proteome Discoverer software. Global variance stabilization normalization was performed with the respective Bioconductor package in R (Huber et al., Citation2002; Hultin-Rosenberg et al., Citation2013). Each iTRAQ® reporter ion set was normalized by its median, and protein expression values were calculated as the median of these normalized peptide-level quantification values (Herbrich et al., Citation2013). The quality of the mass-spectrometry runs and individual samples were checked automatically during computational processing. To detect differentially expressed proteins, a linear model was fitted for each exposure condition and the control groups (Sham and Carrier for Test-1 and Test-2). Moderated p values, calculated with the empirical Bayes approach, for the treatment versus control comparisons were generated using the limma package (Smyth, Citation2004) and adjusted using the Benjamini-Hochberg FDR multiple test correction (Benjamini and Hochberg, Citation1995).
Gene/protein set and functional association network analysis
Gene/protein-set analysis was performed with the fold-change as the protein-level statistic and the mean as the set statistic. The KEGG database was used as the protein/gene-set collection (Kanehisa et al., Citation2017). Statistical significance was assessed using permutation of the proteins (Q1 statistics) and the samples (Q2 statistics) (Ackermann and Strimmer, Citation2009). For each test, the p value was adjusted using the Benjamini-Hochberg procedure.
Histopathology
Mice were not fasted prior to the terminal necropsy. The morning after the last exposure, the HISTO cohort (12/group) were weighed, terminated by administration of 70% CO2/30% O2 followed by exsanguination, and subjected to necropsy. Each necropsy included examination of the external surface of the body and all orifices, the cranial, thoracic, abdominal, and pelvic cavities and their contents, and collection of tissues (a list in Supplemental Table S1). The collected tissues were placed in 10% neutral buffered formalin (NBF), and eyes with optic nerve were first fixed in Davidson’s fixative and subsequently transferred to 10% NBF. The lungs were inflated with 10% NBF via the trachea at 25 cm of water constant pressure. The following organs were weighed at terminal necropsy: adrenals, brain, heart, liver, lungs with bronchi and thymus. Organ weights and the terminal body weight were used to calculate both the organ to body weight and the organ to brain weight ratios. Gross lesions were noted at necropsy and selected tissues were processed for microscopic examination. They were trimmed, embedded in paraffin, sectioned at ∼4–6 micrometers, mounted on glass slides, stained with hematoxylin and eosin, and examined by a board-certified veterinary pathologist: nasal turbinates (four sections), trachea, larynx (three sections), lungs (with mainstem bronchus; section from all lobes), heart and liver.
Statistics
Exposure and aerosol constituent concentrations were summarized in means and standard deviations. Clinical observations and gross lesions were reported as incidences. Histopathological findings and severity were reported as incidence and mean severity.
Statistical analyses on in-life measurements (body weight, food consumption, respiratory physiology), COE, organ weights and BALF flow cytometry data were determined by parametric or nonparametric analysis of variance (ANOVA) when N ≥ 3. Normality was determined by the Shapiro–Wilks test and homogeneity of variances was determined by Levene’s test. Data were log-transformed if necessary to meet parametric assumptions. For parametric data determined to be normally distributed and homogenous among groups, an ANOVA F-test was used to determine whether there were differences among the group means. If the ANOVA F-test was significant, tests for differences between the control and each of the comparison groups were conducted using Dunnett’s test, adjusted for multiple comparisons. For nonparametric data that were not normally distributed and/or nonhomogeneous, a Kruskal–Wallis test was used to determine the group differences. If the Kruskal–Wallis test was significant, tests for differences between the control and each of the comparison groups were conducted using Wilcoxon tests and the Bonferroni-Holm method to correct for multiple comparisons. Statistical significance was reported at the 0.05 level after accounting for multiple comparisons where indicated.
Statistical analyses on the BALF (first wash) and plasma biomarkers were performed as follows: raw data were used for MAP and PRM analysis as resulted from instruments’ back-fits followed by background correction based on (when available) blank samples. All sample results were used for the statistical analysis, except for the analysis of MMP measurements in BALF (three samples were excluded from the analysis because of negative back-fit values, flagged by the instrument as non-conforming results). For all analyzed endpoints in either BALF or plasma, descriptive statistics are reported separately for treated, control and blank samples. Treatment groups were compared using t-tests. Comparisons were cast within the linear mixed-effects model framework, for each endpoint (i.e. Y), a random-intercept linear statistical model of the following form was built:
where τi is the treatment group i, βj is the analysis batch or instrument plate j, and εijk is the error term for the animal sample k. The t-tests were performed on the fixed parameters of the statistical model (τi) corresponding to the group treatments. The raw (non-adjusted) p values were stored for each treatment comparison. The targeted endpoints were transformed to the logarithmic scale prior to statistical modeling, to stabilize the variability of the outcomes (heteroskedasticity was often present, and great variability was observed at higher quantities of proteins or cytokines). The logarithmic transformation also achieved a symmetric error distribution and valid model hypotheses. Statistical results were illustrated using boxplots.
Results
Exposure characterization
The exposure atmosphere () was well controlled during the 3-week exposures. The mean TPM was within 2% of the target concentration and the percent relative standard deviation (% RSD) was 3–5% for all exposure groups. The actual mean noseport nicotine concentrations were comparable between the e-vapor (43–44 µg/L) and the 3R4F (41 µg/L) exposures. Because of the lower nicotine/TPM ratios of e-vapor aerosols compared to the 3R4F cigarette smoke, the noseport TPM concentrations were about 3-fold higher for the e-vapor (actual: 1410–1583 µg/L TPM) than the 3R4F (actual: 554 µg/L TPM) exposures. The aerosol particle size at the noseport was within the respirable range (Ménache et al., Citation1995; Raabe et al., Citation1988) for all exposure groups (0.7–1.0 µM MMAD; 1.5–1.7 GSD). The noseport temperature and supplied air relative humidity were within the acceptable limits of 22 ± 2 °C and 55 ± 15%, respectively.
Table 2. Exposure characterization.
Overall, the 3R4F exposures contained carbonyl concentrations at the noseport similar to the data reported in the literature (Fujimoto et al., Citation2015; Phillips et al., Citation2015). For e-vapor aerosols, only acetaldehyde and formaldehyde were detected but at much lower levels (>99% and >82% lower acetaldehyde and formaldehyde levels, respectively) compared to the 3R4F smoke. Other carbonyls (acrolein, propionaldehyde and crotonaldehyde) were below or near the detection limits in e-vapor aerosols. The CO was detected only in the 3R4F exposures, while PG was only in the e-vapor exposures.
In-life observations
A few sporadic clinical signs were observed in the e-vapor groups at similar incidences to the Sham Control and without clear differences among e-vapor groups. In contrast, the 3R4F group displayed postexposure clinical signs at much higher frequency and incidence than the Sham Control or e-vapor groups. Some observations, such as “cold to touch”, “lethargy”, “tremors”, “eye abnormality”, “hunched” were reported multiple times in all or a majority of 3R4F mice throughout the exposure period.
The impact of 3 weeks of nose-only exposures on body weight was minimal. All groups, including the Sham Control, had a slight decrease in body weight at the end of weekly exposure (Friday) but, after two days of no exposures (weekends), gained weight by the following Monday. There was no meaningful difference in body weight or body weight gain in any of the treatment groups compared to Sham Control. While the differences in food consumption were also minimal, the 3R4F group tended to have slightly lower consumption compared to the Sham Control or e-vapor groups (see Supplemental Table S2).
Biomarkers of exposure and respiratory function
The daily exposure duration during Week 1 was gradually increased over 5 consecutive days to help mice (especially the 3R4F group) acclimatize to the exposure regimen. The postexposure blood COHb of the 3R4F group increased with increasing exposure duration, reaching 48.2% after 4 hours of exposure on Day 5. The level of COHb remained the same for the 3R4F group (46.9%) after 3 weeks of exposure, while the Sham Control and all e-vapor groups had background COHb levels (≤1.5%) ().
TABLE 3. Biomarkers of exposure and respiratory function.
During exposure, the RR was slightly but statistically decreased in all exposure groups (see Supplemental Figure S1), with the largest decrease in the RR observed with the 3R4F group (58% reduction compared to Sham Control). The TV was not significantly different between the Sham Control and any of the exposure groups. Reflecting the difference in RR, the MV was substantially lower in the 3R4F group (55%) but only slightly lower in the e-vapor groups (7–22%) compared to the Sham Control. When the total inhaled mass (TIM) was estimated based on the actual TPM and MV, the two test groups had 4.6- to 5.5-fold higher TIM intake compared to the 3R4F group.
When measured immediately after exposure, all e-vapor groups had significantly higher plasma nicotine and cotinine levels compared to the 3R4F group, despite the fact that the aerosol nicotine concentrations at the noseport were matched across the e-vapor and 3R4F groups (). The two test groups had ∼4-to 5-fold higher plasma nicotine and cotinine concentrations compared to the 3R4F group. Among e-vapor groups, the two test groups had comparable plasma nicotine and cotinine levels. The Carrier group had the highest mean plasma levels but the values were highly variable and not statistically different compared to either of the test groups ().
BALF (first wash) and plasma data
The first wash BALF samples were analyzed for inflammatory mediators and selected BALF data are shown in Supplemental Figures S2 and S3. Most cytokines were detected at very low levels, although some statistical differences were detected between the treated and the Sham Control (descriptive statistics in Supplemental Table S3). Caution is warranted in interpreting their biological relevance considering that the BALF cytokine levels were near the detection limits.
Changes in BALF mediators were observed mainly in the 3R4F group (e.g. IP-10, MIP-1b) (Supplemental Figure S2 and Supplemental Table S3). Some trends were also observed in e-vapor groups; for example, GM-CSF and IL-7, albeit at very low levels, were down-regulated in all exposure groups compared to the Sham Control. For some mediators, changes in the 3R4F and e-vapor groups were in a different direction compared to the Sham Control: IL-6 and proMMP-9 were no different or slightly down-regulated in the e-vapor groups but up-regulated in the 3R4F group. To complement the MAP analysis, additional proteins were measured in BALF with targeted mass-spectrometry (PRM). Compared with the Sham Control, most changes were again observed with the 3R4F group (e.g. Mpo (PERM)), while no clear changes were detected in any of the e-vapor groups (Supplemental Figure S3 and Supplemental Table S3). Some qualitative trends were observed: uteroglobin/CC10 (UTER) tended to be slightly down-regulated in all treatment groups especially the 3R4F group. Serping1 (IC1) was slightly up-regulated in the Test-2 and 3R4F groups, while cathepsin S (CATS) was slightly up-regulated in the Carrier group. Plasma samples were analyzed for biomarkers of oxidative stress (MPO) and protease (MMP-12 and proMMP-9) but their levels were not different between any exposure group and the Sham Control.
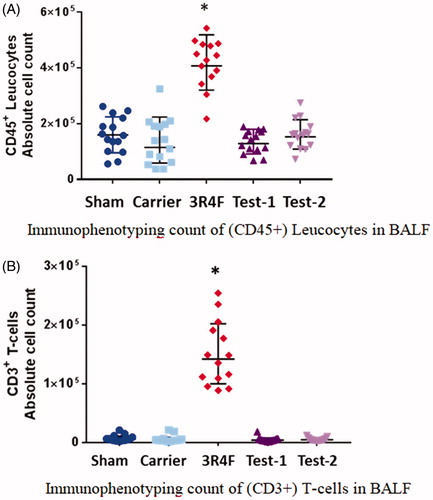
Unlike minimal changes in the BALF (first wash) parameters, BAL cytology data demonstrated a clear sign of pulmonary inflammation in the 3R4F group. Flow cytometric immunophenotyping differentiated and quantified the number as well as activation status of BALF immune cells (the CD45+ leucocytes and CD3+ T-cells are plotted as an example; ): Additional details are found in Supplemental Table S4 and Supplemental Figures S4–S8. Following 3 weeks of exposure, the 3R4F group showed a clear sign of pulmonary inflammation with significant increases in the number and activation status of T-cells, B-cells, interstitial macrophages/monocytes, neutrophils and dendritic cells, compared with the Sham Control, as well as the e-vapor groups. While the 3R4F group had a significantly lower (live) alveolar macrophage count (See Supplemental Table S4), they had a higher number of activated alveolar macrophages (higher expression of MHC II and/or CD54) compared with the Sham Control or e-vapor groups. Between any of the e-vapor groups and the Sham Control, there was no significant difference in the number or activation status of BALF immune cells.
Figure 1. Bronchoalveolar lavage fluid (BALF) cytology. (A) Immunophenotyping count of (CD45+) leucocytes in BALF. (B) Immunophenotyping count of (CD3+) T-cells in BALF. The absolute numbers of CD45+ leucocytes or CD3+ T-cells in the BALF increased significantly in the 3R4F group compared to the Sham Control, but remained unchanged in the e-vapor groups. There were no significant differences between e-vapor groups. *Statistically different compared to the Sham Control (p<.05).
Lung transcriptomics and proteomics
Differential gene expression is shown as volcano plots as the log fold-change with statistical significance (). The most significant changes compared with the Sham Control were observed with 3R4F exposure that triggered up-regulation of 4028 genes and down-regulation of 4601 genes. In e-vapor groups, there were minimal but some differential changes in gene expression following Test-2 exposures such that 1750 genes and 1032 genes were significantly up- and down-regulated, respectively. Most of the differentially expressed genes in the Test-2 group were similarly found in the 3R4F group (see Supplemental Figure S10(A)) but at much lower magnitude (see Supplemental Figure S10(B)). Exposure to the Carrier and Test-1 exposures did not trigger any differential gene expression compared with the Sham Control.
Figure 2. Volcano plots representing the differentially expressed genes in the lung. For each gene, the alteration in gene expression, calculated as the log2 fold-change, and plotted on the x-axis. The statistical significance (false discovery rate [fdr] < 0.05), proportional to the negative log10-adjusted p value, is plotted on the y-axis. Dots highlight genes that are statistically significantly up- and down-regulated (right and left quadrants, respectively) compared with sham.
![Figure 2. Volcano plots representing the differentially expressed genes in the lung. For each gene, the alteration in gene expression, calculated as the log2 fold-change, and plotted on the x-axis. The statistical significance (false discovery rate [fdr] < 0.05), proportional to the negative log10-adjusted p value, is plotted on the y-axis. Dots highlight genes that are statistically significantly up- and down-regulated (right and left quadrants, respectively) compared with sham.](/cms/asset/092ef7ab-7543-46ba-a1fa-5803726f10ae/iiht_a_1576807_f0002_c.jpg)
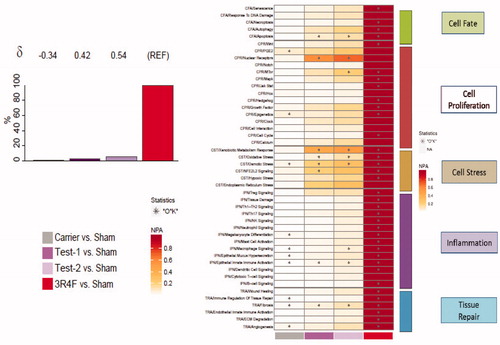
As described in the Materials and Methods section, the measured gene expression changes were used to infer the activation or inhibition of common upstream regulators that must have changed theoretically to explain the actual measured gene expression data (concept of backward reasoning). Those regulators were assessed in the frame of manually curated network models. The models capture mechanistic details of various respiratory system processes that contribute to inflammation, cellular fate, tissue repair and angiogenesis, cellular stress, and cellular proliferation processes, well known to be impacted by cigarette smoke exposure. The impact on the individual network models that were perturbed by each exposure is shown in the heatmap of NPA scores, with the greatest biological impact across all five networks observed with 3R4F exposure (). Therefore, the BIF of the e-vapor exposure is shown relative to the 3R4F exposure (REF), with the δ value illustrating how similar the underlying network perturbations were with respect to the reference. Among e-vapor groups, the Carrier group induced the least impact compared with the other e-vapor or 3R4F groups. It appeared that the Carrier group had an opposite effect on most of the impacted networks (as demonstrated by the negative δ values); however, the magnitude of effect was extremely small (e.g. ∼99% lower than the perturbations observed in the 3R4F group) and unlikely to be biologically meaningful. The most impacted networks upon e-vapor exposure were the nuclear receptor pathway in the context of cell proliferation and the xenobiotic metabolism response and osmotic stress, both in the context of the cell stress network. Between the two test products, the Test-2 group exerted a slightly higher impact than the Test-1 group (), although the network perturbations observed in either of the test groups were ∼94% lower than the perturbations observed in the 3R4F group.
Figure 3. Biological impact factor (BIF) and network perturbation amplitude (NPA). (A) BIF scores: the percentages give the relative biological impact, which is derived from the cumulated network perturbations caused by the treatment relative to the reference (the treatment showing the highest perturbation; here 3R4F as REF). Only the significant network perturbations are summarized further into this single number; hence, any component entering the score is significant by definition. For each treatment comparison, the δ value (−1 to 1) indicates how similar the underlying network perturbations are with respect to the reference. A value of 1 indicates that all the networks are perturbed by the same mechanisms. (B) Heatmap NPA scores: summary of subnetworks. A network is considered perturbed if, in addition to the significance of the NPA score with respect to the experimental variation, the two companion statistics (O and K), derived to inform on the specificity of the NPA score with respect to the biology described in the network, are significant. *O and K statistic p values below .05 and NPA significant with respect to the experimental variation.
The LC-MS/MS-based proteomic analysis quantified a total of 2611 proteins in lung samples and the global impact on the proteome of each exposure condition is illustrated in the volcano plots (Supplemental Figure S9). On average, 1438 proteins were comparable across all contrasts and the only clear proteome responses were observed in the 3R4F group compared with the Sham Control; 113 proteins were significantly up-regulated, and 91 proteins were down-regulated. No significant changes were observed following exposure to any of the e-vapor groups compared to the Sham Control.
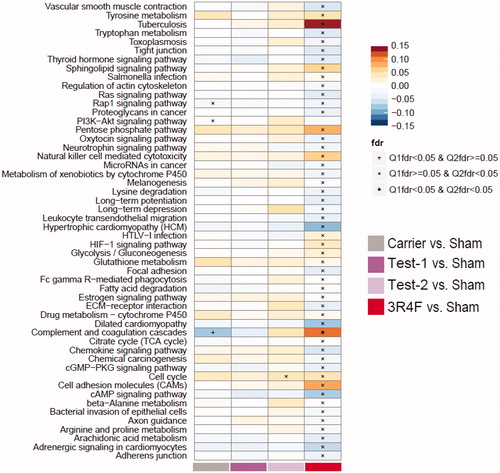
Protein sets that were significantly affected by exposure were identified using the KEGG compendium (Kanehisa et al., Citation2017). Set enrichment analysis is a computational method that determines whether an a priori defined set of proteins or genes exhibits statistically significant differences between the exposed and control states. For biological interpretation, it is important to note that not all protein/gene sets in the diverse KEGG collection are necessarily directly relevant to our biological context. Consistent with the findings above, the 3R4F exposures induced the strongest responses, while e-vapor exposures did not result in significantly deregulated protein sets, with a few responses in the “cell cycle” set and the “complement and coagulation cascade” set (). The only statistically significant changes in either of the test groups were the “cell cycle” set in the Test-2 group versus the Sham Control.
Figure 4. Proteome set enrichment in the lung. Set enrichment was assessed by gene-set analysis (GSA). The fold-change compared with Sham Control is used as the protein-level statistic, the mean as the set statistic, and protein (Q1) and sample (Q2) permutation to assess statistical significance. Enrichment results are normalized per pathway, and the normalized GSA enrichment score is mapped to the color scale. Significance is indicated for the Q1 and Q2 tests in the figure, based on false discovery rate (fdr)-adjusted p values.
Terminal organ weights
Following 3 weeks of exposure, the most notable changes in the organ weights were observed with the 3R4F group (). In the lung, the 3R4F group had significantly higher absolute weight and relative (to the body or brain) weights, compared to all of the e-vapor groups and the Sham Control. The 3R4F groups also showed notable changes in the liver weight such that the absolute and relative liver weights were significantly lower compared to the Sham Control or the e-vapor groups. In contrast, there were no significant differences in the absolute or relative lung or liver weights between any of the e-vapor groups and the Sham Control.
Table 4. Organ weights.
The 3R4F group had significant increases in the absolute and relative thymus weights compared with the Sham Control. Among e-vapor groups, the absolute and relative thymus weights decreased slightly and the difference compared to the Sham Control was statistically significant for the Test-2 group. Between the test groups, the Test-2 group had significantly lower absolute and relative thymus weights than the Test-1 group but the weights of either test group were not statistically different from those of the Carrier group. When compared with the 3R4F group, all the e-vapor groups had significantly lower absolute and relative thymus weights. There were no meaningful differences in the weights of other collected organs (brain, heart, adrenal gland) across the treatment groups.
Histopathology
Histopathological findings of the respiratory tract are summarized in . Three weeks of exposure induced the most changes in the respiratory tract of the 3R4F group. In the nose, all mice in the 3R4F group showed focal nasal respiratory epithelial erosion, focal metaplasia (either olfactory to respiratory or respiratory to squamous cell), inflammation, and/or respiratory epithelial regeneration. The only microscopic finding in e-vapor groups was focal respiratory epithelium to squamous cell metaplasia in a few Test-2 mice (3/12) ().
Table 5. Histopathology.
The laryngeal lesions were observed in all treatment groups including the Sham Control, with the most prominent (severity and incidence) findings observed in the 3R4F group. The neutrophilic inflammation (minimal) and squamous metaplasia and/or hyperplasia (minimal to mild) were present within the larynx of all mice in the 3R4F group, at the base of the epiglottis and/or in the lateral wall just dorsal to the ventral pouch. Laryngeal lesions were also observed in the e-vapor and Sham Control groups but they were confined to the epiglottis, including: (1) the respiratory-to-squamous epithelial metaplasia at the base of the epiglottis (all e-vapor groups, Sham Control) and (2) minimal hyperplasia of the epithelium overlying the base of the epiglottis (Test-1 group). There were no microscopic lesions in the lateral wall or ventral pouch in any of the e-vapor groups and the Sham Control.
In the lung, histiocytic infiltrates (large foamy macrophages containing brown pigment) as well as mixed cellular infiltrates (composed of neutrophils and lymphocytes) were present in all mice in the 3R4F group. Cellular infiltrates were observed in some mice in the e-vapor groups and the Sham Control but at substantially lower severity and incidence compared to the 3R4F group. The histiocytic infiltrates (specifically macrophages without pigment) were observed in the Test-2 group (7/12) and the Sham Control (2/12) at minimal severity. Altogether, while some minimal microscopic changes were observed in the e-vapor groups, both the severity and/or incidence were substantially lower or absent compared to the 3R4F group. The microscopic changes observed in the e-vapor groups were overall comparable to the findings in the Sham Control.
Discussion
We demonstrated that e-vapor aerosols in this study have substantially reduced biological activities compared to cigarette smoke, consistently across the standard and mechanistic endpoints. We observed some differences in e-vapor groups compared to the air control but the differences were minimal, sporadic and near the background levels.
Three weeks of exposures induced the most notable impacts in the 3R4F group, such as microscopic lesions (irritation and inflammation in the respiratory tract), increased lung weights, increased biomarkers of pulmonary inflammation and gene/protein expression in the lung. These changes in the respiratory tract of the 3R4F group were compatible to the findings reported in other cigarette smoke-exposed mouse inhalation studies, including both nose-only (Obot et al., Citation2004; Tsuji et al., Citation2011) and whole-body exposures (Phillips et al., Citation2015).
In contrast to substantial literature findings on cigarette smoke exposures, there were no comparable mouse nose-only inhalation studies reported on e-vapor aerosols. Typically, e-vapor aerosols are generated and sampled directly from an individual cartridge under analytical testing conditions. In the current study, we demonstrated that it is feasible to generate and deliver stable e-vapor aerosols at fairly high concentrations (up to 1500 µg/L TPM) using e-vapor products such as MarkTen® for repeated nose-only inhalation exposures in mice. The delivered aerosol particle size was within the respirable range for all exposure groups (MMAD ≤1.0) and key constituents (nicotine, PG and carbonyls) were consistently measured at the noseport.
Considering differences in aerosol characteristics, we exposed the e-vapor groups to much higher aerosol mass (2.5–2.8-folder higher TPM than 3R4F groups) to match the nicotine levels at the noseport. Even at higher TPM, the accompanying carbonyl levels were substantially lower in e-vapor aerosols. Among five carbonyls measured, only acetaldehyde and formaldehyde were consistently detected in e-vapor aerosols and at very low, near background levels. Formaldehyde in e-vapor aerosols was less than 95% of the level in cigarette smoke, as similarly reported by others (Flora et al., Citation2017; Goniewicz et al., Citation2014; Ogunwale et al., Citation2017; Wagner et al., Citation2018).
The aerosol nicotine concentration was selected based on the maximum tolerated exposure level (∼500–600 µg/L TPM) that was successfully tested in previous mouse cigarette smoke-induced COPD studies (Phillips et al., Citation2016; Tsuji et al., Citation2015), with the blood COHb not to exceed ∼50% and the plasma nicotine levels below ∼42 µg/L (Haussmann and Farris, Citation2016). In particular, the high CO (and possibly other smoke constituents such as carbonyls) in 3R4F exposures would be responsible for transient but clear signs of acute toxicity immediately following daily exposure, but did not significantly impact survivals or body weights compared to the Sham Control. The food consumption did slightly but consistently decrease in the 3R4F group and the body weight gain could decline compared to the Sham Control if the smoke exposures extend for a longer duration (Tsuji et al., Citation2015). In contrast, e-vapor groups were exposed to high nicotine aerosols but not high CO and other smoke constituents, and did not show meaningful changes in in-life parameters (food consumption, weight gain and postexposure clinical signs) compared to the Sham Control.
Clear signs of irritation and inflammation in the respiratory tract of the 3R4F group were in stark contrast to the lack of, or minimal, responses observed in all e-vapor groups, despite the fact that the e-vapor groups’ biomarkers of exposure, such as the plasma nicotine levels of the test groups (417 and 506 ng/mL), were about 4-fold higher than the level of the 3R4F group (119 ng/mL). These plasma nicotine levels in the e-vapor groups were also about 20–40-fold higher than the typical plasma levels reported in cigarette smokers or e-vapor users (∼10–20 µg/L) (St Helen et al., Citation2016). Despite the higher aerosol mass and nicotine exposures, the biological impact of e-vapor aerosols in the respiratory tract was substantially less than the 3R4F exposure, consistent with the differences (reduction) in aerosol constituents.
The pulmonary inflammatory responses were most clearly illustrated with the BALF cellular profiles wherein 3R4F exposures increased the total infiltrating cells, total and activated T-cells (CD4+ and CD8+), B-cells, interstitial macrophages/monocytes, dendritic cells, neutrophils and activated alveolar macrophages. In addition to the increased number of inflammatory cells, their activation markers were increased (such as CD69, CD54 and HLA-DR high). These increases in neutrophils and lymphocytes in the BALF have been previously reported in both nose-only and whole-body cigarette smoke studies in mice (Phillips et al., Citation2015; Tsuji et al., Citation2015). In particular, the early changes of the BALF cytokine profile were comparable to the findings after one month of whole-body inhalation exposures in Phillips et al. (Citation2015), where up-regulation of IP-10, MCP-1, MIP-1a, MIP-1b and MIP-2 was observed in the smoke group. Exposure to any of the e-vapor aerosols, however, did not affect the number of immune cells nor the activation status compared to the Sham Control.
Consistent with the data above, the treatment-related microscopic changes were mainly limited to the respiratory tract in the 3R4F group, accompanied by increased absolute and relative (to the body and to brain weight) lung weights. The 3R4F group displayed increased incidence and/or severity of metaplasia, hyperplasia, inflammation and/or histiocytic infiltrates at different sites in the respiratory tract compared to the Sham Control or any of the e-vapor groups. The location and prevalence of microscopic changes observed in the 3R4F group were similar to the reported findings from rodent smoke inhalation exposures (Fujimoto et al., Citation2015; Phillips et al., Citation2015; Tsuji et al., Citation2015). In e-vapor groups, there were a few minimal changes including squamous metaplasia of the larynx (all e-vapor groups) and squamous metaplasia of the respiratory epithelium of the nose and histiocytic infiltrates in the lung (Test-2 group). Squamous metaplasia of the larynx was reported in rats exposed to PG, a key component of the Carrier formulation, and epithelial changes to the nose (hyperplasia but not metaplasia) were also observed in rats exposed to e-vapor aerosols (Werley et al., Citation2011, Citation2016). However, the overall microscopic differences between any of the e-vapor groups and the Sham Control were minimal, with the incidence and severity similar to the background levels typically observed in rodent nose-only inhalation studies. The differences between the Test-1 and Test-2 groups were subtle and considered insignificant following 3 weeks of exposure. We point out, however, that the results from this study are not automatically applicable to other marketed e-vapor products (including different types/levels of flavors as well as aerosol-generation mechanisms), and that longer-term inhalation exposures are warranted to confirm if the slight changes observed in the e-vapor groups are early adaptive responses or progress to adverse changes.
To our knowledge, this is the first study where mice were exposed via nose-only inhalation to e-vapor aerosols and systems toxicity (omics) analysis was incorporated, in addition to standard toxicity endpoints and exposure characterization. Using transcriptomics, we quantitatively assessed the early perturbation of relevant biological pathways in the lung related to: (1) cell fate, (2) cell proliferation, (3) cell stress, (4) inflammation and (5) tissue repair. As with the standard endpoints discussed above, the most significant and consistent changes were observed in the 3R4F group. In a previous study exposing ApoE mice (C57BL/6 background) to 3R4F cigarette smoke for up to 8 months, network analysis from lung tissue showed the same biological processes; for example, inflammatory and cell stress processes were increased with time and contributed to the BIF score (Phillips et al., Citation2016), which is overall in line with this short-term study. In contrast, the e-vapor groups showed minimal changes that were associated with acute inhalation exposure of aerosols, i.e. cellular stress and cellular proliferation (). A 90-day inhalation study in which rats were nose-only exposed to nebulized PG/VG mixtures, with and without nicotine, also resulted in a very limited number of gene changes upon exposure (Phillips et al., Citation2017).
In conclusion, following 3 weeks of exposure, cigarette smoke-induced biological responses in the respiratory tract that are associated with smoking-related adverse effects, while e-vapor exposure at higher aerosol mass showed substantially reduced physiological, molecular and microscopic changes.
Supplemental Material
Download Zip (2.6 MB)Acknowledgements
The authors would like to acknowledge the following individuals for contributing their technical expertise: At Battelle, Kristin Patton for histopathologic evaluation and Deidre Daria for BAL cytology analysis. At PMI, Karine Baumer and Dariusz Peric for RNA extraction and quality control analysis, and Remi Dulize and David Bornard for microarray processing; Thomas Schneider for PRM analysis, Catherine Nury and Sophie Dijon for iTRAQ® analysis, and Celine Merg and Maica Corciulo for MAP analysis.
Disclosure statement
The testing facility was Battelle (West Jefferson, OH). This work involved e-vapor products (MarkTen® manufactured by Nu-Mark, a subsidiary of Altria). All authors are employees of Altria Client Services LLC, PMI R&D or Battelle.
Additional information
Funding
Related Research Data
References
- Ackermann M, Strimmer K. (2009). A general modular framework for gene set enrichment analysis. BMC Bioinformatics 10:47.
- Benjamini Y, Hochberg Y. (1995). Controlling the false discovery rate: a practical and powerful approach to multiple testing. J R Stat Soc Series B Stat Methodol 57:289–300.
- Bradford MM. (1976). A rapid and sensitive method for the quantitation of microgram quantities of protein utilizing the principle of protein-dye binding. Anal Biochem 72:248–54.
- Cervellati F, Muresan XM, Sticozzi C, et al. (2014). Comparative effects between electronic and cigarette smoke in human keratinocytes and epithelial lung cells. Toxicol in Vitro 28:999–1005.
- Cheng T. (2014). Chemical evaluation of electronic cigarettes. Tob Control 23 Suppl 2:ii11–7.
- [CORESTA] Cooperation Centre for Scientific Research Relative to Tobacco. (2015). CORESTA recommended method N° 81, routine analytical machine for e-cigarette aerosol generation and collection – definitions and standard conditions; [accessed 2018 July 4]. Available from: https://www.coresta.org/sites/default/files/technical_documents/main/CRM_81.pdf.
- Crotty Alexander LE, Drummond CA, Hepokoski M, et al. (2018). Chronic inhalation of e-cigarette vapor containing nicotine disrupts airway barrier function and induces systemic inflammation and multiorgan fibrosis in mice. Am J Physiol Integr Comp Physiol 314:R834–47.
- [FDA] Food and Drug Administration. (2016). Draft guidance for industry: premarket tobacco product applications for electronic nicotine delivery systems; [accessed 2018 July 4]. Available from: https://www.fda.gov/downloads/tobaccoproducts/labeling/rulesregulationsguidance/ucm499352.pdf.
- Flora JW, Wilkinson CT, Wilkinson JW, et al. (2017). Method for the determination of carbonyl compounds in e-cigarette aerosols. J Chromatogr Sci 55:142–8.
- Fujimoto H, Tsuji H, Okubo C, et al. (2015). Biological responses in rats exposed to mainstream smoke from a heated cigarette compared to a conventional reference cigarette. Inhal Toxicol 27:224–36.
- Gautier L, Cope L, Bolstad BM, et al. (2004). affy--analysis of Affymetrix GeneChip data at the probe level. Bioinformatics 20:307–315. Available from: https://www.ncbi.nlm.nih.gov/pubmed/14960456
- Glynos C, Bibli SI, Katsaounou P, et al. (2018). Comparison of the effects of e-cigarette vapor with cigarette smoke on lung function and inflammation in mice. Am J Physiol Lung Cell Mol Physiol 315:L662–72.
- Goniewicz ML, Knysak J, Gawron M, et al. (2014). Levels of selected carcinogens and toxicants in vapour from electronic cigarettes. Tob Control 23:133–9.
- Haussmann HJ, Fariss MW. (2016). Comprehensive review of epidemiological and animal studies on the potential carcinogenic effects of nicotine per se. Crit Rev Toxicol 46:701–34.
- Herbrich SM, Cole RN, West KP, Jr, et al. (2013). Statistical inference from multiple iTRAQ experiments without using common reference standards. J Proteome Res 12:594–604.
- Hoeng J, Talikka M, Martin F, et al. (2014). Case study: the role of mechanistic network models in systems toxicology. Drug Discov Today 19:183–92.
- Huber W, Von Heydebreck A, Sültmann H, et al. (2002). Variance stabilization applied to microarray data calibration and to the quantification of differential expression. Bioinformatics 18:S96–S104.
- Hultin-Rosenberg L, Forshed J, Branca RM, et al. (2013). Defining, comparing, and improving iTRAQ quantification in mass spectrometry proteomics data. Mol Cell Proteomics 12:2021–31.
- Kanehisa M, Furumichi M, Tanabe M, et al. (2017). KEGG: new perspectives on genomes, pathways, diseases and drugs. Nucleic Acids Res 45:D353–61.
- Martin F, Sewer A, Talikka M, et al. (2014). Quantification of biological network perturbations for mechanistic insight and diagnostics using two-layer causal models. BMC Bioinformatics 15:238.
- McCall MN, Bolstad BM, Irizarry RA. (2010). Frozen robust multiarray analysis (fRMA). Biostatistics 11:242–53.
- McRobbie H, Phillips A, Goniewicz ML, et al. (2015). Effects of switching to electronic cigarettes with and without concurrent smoking on exposure to nicotine, carbon monoxide, and acrolein. Cancer Prev Res (Phila) 8:873–8.
- Ménache MG, Miller FJ, Raabe OB. (1995). Particle inhalability curves for humans and small laboratory animals. Ann Occup Hyg 39:317–28.
- Misra M, Leverette RD, Cooper BT, et al. (2014). Comparative in vitro toxicity profile of electronic and tobacco cigarettes, smokeless tobacco and nicotine replacement therapy products: e-liquids, extracts and collected aerosols. Int J Environ Res Public Health 11:11325–47.
- [NAS] National Academies of Sciences, Engineering, and Medicine. (2018). Committee on the review of the health effects of electronic nicotine delivery systems. Public health consequences of e-cigarettes. Washington (DC): The National Academies Press.
- [NRC] National Research Council. (2011). Guide for the care and use of laboratory animals. 8th ed. Washington, DC: The National Academies Press.
- Nutt DJ, Phillips LD, Balfour D, et al. (2014). Estimating the harms of nicotine-containing products using the MCDA approach. Eur Addict Res 20:218–25.
- Obot CJ, Lee K, Fuciarelli AF, et al. (2004). Characterization of mainstream cigarette smoke (MS)-induced biomarker responses in ICR and C57Bl/6 mice. Inhal Toxicol 16:701–19.
- Ogunwale MA, Li M, Ramakrishnam Raju MV, et al. (2017). Aldehyde detection in electronic cigarette aerosols. ACS Omega 2:1207–14.
- [OECD] Organisation for economic co-operation and development. (2009). Guidance document on acute inhalation toxicity testing, No. 39; [accessed 2018 Sept 16]. Available from: https://ntp.niehs.nih.gov/iccvam/suppdocs/feddocs/oecd/oecd-gd39.pdf.
- Phillips B, Titz B, Kogel U, et al. (2017). Toxicity of the main electronic cigarette components, propylene glycol, glycerin, and nicotine, in Sprague-Dawley rats in a 90-day OECD inhalation study complemented by molecular endpoints. Food Chem Toxicol 109:315–32.
- Phillips B, Veljkovic E, Boué S, et al. (2016). An 8-month systems toxicology inhalation/cessation study in Apoe-/- mice to investigate cardiovascular and respiatory exposure effects of a candidate modified risk tobacco product, THS 2.2, compared with conventional cigarettes. Toxicol Sci 149:411–32.
- Phillips B, Veljkovic E, Peck MJ, et al. (2015). A 7-month cigarette smoke inhalation study in C57BL/6 mice demonstrates reduced lung inflammation and emphysema following smoking cessation or aerosol exposure from a prototypic modified risk tobacco product. Food Chem Toxicol 80:328–45.
- Raabe OG, Al-Bayati MA, Teague SV, Rasolt A. (1988). Regional deposition of inhaled monodisperse coarse and fine aerosol particles in small laboratory animals. Ann Occup Hyg 31:53–63.
- [RCP UK] Royal College of Physicians. (2016). Nicotine without smoke: tobacco harm reduction; [accessed 2018 July 4]. Available from: https://www.rcplondon.ac.uk/projects/outputs/nicotine-without-smoke-tobacco-harm-reduction-0.
- Smyth GK. (2004). Linear models and empirical bayes methods for assessing differential expression in microarray experiments. Stat Appl Genet Mol Biol 3:Article3.
- St Helen G, Havel C, Dempsey DA, et al. (2016). Nicotine delivery, retention and pharmacokinetics from various electronic cigarettes. Addiction 111:535–44.
- Talikka M, Boue S, Schlage WK. (2015). Causal biological network database: a comprehensive platform of causal biological network models focused on the pulmonary and vascular systems. In: Hoeng J, Peitsch MC, editors. Computational systems toxicology. New York, NY: Humana Press. p. 65–93.
- Taylor M, Carr T, Oke O, et al. (2016). E-cigarette aerosols induce lower oxidative stress in vitro when compared to tobacco smoke. Toxicol Mech Methods 26:465–76.
- Thomson TM, Sewer A, Martin F, et al. (2013). Quantitative assessment of biological impact using transcriptomic data and mechanistic network models. Toxicol Appl Pharmacol 272:863–78.
- Tsuji H, Fujimoto H, Lee KM, et al. (2015). Characterization of biochemical, functional and structural changes in mice respiratory organs chronically exposed to cigarette smoke. Inhal Toxicol 27:342–53.
- Tsuji H, Fujimoto H, Matsuura D, et al. (2011). Comparison of mouse strains and exposure conditions in acute cigarette smoke inhalation studies. Inhal Toxicol 23:602–15.
- U.S. Department of Health and Human Services (US DHHS) (2014). The Health Consequences of Smoking—50 Years of Progress. A Report of the Surgeon General. Available from https://www.surgeongeneral.gov/library/reports/50-years-of-progress/exec-summary.pdf.
- Vansickel AR, Edmiston JS, Liang Q, et al. (2018). Characterization of puff topography of a prototype electronic cigarette in adult exclusive cigarette smokers and adult exclusive electronic cigarette users. Regul Toxicol Pharmacol 98:250–6.
- Wagner KA, Flora JW, Melvin MS, et al. (2018). An evaluation of electronic cigarette formulations and aerosols for harmful and potentially harmful constituents (HPHCs) typically derived from combustion. Regul Toxicol Pharmacol 95:153–60.
- Werley MS, Kirkpatrick DJ, Oldham MJ, et al. (2016). Toxicological assessment of a prototype e-cigaret cartridge and three flavor formulations: a 90-day inhalation study in rats. Inhal Toxicol 28:22–38.
- Werley MS, McDonald P, Lilly P, et al. (2011). Non-clinical safety and pharmacokinetic evaluations of propylene glycol aerosol in Sprague-Dawley rats and Beagle dogs. Toxicology 287:76–90.