
Abstract
Objective: There is substantial evidence that exposure to airborne particulate matter (PM) from road traffic is associated with adverse health outcomes. Although it is often assumed to be caused by vehicle exhaust emissions such as soot, other components may also contribute to detrimental effects. The toxicity of fine PM (PM2.5; <2.5 µm mass median aerodynamic diameter) released from brake pads was compared to PM from other sources.
Materials and methods: PM2.5 of different types of brake pads (low-metallic, semi-metallic, NAO and ECE-NAO hybrid), tires and road pavement, poultry as well as the combustion of diesel fuel and wood (modern and old-fashioned stove technologies) were collected as suspensions in water. These were subsequently aerosolized for inhalation exposures. Female BALB/cOlaHsd mice were exposed for 1.5, 3, or 6 hours by nose-only inhalation up to 9 mg/m3.
Results: Neither cytotoxicity nor oxidative stress was observed after exposure to any of the re-aerosolized PM2.5 samples. Though, at similar PM mass concentrations the potency to induce inflammatory responses was strongly dependent on the emission source. Exposure to most examined PM2.5 sources provoked inflammation including those derived from the poultry farm, wear emissions of the NAO and ECE-NAO hybrid brake pads as well as diesel and wood combustion, as indicated by neutrophil chemoattractant, KC and MIP-2 and lung neutrophil influx.
Discussion and conclusions: Our study revealed considerable variability in the toxic potency of brake wear particles. Understanding of sources that are most harmful to health can provide valuable information for risk management strategies and could help decision-makers to develop more targeted air pollution regulation.
Introduction
Since air pollution, and in particular road traffic emission, is associated to adverse health effects; many efforts have been taken to diminish these emissions. This has resulted in a considerable reduction of vehicle exhaust emissions in Europe in the last 20–40 years (EEA Citation2016). However, particulate matter (PM) from road traffic is not only derived from combustion engines, it also consists of wear emission from the road, tires, and brakes (Denier van der Gon et al. Citation2013; Amato et al. Citation2014). Moreover, the contribution of engine exhaust and non-exhaust to PM10 traffic-related emissions is approximately similar (Grigoratos and Martini Citation2015). Reduction in exhaust emissions will continue, for example, due to the conversion to electrification of road traffic, and thereby the relative contribution of non-exhaust emissions will become more dominant (HEI Citation2010). Therefore and as non-exhaust is not controlled, these wear emissions are becoming a significant source (Wahid Citation2018).
Correlations between PM composition and health effects suggest that non-exhaust emissions are of importance (Tsai et al. Citation2015) and opens opportunities for abatement strategies that includes reduction in health impact. Especially in urban cities, hazardous brake wear particles are released into the environment during rush hours (Wahid Citation2018). The importance of brake wear particles in relation to adverse health effects was supported by studies showing that copper, a major component of brake pads, was associated with markers of toxicity and adverse health effects (Gerlofs-Nijland et al. Citation2007; Riediker Citation2007). Later, copper free pads have been developed because of the increasing role of wear emissions in the overall PM toxicity (Aranganathan and Bijwe Citation2016; Shirmohammadi et al. Citation2016). A role for brake wear particles in toxicity is not only suggested based on its composition but also shown directly in vitro (Straffelini et al. Citation2015). Gasser et al. (Citation2009) measured the biological responses of directly emitted brake wear particles generated during various braking behaviors (e.g. deceleration or full stop) on human lung epithelial cells. The authors reported a correlation between various components (iron, copper, and manganese) and markers for inflammation at sub-lethal concentrations and differences in oxidative stress based on the composition. Recent research on brake wear debris showed that brake wear particles could contain components with toxic and mutagenic properties (Kazimirova et al. Citation2016; Malachova et al. Citation2016). However, comprehensive studies examining the direct link to brake wear particles and adverse health effects are still scarce.
Besides traffic emissions including non-exhaust, other PM sources of emissions, such as wood combustion or farming activities, influence the composition and consequently the toxicity of the PM mixture. From a health perspective, it would be relevant to focus on the most harmful PM emissions. Most toxicity studies have been focused only on exposure to single components or single sources of emissions and far less attention have been paid to the relative contribution to health effects of a range of sources of emissions (Adams et al. Citation2015). Notably, the majority of the components and sources examined in these kinds of studies are associated to health effects of some kind. The comparison is hampered by individual assessment of the toxicity of specific components or sources; however, still no priorities on most hazardous PM component or source can be set (Stanek et al. Citation2011; Cassee et al. Citation2013). The lack of relative hazard comparison of different sources complicates the decision for policy makers as to which source is most important to regulate from a health point of view.
Plummer et al. (Citation2015) described the first source-oriented toxicity study of ambient PM and concluded that different PM emission sources and combinations thereof reveal different toxicity. As air quality limits are based only on PM mass, differences in toxicity of the air pollution mixture are not considered with the exception of PM size. Reducing PM emissions of specific hazardous sources might be the best abatement policy to improve public health and which sources to focus on needs to be supported by relative toxicity studies. Therefore and since not much is known about the relative toxicity of non-exhaust emissions, we examined the toxic potency of PM from several brake pad types in relation to other PM emission sources in parallel in a mice inhalation study. We expect that the toxic potency will vary at similar PM mass concentrations based upon the contribution of various sources of emissions. Next, ranking the source-specific PM according to their hazard might provide support for targeted abatement strategies or control measures.
Materials and methods
PM sampling
Fine PM (Dp < 2.5 µm mass median aerodynamic diameter; PM2.5) from different sources () was collected using the versatile ambient concentration enrichment system (VACES) using 2.5 µm cut-point pre-impactors at a flow rate of 110 L min–1 to remove larger-sized particles as previously described (Steenhof et al. Citation2011). PM containing 2–3 µm droplets were collected in a Biosampler (SKC, Eighty Four, PA) resulting in PM2.5 suspensions. The VACES and the BioSampler were cleaned prior to use with pure methanol and PM2.5 suspensions were stored at −20 °C until further processing.
Table 1. Sources used to collect PM2.5 and PM2.5 suspension sample code.
Brake wear
Four types of brake pads were used to collect PM2.5 in an experimental setting under realistic simulated driving conditions at the Technical University of Ilmenau (Ilmenau, Germany). Each sampling run was a sequence of different automated and controlled cycles: city, freeway, and provincial road. Each cycle has a sequence of braking actions from different running speeds (sometimes to complete stop, sometimes to a lower speed), at different temperatures (level to start the next brake moment) and with a different force (Sachse et al. Citation2014). The testing of brakes is performed inside a large air-conditioned test-cabin with inside a sealed metal box where a wheel/brake assembly is rotating freely (no tire wear particles) during brake actions. PM sampling was performed directly from the outlet of the sealed metal box. The normal supply of clean air to the sealed metal box was reduced to avoid particle losses during collection. This resulted in a prolonged brake cycle-time since it took longer to cool down the brakes. PM2.5 suspensions were obtained from four types of brake pads: (1) ECE low-metallic pads containing copper (brake wear 1 or BW-1); (2) semi-metallic pads without copper (brake wear 2 or BW-2); (3) non-asbestos organic (NAO) brake pads (brake wear 3 or BW-3); (4) ECE-NAO hybrid brake pads (brake wear 4 or BW-4).
Tire/road wear
Tire/road wear PM2.5 was sampled in an experimental setting using studded winter tires (Nokian Hakkapeliitta 4) on an asphalt concrete pavement of the type stone mastic asphalt with quartzite aggregates at the VTI road simulator facility (VTI, Swedish National Road and Transport Research Institute, Linköping, Sweden) (Gustafsson et al. Citation2008). The pavement is a very wear resistant, type common in Nordic countries where studded tires are used. The road simulator consists of four wheels that run along a circular track with a diameter of 5.3 m. A separate motor drove each wheel at a speed of 70 km/h. An ex-centric movement of the vertical axis is used to slowly side shift the tires over the full width of the track. During operation of the simulator, the facility was closed with no air ventilation.
Wood smoke
PM2.5 samples were collected from wood combustion under efficient/efficient combustion conditions using a modern stove (type Fuga eL compliant with the German BimschV. 2. Stufe standard) and an old-fashioned stove (type cast-iron, compliance with standards not tested). Efficient combustion implies full yellow flame and no visible smoke. Both stoves were fueled with dried beech wood containing maximal 15% rest moist. PM2.5 sampling was performed from the exhaust pipe of the stove to eliminate the contribution of other sources and diluted with filtered air and sampling started immediately after ignition.
Diesel engine exhaust
Diesel engine exhaust PM2.5 was collected from a stationary heavy-duty engine placed on a test bench (Euro III compliant combustion settings) fueled with commercial available diesel (EN590) and running under typical highway conditions at the Eindhoven University of Technology (Eindhoven, Netherlands; see Reijnders et al. Citation2016). A fraction of the exhaust was mixed with filtered air to achieve concentration and temperatures that can effectively be used in the VACES-BioSampler system.
Poultry farm
PM2.5 was collected at a Dutch poultry farm housing about 70 000 chickens in a single barn. The inlet of the VACES was placed close to the ventilation system that extracts air from the animal housing.
PM2.5 sample preparation, elemental, and endotoxin measurement
Since the concentration of the PM2.5 samples that were collected from the exhaust of a diesel engine and both wood stoves were not sufficiently high for aerosol preparation those PM2.5 samples were lyophilized to remove excess water (freeze dryer Christ Alpha 1, Osterode am Harz, Germany) until a final concentration of 1 mg/ml. PM2.5 samples of the other sources were diluted with ultrapure water to approximately 1 mg/ml. Elemental analyses of the collected PM2.5 suspensions of BW-1 and BW-2 were performed at the National Oceanography Centre of the University of Southampton (Loxham et al. Citation2013). The kinetic chromogene limulus amebocyte lysate assay was used for the detection and quantification of bacterial endotoxins according to the European Pharmacopee, paragraph 2.6.14 method D.
Animals
Female BALB/cOlaHsd mice were obtained in four series of 60 mice each (Harlan, Horst, Netherlands). Upon arrival, the animals were weighed, randomly allocated and housed in Macrolon IV type cages. The experiments started after an acclimatization period of at least seven days. During the acclimatization period, the animals were trained in the nose only tubes for three days in a row, during one hour per day. Each dose group consisted of 4–5 mice. Animals were exposed at an age of 9–10 weeks. Food and tap water were provided ad libitum, except during the exposure. The animal experiments were conducted according to all applicable provisions of the Dutch national law: Experiments on Animals Act from 1997 and approved by an Animal Experimentation Ethical Committee. The experiments were conducted at the National Institute for Public Health and the Environment in Bilthoven, Netherlands under permit number 201400193.
Exposure protocol
Aerosols of each PM2.5 sample () were generated from a stock concentration of 1 mg/ml using a spray nozzle. The aerosols were diluted with pressurized air, heated and dried using a silica gel diffusion drier (model 3061, TSI Inc., St. Paul, MN) to achieve the target concentration of 9 mg/m3. A total air volume of 5 L/min was used to expose the animals in a nose-only unit and an additional 1.2 L/min to characterize the test atmospheres. The following exposure metrics were included: PM concentration (TEOM model 1400A, Rupprecht & Patashnick, Albany, NY), particle counts (condensation particle counter CPC 3022A, TSI Inc., St. Paul, MN), particle concentration and particle size distribution (optical particle sizer OPS 3330, TSI Inc., St. Paul, MN), and size and number concentration and distribution (scanning mobility particle sizer SMPS 3936, TSI Inc., St. Paul, MN).
During each exposure, at least two OPS and SMPS measurements were performed. The temperature and relative humidity (Vaisala model M-170, Vantaa, Finland) of the test atmosphere were measured at one of the nose-only tube positions on the top row of the exposure cylinder. Gravimetric measurements were performed using collections on 47 mm Teflon filters (Pall, Port Washington, NY). The inaccuracy of the time weighted mass concentrations is approximately 4% (combining the inaccuracies of the flowmeter 1–2%, weighing 1–2% and filter handling). Groups of 4–5 animals were exposed for 1.5, 3, or 6 hours to either one of the source-specific re-aerosolized PM2.5 suspensions or six hours to clean (filtered) air (negative control). The internal regional dose per animal was calculated considering a minute volume of 0.0273 l/min and the estimation that 33% of the inhaled mass ends up in the pulmonary region (Jacobsen et al. Citation2009). This resulted in four individual doses: very low exposure (expo VL; 0.1 mg/kg body weight only for BW-3), low exposure (expo L; 0.3–0.4 mg/kg body weight), medium exposure (expo M; 0.6–0.8 mg/kg body weight), and high exposure (expo H; 1.2–1.6 mg/kg body weight not present for BW-3).
Necropsy
Animals were weighed before dissection (24 h post-exposure) and anesthetized (0.1 ml/25 g body weight intramuscular) with a mixture of ketamine/xylazine (3.5 ml ketamine (100 mg/ml), 3.0 ml xylazine (Rompun® 20 mg/ml) and 4.5 ml saline; Alfason, Woerden, Netherlands). Blood withdrawn by eye extraction was divided over two tubes: (1) 0.3 ml of blood in K3-EDTA tube (Minicollect, Greiner Bio 1 ml, 450474) to obtain EDTA plasma for hematology (cell counts and differentials) and (2) 0.2 ml into a sodium citrate containing tube to collect plasma (centrifuge 10 min at 2000×g and 4 °C for von Willebrand factor and fibrinogen analyses). Next, the lungs were flushed twice with fresh saline (1 ml/25 g body weight) and each flush consisted of three slow up and down movements to collect bronchoalveolar lavage fluid (BALF) and measure the retrieved volume which is used for further calculations. The right lung was split in half and immediately frozen in liquid nitrogen and stored at –80 °C until further processing.
Biological effects
Hematology
Hematology was conducted according to the instructions of the manufacturer (Advia 120 Hematology Analyzer, Siemens Health Care, Erlangen, Germany) recording the following parameters: hemoglobin, hematocrit, mean platelet volume, red blood cell count, reticulocyte count, total white blood cell count, differential white blood cell count, thrombocyte count, mean corpuscular volume, mean corpuscular hemoglobin, and mean corpuscular hemoglobin concentration. In addition, the level of vWF and fibrinogen was measured in the citrate plasma using enzyme-linked immuno sorbent assay kits from BioConnect Life Sciences (Huissen, Netherlands) according to manufacturer’s instructions.
Biochemical analysis and cell differentials
The retrieved BALF was kept on ice and centrifuged at 400×g at 4 °C for 10 min within two hours after it was obtained. The pellet was re-suspended in saline for analysis of the total cell number and cell differentials. The cell free supernatant was collected to assess cell damage (cytotoxicity), oxidative stress and the induction of pro-inflammatory cytokines. Cytospins were prepared from the re-suspended pellets and stained using the May Grunwald and Giemsa method. These preparations were evaluated microscopically and at least 400 cells were counted on each slide and split into polymorph nuclear neutrophils (PMNs), macrophages, and lymphocytes. BALF supernatant was used to assess cytotoxicity by measurement of the total protein content and the release of lactate dehydrogenase (LDH) by Beckman Coulter auto-analyzer Synchron LX20 (Beckman Coulter, Inc., Indianapolis, IN). In addition, the induction of the pro-inflammatory cytokines IL-1β, IL-6, IL-12(p40), IL-12(p70), G-CSF, KC, MCP-1, TNF-α, IL-18, and MIP-2 was measured in the BALF supernatant by the Bio-PLex Pro Mouse Cytokine Group-I 8-plex and Group-II 2-plex assays according to manufacturer’s instructions (Bio-Rad Laboratories, Inc., Berkeley, CA). The induction of oxidative stress was determined by measuring the amount of total glutathione (GSH). Briefly, to remove BALF proteins the supernatant was mixed 1:1 with 10% meta phosphoric acid and centrifuged at 5000×g at 4 °C for 10 min. Next, total GSH was measured in the supernatant using an adjusted Cayman method on a Beckmann Coulter Analyzer Synchron DxC800 (Beckman Coulter, Inc., Indianapolis, IN).
Statistical analysis
Biological effect parameters with unequal variance between groups were log-transformed before performing one-way analysis of variance. The Bonferroni test was used to assess differences among dose for the separate PM sources using SPSS (version 22, SPSS Inc., Chicago, IL). The values are expressed as mean ± standard deviation and p values less than 0.05 were regarded as statistically significant. Parameters that did not have equal variance after log-transformation were transformed using a ranking function in Excel. After ranking, a t-test was performed. Existence of outliers was checked using a modified Thompson tau method.
Dose (mass)–response relationships were assessed for BALF and blood parameters and analyzed using the benchmark dose (BMD) software PROAST (version 50.7, www.rivm.nl/proast). The internal regional dose was used for BMD calculations. Data of the endpoints BALF or blood cells, cytokines, fibrinogen, and vWF were analyzed to determine differences in the dose–response between source-specific PM. Differences in dose–response are defined as differences in the following parameters (1) background, (2) potency, and only in case of continuous data (3) variance. A dose–response model from the exponential model family was automatically selected according to the likelihood ratio test and fitted to the data (Slob Citation2002). Simultaneously, it was tested whether the use of a source-specific PM dependent value for the different parameters resulted in a significantly better fit compared to the situation of the parameters being equal in all tested source-specific PM samples (total of 10 PM sources). A benchmark response (BMR) was defined by choosing a predetermined change in response compared to background for a certain endpoint. The BMR was based on a known physiologically relevant response and expert judgment. A 10% change in response was chosen for white blood cells, blood neutrophils, blood lymphocytes, fibrinogen, and vWF and for the remainder of the continuous endpoints a 20% change has been set. The counts of lung neutrophils and lymphocytes were analyzed as clustered quantal data as only a limited number of cells were counted (Gosens et al. Citation2016). No defaults are available for this type of response; therefore, the BMR was set to a 20% extra fraction based on expert judgment. Here, the definition of extra fraction is equivalent to the definition of extra risk, i.e. the additional fraction (f(BMD) – f(0)) of cells of a particular type is divided by the background fraction (1 – f(0)). Thereafter, the lower and upper 95% confidence limits (one sided, BMDL and BMDU, respectively) of the associated BMDs were derived from the fitted models.
Results
PM2.5 composition
The element spectrum, weight and atomic percentages, as measured by energy dispersive spectroscopy (K-lines) of the metals from the four different brake pads that were used to PM2.5 collection are given in Supplementary file 1. The low- and semi-metallic pads (Brake-pad-1 and -2) consist of around 50 wt.% iron (Fe), while the NAO (Brake-pad-3) or ECE-NAO hybrid (Brake-pad-4) pads contained much less Fe, respectively, 16 wt.% and 25 wt.%. In addition, the NAO and ECE-NAO hybrid pads contained relatively high copper (Cu) around 13–19 wt.%, while the low-metallic pads with copper (Brake-pad-1) contained only ±3 wt.% copper and copper was not detected in the semi-metallic pads (Brake-pad-2). Both Brake-pad-3 and Brake-pad-4 have minor wt.% of potassium (K), titanium (Ti), zirconium (Zr), and barium (Ba), while these elements are not present in Brake-pad-1 and Brake-pad-2. Elemental analyses of collected PM2.5 suspensions of the low- and semi-metallic brake pads (respectively BW-1 and BW-2) revealed that Fe is a substantial element of those pads (77–85 wt.%) and confirmed the copper content (BW-1: 4 wt.% Cu and BW-2: 0.2 wt.% Cu). Collected PM2.5 suspensions of neither NAO and ECE-NAO hybrid pads nor any of the other sources were examined for elemental content. The endotoxin content was measured in PM2.5 suspensions of all sources. The PM2.5 poultry farm sample contained 8290 IU/ml, whereas all other PM2.5 samples had endotoxin levels that varied between 0.13 and <5.0 IU/ml.
Exposure characterization
For most PM sources, the exposure concentration was in the range of the target concentration (9 mg/m3) with the exception of the re-aerosolized PM2.5 sample BW-3 (). The highest particle numbers were seen for exposure to PM2.5 aerosol of brake pad 3 (BW-3), whereas the lowest number of particles was shown with exposure to re-aerosolized PM2.5 of wood combustion using the modern stove and tire/road wear particles (). We calculated that the lowest internal pulmonary dose was ∼0.4 mg/kg based on 1.5 h exposure duration. This will be equivalent of an adult being exposed to a concentration of 300 µg/m3 PM for 2 h or 25 µg/m3 per day. Size distributions based on particle number counts were very similar for all PM types, with BW-3 particles showing the smallest and diesel engine exhaust particles the largest size distribution based on SMPS data (; Supplementary file 2).
Table 2. Exposure metrics: mass, size and number concentrations.
Pulmonary effect
No cytotoxicity or oxidative stress was observed after exposure to re-aerosolized PM2.5, irrespective the origin of the source and the dose (Supplementary file 3). The potency to induce inflammatory responses was different for the various PM2.5 aerosols as shown by the PMN influx and the induction of pro- and anti-inflammatory markers in the lungs (; Supplementary file 3). Numbers of lymphocytes, LDH and GSH levels in BALF were not affected by any of the exposures.
Figure 1. Inflammatory parameters in bronchoalveolar lavage fluid 24 h post-exposure to re-aerosolized PM2.5 of different sources at very low (VL) (only for brake wear 3 PM), low (L), medium (M) or high dose (H) (not present for brake wear 3 PM) compared to controls. Data are expressed as mean ± SD (n = 4–5 per group).
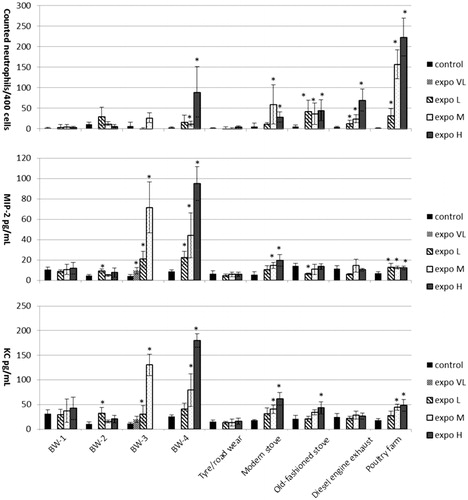
An influx of neutrophils was mainly observed after exposure to the highest dose of re-aerosolized BW-4 PM2.5, the three combustion sources (wood combustion both modern and old-fashioned stove and diesel combustion) and re-aerosolized PM2.5 of the poultry farm. Exposure to some of the PM2.5 aerosols resulted in a dose–response (PM2.5 of the poultry farm as well as diesel combustion), while PM2.5 emitted by an old-fashioned stove already showed a maximum response at the lowest dose. The PMN influx was in alignment with elevated pro-inflammatory markers (MIP-2 and KC; , Supplementary file 3) for most PM2.5 aerosols. Increased levels of the anti-inflammatory marker IL-12p40 was only observed for PM2.5 of the poultry farm (Supplementary file 3). Neither total cell numbers nor other cell types, LDH or GSH present in BALF (Supplementary file 3) nor other analyzed pro- and anti-inflammatory markers measured, were affected by the various PM2.5 aerosol exposures (data not shown).
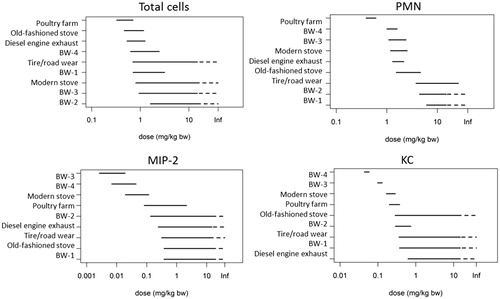
The toxic potency of each re-aerosolized PM2.5 sample was determined for those pulmonary effect markers for which a clear dose–response relationship was observed (Supplementary file 4). The potency based on pulmonary inflammation as assessed by the influx of PMN in BALF was determined based on BMD analyses (). PM from tire/road wear and BW-1 and BW-2 appear to be less potent compared to PM from an old-fashioned stove, diesel combustion, modern stove, and BW-3 and BW-4, which in turn are less potent compared to PM2.5 of the poultry farm. With the exception of the poultry farm, no distinction between potency can be made within these groups because their BMD confidence intervals substantially overlap. This order is supported by increased PMN chemoattractants (MIP-2 and KC) at lower BMD although the potency order is slightly different with BW-3 and BW-4 PM being the most potent ones followed by PM from the modern woodstove and poultry farm (). In addition, the anti-inflammatory marker IL-12p40 was only increased at low dose of PM collected at the poultry farm and no ranking of the other PM aerosols could be made (data not shown).
Figure 2. Ranking of PM dose range (BMDL and BMDU) for inflammatory responses in the lung resulting in 20% extra fraction (PMN) or 20% change in response (total cells, MIP-2, KC) compared to controls. Dashed line BMDU infinitive; a dose–response is present, however, at the current doses the in- or decrease in dose–response is too small (<BMR) to derive a BMDU.
Systemic circulation markers of effect
In particular, exposure to re-aerosolized PM2.5 emitted by ECE-NAO hybrid brake pads (BW-4) and the poultry farm resulted in reduced blood cells compared to clean air exposure (Supplementary file 5). Moreover, exposure to PM2.5 of BW-4 resulted in significantly increased fibrinogen levels, while reduced blood fibrinogen concentrations were observed after exposure to PM2.5 of the poultry farm.
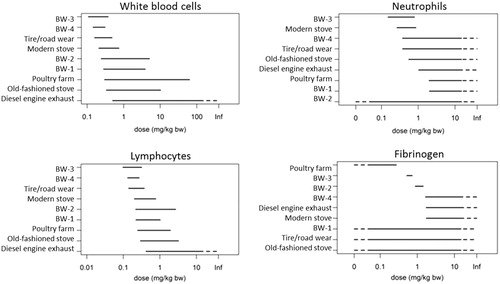
Differences in potency to affect fibrinogen were seen in relation to exposure to re-aerosolized PM2.5 of BW-2, BW-3 and poultry farm of which exposure to the latter PM2.5 aerosol revealed the highest toxic potency (). Re-aerosolized PM2.5 from BW-4, diesel combustion and modern stove showed a lower potency. No dose–response relationship can be deducted for fibrinogen for BW-1, tire/road wear and old-fashioned stove and therefore no reliable BMD can be determined (). Overlapping 90% confidence interval for the BMDs of re-aerosolized PM2.5 suggests that the toxic potency cannot be distinguished. However, it is notable that most brake wear PM2.5 aerosols, and especially those of BW-3 and BW-4, were in the top range ranking the PM sources by their relative toxicity.
Figure 3. Ranking of PM dose range (BMDL and BMDU) for hematological parameters lung resulting in 10% change in response compared to controls. Dashed line BMDL to zero, the maximum response is already reached at the first dose, i.e. the BMDL lies somewhere between minus infinitive (i.e. zero) and the first dose. Dashed line BMDU infinitive, a dose–response is present, however, at the current doses the in- or decrease in dose–response is too small (<BMR) to derive a BMDU. Dashed line BMD confidence interval ranging from zero to infinitive; data were too scattered to enable dose response analysis.
Discussion
In this study, we examined the toxic potential of brake wear PM2.5 in comparison to PM from other sources of emission in mice by inhalation exposure. PM from various source of emission varied in their toxic potency based on for example pulmonary inflammation. It can be concluded from the benchmark data that PM2.5 collected at the poultry farm is the most potent PM2.5 sample with respect to induction of pulmonary inflammation. Considering wear emissions, the consolidated BMD findings suggest that re-aerosolized PM2.5 of the examined NAO and ECE-NAO hybrid brake pads (respectively BW-3 and BW-4) possess a higher toxic potential compared to the studied low- and semi-metallic pads (respectively BW-1 and BW-2) or to tire/road wear particles. This is mainly based on inflammation in the lung, as the toxic potential of PM2.5 aerosols could not be demonstrated in the analysis of for example biomarkers for toxicity in blood. A very recent study in which the investigators have used an in vitro model to test the toxic potency of similar brake wear particles confirms our findings, i.e. PM with relative low metal content is the least potent in inducing adverse biological effects (Barosova et al. Citation2018).
It is suggested that PM composition and characteristics are involved in source-specific risk (Cassee et al. Citation2013). In addition, for short-term exposures metals might be of most importance for health effects (Rohr and Wyzga Citation2012). The differences in inflammatory potential observed in our study for the collected PM2.5 of metallic- or NAO-based brake pads, can be explained by the elemental composition of the brake pads used to collect PM2.5 samples. Elemental analysis of the brake pads that were used to collect PM2.5 samples revealed that based on the copper, iron, potassium, titanium, zirconium, and barium content the brake pads could be divided into two groups with quite similar structure; the low- and semi-metallic pads (group 1 with respectively PM2.5 suspensions BW-1 and BW-2) and the NAO and ECE-NAO hybrid pads (group 2 with respectively PM2.5 suspensions BW-3 and BW-4).The copper content of the NAO and ECE-NAO hybrid pads is 4–6 times higher when compared with the low-metallic copper containing pads. Higher copper levels could therefore potentially explain the differences in toxic potency of the four types of brake pads examined. However, copper is not the only elemental brake wear component to induce acute inflammatory responses. Also Fe, nickel (Ni), vanadium (V), and zinc (Zn) have been identified as other transition metals contributing to the toxicity of PM sources (Gray et al. Citation2015). In the present study, toxicological differences among the two brake wear groups could not be explained by the iron content of the brake pads in both groups. Yet, Cu or other components like titanium (Ti) or barium (Ba) that are more abundant in the NAO-based brake pads might be the main driver of the response observed in our study.
Apart from the fact that we identified difference on relative toxicity among brake wear, re-aerosolized PM from the NAO-based pads (BW-3 and BW-4) revealed similar potency with respect to pulmonary inflammation compared to exposure to PM of diesel and wood combustion. This confirms findings reported in the literature that suggests that biomass burning is not evidently more or less harmful then urban (mainly traffic-related) PM (WHO Citation2015). The comparable outcomes upon exposure to PM from both wood combustion conditions in our study could imply that fuel combustion efficiency is a more important factor than technology itself, i.e. modern versus old stove as has been reported by Tapanainen et al. (Citation2012). On the other hand, opposite findings suggest that PM of wood combustion using modern stove technology induced the highest pulmonary inflammatory response (Uski et al. Citation2012; Happo et al. Citation2013) and differences might be explained by the fact that in their study PM was applied by a single bolus injection into the lung instead of the more realistic inhalation of an aerosol as applied in our own study.
Exposure to similar mass concentration of PM from different sources can thus result in diverse health (severity) of effects. It is important to combine the hazard for different health endpoints and to combine this with exposure data for a given population to estimate the source-specific risk. As an example, the semi-metallic brake pads without copper are expected to result in equal or less total PM emissions compared to the low-metallic pads with copper. However, we noticed during PM collection that the emission rate of brake wear PM2.5 of copper free pads was at least three times higher in comparison to the emission rate of PM2.5 of the other three brake pad types collected. This implies that increased PM emissions will be the result with the use of semi-metallic brake pads without copper. A higher wear rate for pads without copper was also shown by Lee and Filip (Citation2013), which supports our finding. A higher emission rate could result in increased concentration and thereby increased risk for an exposed population. Copper free brake pads seem to emit more PM per volume of air, and albeit less toxic, increased exposure concentrations may result in a higher health risk compared to the conventional brake pads with copper. Exposure assessments are needed to estimate the population based health risks for non-exhaust road traffic emissions. Notably, from a toxicological point of view, our study already indicated that brake wear PM is an important source based on its toxic potency that should not be forgotten when management actions to reduce PM to improve public health are considered.
There are a few limitations that we need to mention here. Ideally, toxicity of airborne PM is assessed without sampling and treating the samples for aerosol generation as test atmosphere. However, various obvious reasons such as not having all sources of emissions available at the same laboratory settings forced us to collect PM at the source of emission prior to assess the toxicity. During PM sampling, lyophilization, generation and drying of the aerosols for the inhalation study, physicochemical changes occur including changes in size distribution of the particles or loss of (semi) volatile constituents. The original PM size distribution of the different sources was not generally measured and it could well be that these processes affect the size distribution and properties. Though, with the exception of lyophilization, which was included to increase the concentration of diesel and wood combustion PM, all samples have been treated similar. Therefore, it can be assumed that changes in PM size are comparable for all PM samples. The size distributions of the generated aerosols () show some various across the range of exposures, but the impact on the internal lung dose is considered to be negligible. We cannot fully rule out that some minor shifts in the ranking may occur if the exact deposited and retained dose was assessed. At present, we are not aware of an analyses technique to assess the deposited and retained dose in the lungs for the complex mixtures that we have used.
The low inhalation dose used in this study (expo low ∼0.4 mg/kg) is equivalent to a human being exposed to 25 µg/m3 per day, which is the EU limit value for PM2.5 24 h mean, or 2 h at 300 µg/m3 in a highly polluted city. In order to improve the ranking, it might be worthwhile to determine more accurate the dose–response at lower dose. This might even be a more relevant exposure as the overall population is exposed to relatively low PM levels.
In conclusion, marked variation in the toxic potency of brake wear particles was observed that might be linked to the chemistry of the PM with pads with low copper content or no copper being the least potent with respect to pulmonary inflammation after inhalation. This study supports the hypothesis that the hazard of PM is dependent on the composition allowing targeted measures and that brake wear particles should not be ignored in these air pollution abatement strategies.
| List of abbreviations | ||
| BALF | = | bronchoalveolar lavage fluid |
| BMD | = | benchmark dose |
| BMDL | = | lower confidence interval BMD |
| BMDU | = | upper confidence interval BMD |
| BMR | = | benchmark response value |
| BW-1 | = | brake wear particles from ECE low-metallic brake pads containing copper |
| BW-2 | = | brake wear particles from semi-metallic brake pads without copper |
| BW-3 | = | brake wear particles from NAO brake pads |
| BW-4 | = | brake wear particles from ECE-NAO hybrid brake pads |
| Expo H | = | high particle exposure 1.2-1.6 mg/kg body weight |
| Expo L | = | low particle exposure 0.3-0.4 mg/kg body weight |
| Expo M | = | medium particle exposure 0.6-0.8 mg/kg body weight |
| Expo VL | = | very low particle exposure 0.1 mg/kg body weight |
| GSD | = | geometric standard deviation |
| GSH | = | total glutathione |
| LDH | = | lactate dehydrogenase |
| NAO | = | non-asbestos organic |
| PM | = | particulate matter |
| PM2.5 | = | PM <2.5 µm mass median aerodynamic diameter |
| PMN | = | polymorph nuclear neutrophils |
| PNC | = | particle number count |
| VACES | = | Versatile Ambient Concentration Enrichment System |
| WBC | = | white blood cells |
UIHT-2018-0127-File004.pdf
Download PDF (105.6 KB)Acknowledgements
The authors acknowledge H. Strootman, J. Rigters, C. Soputan, R.F. Vlug, L.J.J. de la Fonteyne-Blankestijn, P. Beekhof, and Dr. E.H.J.M. Jansen for their valuable technical assistance. In addition, we thank Mat Loxham of the University of Southampton for the elemental analysis of two of the brake wear PM2.5 samples.
Disclosure statement
The authors report that they have no conflicts of interest. The authors alone are responsible for the content and writing of the paper. This work has been presented in part at the 19th ETH NP Conference (http://www.nanoparticles.ch/archive/2015_Gerlofs-Nijland_PR.pdf), the HORIBA CONCEPT Europe 2018, the Analytica 2018 conference, and the ISES-ISEE 2018 joint annual meeting.
Additional information
Funding
References
- Adams K, Greenbaum DS, Shaikh R, et al. 2015. Particulate matter components, sources, and health: systematic approaches to testing effects. J Air Waste Manag Assoc. 65:544–558.
- Amato F, Cassee FR, Denier Van der Gon H, et al. 2014. Urban air quality: the challenge of traffic non-exhaust emissions. J Hazard Mater. 275:31–36.
- Aranganathan N, Bijwe J. 2016. Development of copper-free eco-friendly brake-friction material using novel ingredients. Wear. 352–353:79–91.
- Barosova H, Chortarea S, Peikertova P, et al. 2018. Biological response of an in vitro human 3D lung cell model exposed to brake wear debris varies based on brake pad formulation. Arch Toxicol. 92:2339–2351.
- Cassee FR, Héroux M, Gerlofs-Nijland ME, Kelly FJ. 2013. Particulate matter beyond mass: recent health evidence on the role of fractions, chemical constituents and sources of emission. Inhal Toxicol. 25:802–812.
- Denier van der Gon HAC, Gerlofs-Nijland ME, Gehring R, et al. 2013. The policy relevance of wear emissions from road transport, now and in the future e an international workshop report and consensus statement. J Air Waste Manag Assoc. 63:136–149.
- EEA. 2016. Explaining road transport emissions – a non-technical guide. Luxembourg: Publications Office of the European Union.
- Gasser M, Riediker M, Mueller L, et al. 2009. Toxic effects of brake wear particles on epithelial lung cells in vitro. Part Fibre Toxicol. 6:30.
- Gerlofs-Nijland ME, Dormans J, Bloemen HJT, et al. 2007. Toxicity of coarse and fine particulate matter from sites with contrasting traffic profiles. Inhal Toxicol. 19:1055–1069.
- Gosens I, Cassee FR, Zanella M, et al. 2016. Organ burden and pulmonary toxicity of nano-sized copper (II) oxide particles after short-term inhalation exposure. Nanotoxicology. 10(8):1084–95.
- Gray DL, Wallace LA, Brinkman MC, et al. 2015. Respiratory and cardiovascular effects of metals in ambient particulate matter: a critical review. Rev Environ Contam Toxicol. 234:135–203.
- Grigoratos T, Martini G. 2015. Brake wear particle emissions: a review. Environ Sci Pollut Res Int. 22:2491–2504.
- Gustafsson M, Blomqvist G, Gudmundsson A, et al. 2008. Properties and toxicological effects of particles from the interaction between tires, road pavement and winter traction material. Sci Total Environ. 393:226–240.
- Happo MS, Uski O, Jalava PI, et al. 2013. Pulmonary inflammation and tissue damage in the mouse lung after exposure to PM samples from biomass heating appliances of old and modern technologies. Sci Total Environ. 443:256–266.
- HEI. 2010. Traffic-related air pollution: a critical review of the literature on emissions, exposure, and health effects. Special Report 17, Boston, MA.
- Jacobsen NR, Møller P, Jensen KA, et al. 2009. Lung inflammation and genotoxicity following pulmonary exposure to nanoparticles in ApoE–/– mice. Part Fibre Toxicol. 6:2.
- Kazimirova A, Peikertova P, Barancokova M, et al. 2016. Automotive airborne brake wear debris nanoparticles and cytokinesis-block micronucleus assay in peripheral blood lymphocytes: a pilot study. Environ Res. 148:443–449.
- Lee PW, Filip P. 2013. Friction and wear of Cu-free and Sb-free environmental friendly automotive brake materials. Wear. 302:1404–1413.
- Loxham M, Cooper MJ, Gerlofs-Nijland ME, et al. 2013. Physicochemical characterization of airborne particulate matter at a mainline underground railway station. Environ Sci Technol. 47:3614–3622.
- Malachova K, Kukutschova J, Rybkova Z, et al. 2016. Toxicity and mutagenicity of low-metallic automotive brake pad materials. Ecotoxicol Environ Saf. 131:37–44.
- Plummer LE, Carosino CM, Bein KJ, et al. 2015. Pulmonary inflammatory effects of source-oriented particulate matter from California's San Joaquin Valley. Atmos Environ. 119:174–181.
- Reijnders J, Boot M, de Goey P 2016. Impact of aromaticity and cetane number on the soot-NOx trade-off in conventional and low temperature combustion, Fuel, Volume 186, 24–34.
- Riediker M. 2007. Cardiovascular effects of fine particulate matter components in highway patrol officers. Inhal Toxicol. 19:99–105.
- Rohr AC, Wyzga RE 2012. Attributing health effects to individual particulate matter constituents. Atmos Environ. 62:130–52.
- Sachse Hannes, Augsburg K, Ivanov V, et al. 2014. An approach to lower the particle emission of friction brakes on vehicles. - In: Shaping the future by engineering: 58th IWK, Ilmenau Scientific Colloquium, Technische Universität Ilmenau; proceedings2. - Ilmenau : Univ.-Bibliothek, ilmedia http://nbn-resolving.de/urn:nbn:de:gbv:ilm1-2014iwk-195:7
- Shirmohammadi F, Hasheminassab S, Wang D, et al. 2016. The relative importance of tailpipe and non-tailpipe emissions on the oxidative potential of ambient particles in Los Angeles, CA. Faraday Discuss. 189:361–380.
- Slob W. 2002. Dose–response modeling of continuous endpoints. Toxicol Sci. 66:298–312.
- Stanek LW, Sacks JD, Dutton SJ, Dubois J. 2011. Attributing health effects to apportioned components and sources of particulate matter: an evaluation of collective results. Atmos Environ. 45:5655–5663.
- Steenhof M, Gosens I, Strak M, et al. 2011. In vitro toxicity of particulate matter (PM) collected at different sites in the Netherlands is associated with PM composition, size fraction and oxidative potential – the RAPTES project. Part Fibre Toxicol. 8:26.
- Straffelini G, Ciudin R, Ciotti A, Gialanella S. 2015. Present knowledge and perspectives on the role of copper in brake materials and related environmental issues: a critical assessment. Environ Pollut. 207:211–219.
- Tapanainen M, Jalava PI, Mäki-Paakkanen J, et al. 2012. Efficiency of log wood combustion affects the toxicological and chemical properties of emission particles. Inhal Toxicol. 24:343–355.
- Tsai MY, Hoek G, Eeftens M, et al. 2015. Spatial variation of PM elemental composition between and within 20 European study areas – results of the ESCAPE project. Environ Int. 84:181–192.
- Uski OJ, Happo MS, Jalava PI, et al. 2012. Acute systemic and lung inflammation in C57Bl/6J mice after intratracheal aspiration of particulate matter from small-scale biomass combustion appliances based on old and modern technologies. Inhal Toxicol. 24:952–65.
- Wahid S. 2018. Automotive brake wear: a review. Environ Sci Pollut Res. 25:174–180.
- WHO. 2015. http://www.euro.who.int/_data/assets/pdf_file/0009/271836/ResidentialHeatingWoodCoalHealthImpacts.pdf?ua=1