
 ?Mathematical formulae have been encoded as MathML and are displayed in this HTML version using MathJax in order to improve their display. Uncheck the box to turn MathJax off. This feature requires Javascript. Click on a formula to zoom.
Abstract
Background: Nicotine, because of its volatility, has a complex dosimetry following inhalation as a vapor/aerosol mix. To better control the dosimetry, nicotine could be formulated with a suitable dry powder excipient for use in a clinical inhaler.
Aim and Methods: The aim of this study was to investigate the pharmacokinetic PK profile of two dry powder formulations containing 2.5% or 5% nicotine using three experimental models associated to the PreciseInhale™ aerosolization system: the in vitro DissolvIt dissolution system; the ex vivo isolated, ventilated, and perfused lung (IPL) of the rat; and the in vivo intratracheally intubated rat.
Results and Discussion: Following exposure, both nicotine formulations had very rapid and similar dissolution and absorption kinetics in both the DissolvIt and IPL exposure models, with an initial half-time of absorption to the single-pass perfusate of 34 and 72 seconds, respectively. In the intratracheally intubated rat, following a rapid initial equilibration between the lungs and systemic compartments, nicotine had a systemic elimination half-time of 2.3–2.4 hours for both formulations. The rapid pulmonary PK of nicotine was likely close to the theoretical equilibration of a low-binding substance with a tissue-blood partition coefficient close to 1.
Conclusions: The data generated with the three experimental models provided a comprehensive picture of the inhalation PK of the two nicotine formulations. In particular, the results showed a very rapid dissolution and absorption of the two nicotine formulations and these results could be highly useful for improving the design and calibration of physiologically based PK models to produce more robust predictions. Abbreviations: AED: animal equivalent dose; BW: body weight; HPLC: high-performance liquid chromatography; IPL: isolated, ventilated, and perfused lung; PK: pharmacokinetics; SEM: scanning electron microscopy; USP: United States Pharmacopeia.
Introduction
Nicotine is an alkaloid with numerous biological effects (Benowitz Citation2009). Apart from its known effects as a neurological stimulant, nicotine offers potential therapeutic avenues (Caldwell et al. Citation2012; Fagerström Citation2014). The main route of exposure in humans is via inhalation in tobacco smoke or electronic nicotine delivery systems, although skin patches, chewing gums and other oral delivery products such as lozenges and mints containing nicotine have been developed over the past decades. Because of its physicochemical properties, nicotine has complex pharmacokinetics (PK) in the lungs. Nicotine is a semi-volatile substance with a vapor pressure of 0.038 mm Hg at 25 °C (Boublik et al. Citation1984). Water solubility is very high, yielding a low Henry’s law constant of 3.0 × 10⁻⁹ atm-m3/mole (US National Library of Medicine Citation2018) (Medicine). This means that when nicotine is in the vapor phase, its deposition upon inhalation is very rapid and occurs primarily in the buccal mucosa and larger airways, compared to a more peripheral lung deposition when administered via tobacco smoke or tobacco-derived aerosol (Lunell et al. Citation1996). In addition, nicotine partitions nearly equally into membrane lipids and tissue water, with a LogP of 1.17 according to the U.S. National Library of Medicine (Citation2018). Nicotine is therefore likely to have high mobility in well-perfused tissues, such as the lung (Gerde and Scott Citation2001), despite participating in an acid-base equilibrium at physiological pH (Benowitz Citation2009). Nicotine formulations from respirable-sized powders without a vapor component would likely be suitable for controlling therapeutic administration via inhalation (Caldwell et al. Citation2012).
The PreciseInhale™ (Inhalation Sciences Sweden AB, Stockholm, Sweden) aerosol exposure platform was developed to allow small-scale respirable aerosol exposures of different experimental models from in vitro to ex vivo/in vivo lung exposures starting with identical test aerosols. The platform has been used successfully for both air pollution research and the development of pharmaceuticals, as it allows the testing of various exposure modules using the same respirable aerosols (Fioni et al. Citation2018). A direct comparison of results from different modules improves interpretation accuracy and reduces the need for costly crossover studies.
The purpose of the present study was to investigate the PK of nicotine formulated as respirable-sized dry powders using three experimental models: the in vitro DissolvIt (Gerde et al. Citation2017) dissolution system; the ex vivo isolated, ventilated, and perfused lung (IPL) of the rat; and the in vivo intratracheally intubated rat (Selg et al. Citation2013).
Materials and methods
All experiments were performed at Inhalation Sciences Sweden AB (Huddinge, Sweden) and the analytical part sub-contracted to pharm-analyt Labor GmbH.
Materials and aerosol generation
Two formulations containing 2.5% and 5% nicotine in form of an organic salt, a disaccharide as bulking ingredient, and an amino acid as a coating agent (Philip Morris Inc., Neuchatel, Switzerland) were micronized to a powder and used for aerosolization.
Dry powder aerosols were generated with the PreciseInhale™ using an impactor nozzle and applying a generation pressure of 30 bar and a reset pressure of 12 bar (Fioni et al. Citation2018).
Particle size analysis
Prior to exposure, the particle size distribution of the 2.5% and 5% nicotine powders was measured using a nine-stage Marple cascade impactor (MSP Corporation, Shoreview, MN, USA) at a final flow rate of 2 L/min, and mass median aerodynamic diameter and geometric standard deviation were derived (Rubow et al. Citation1987).
Glass coating procedure
Prior to dissolution testing of the powders using the DissolvIt module (Gerde et al. Citation2017), the particles were deposited on circular glass coverslips (diameter: 13 mm). The procedure was performed using the PreciseInhale™ system with the glass coating holding chamber containing nine DissolvIt glass coverslips. One milligram of powder was loaded for each aerosol generation cycle, and an exposure flow rate of 400 mL/min was used. Three of the nine covered glass coverslips were used to estimate the mean deposited dose by high-performance liquid chromatography (HPLC). Three were used for the DissolvIt experiments, and one was used for scanning electron microscopy (SEM) imaging.
Generation and characterization of powders for IPL and intratracheally intubated rat exposures
For the IPL and intratracheal exposure of the rat, 3 mg and 5 mg of 5% and 2.5% nicotine formulations were used, respectively, for one aerosol generation cycle, to increase dose rate and decrease the difference in the exposure time between the two different formulation strengths.
To perform an accurate target dosing in both IPL and intratracheal exposure modules, based on the real-time aerosol concentration measurement by a Casella Microdust Pro light-dispersion instrument (Casella CEL, Inc., Buffalo, NY, USA), the instrument’s signal was calibrated against the inhaled mass of the test substance. For this purpose, the exposures of real lungs were simulated in the corresponding in vitro filter test system, in which the mass of the test substance likely to be inhaled during the upcoming exposures of real lungs was measured (Selg et al. Citation2013).
HPLC protocol
For nicotine dose estimates on the DissolvIt glass coverslips and for the particle size distribution analyses, a standard HPLC instrument (PerkinElmer Altus A-10; Waltham, MA, USA) was used with a reversed-phase C18 column (Agilent Eclipse XDB-C18, 5 µm, 4.6 × 25 mm; Santa Clara, CA, USA) and a photodiode array detector (PerkinElmer Altus A10). The mobile phase used was 99% ammonium acetate buffer (pH 4.0) with 1% acetonitrile (channel A) and 100% acetonitrile (channel B). The flow was isocratic, with the composition 92.5% A and 7.5% B. The detection wavelength was set to 260 nm. For each injection, 100 µL were used with a run time of six minutes. Samples were diluted in 8.5% acetonitrile mixed with 91.5% mobile phase A (named ‘diluent’). The standard curve dilutions were prepared in triplicate by diluting nicotine bitartrate dihydrate USP reference standard (USP, Rockville, MD, USA) in the diluent to five concentrations between 41 ng/mL and 501 ng/mL, yielding 15 concentrations in total. With the Log-Log Linear fit type, the curve had the correlation factor r2=0.997. HPLC was controlled using the Waters Empower 3 software (Waters Corporation, Milford, MA, USA).
DissolvIt procedure (in vitro)
DissolvIt (Inhalation Sciences Sweden AB, Huddinge, Sweden) was used for in vitro dissolution testing of the powder formulations in an artificial air–blood barrier (Gerde et al. Citation2017). Briefly, the glass coverslips were placed in the DissolvIt module with the deposited material facing up. At the start of the experiment, the particles came into contact with a 50 µm-thick mucus simulant (Gerde et al. Citation2017) that was applied on the permeable polycarbonate membrane of the dissolution chamber. Polyethylene oxide with a molecular weight of 5000 kDa (Sigma-Aldrich, St Louis, MO) was used to simulate lung mucus. The polyethylene was dissolved in phosphate buffer (0.1 M) to a concentration of 1.5% by weight. L-alphaphosphatidylcholine from dried egg yolk (Sigma-Aldrich, St. Louis, MO) was used to mimic the lipid content of cell membranes and surfactant layers of the airway mucosa. The phospholipids were thoroughly sonicated to obtain a stable dispersion and were then evenly dispersed into the mucus simulant barrier to a final concentration of 0.4% (w/w). On the other side of the polycarbonate membrane in the dissolution chamber, a perfusate was pumped single-pass with a flow rate of 0.4 mL/min. The particles were visually monitored by an inverted light microscope during dissolution. The perfusate samples with dissolved and absorbed nicotine powders were collected for 5 or 20 seconds. The midpoints of the sampling periods were 2.5, 7.5, 12.5, 17.5, 22.5, 27.5, 32.5, 37.5, 42.5, 47.5, 52.5, and 57.5 seconds (2.5% and 5% nicotine powders) and additionally at 1 minute 20 seconds, 1 minute 40 seconds, and 2 minutes (5% nicotine powder). The corresponding sample volumes were 33 and 133 µL. Twenty-five microliters were submitted to liquid chromatography/tandem mass spectrometry (LC-MS/MS) analysis (pharm-analyt Labor GmbH, Baden, Austria). For mass-balance purposes, the dissolution chamber was analyzed for undissolved or unabsorbed substance to retrospectively determine the original amount of powder on each analyzed glass coverslip.
SEM analysis
Glass coverslips from the glass coating procedure were mounted on an aluminum stub and sputter coated with 10 nm platinum (Q150T ES; Quorum Technologies Lewes, UK). The specimens were analyzed in an Ultra-55 field emission scanning electron microscope (Zeiss, Oberkochen, Germany) at 5 kV using the secondary electron detector.
Ex vivo IPL exposures to 2.5% and 5% nicotine powder aerosols
The experiments were approved by the local ethics review board (Linköpings tingsrätt, 75-15). Six male CD International Genetic Standard (IGS, Sprague-Dawley) rats (Charles River Laboratories, Sulzfeldt, Germany), body weight (BW) 296 ± 60 g (mean ± standard deviation) were used.
For ex vivo IPL exposures, the rats were euthanized with sodium pentobarbital (100 mg/kg, i.p.). Lungs were prepared as described by Kroll and colleagues (Kroll et al. Citation1986) and placed in the artificial thorax chamber. The lungs were perfused via the pulmonary artery in the single-pass mode at a constant hydrostatic pressure of 12 cm of water. The perfusion medium was Krebs–Henseleit buffer (composition: NaCl, 118.0 mM; KCl, 4.7 mM; CaCl2, 2.5 mM; MgSO4, 1.2 mM; NaHCO3, 13 mM; KH2PO4, 1.2 mM) containing 5.5 mM glucose, 12.6 mM HEPES, and 4% bovine serum albumin, fraction V (standard grade). The pH was maintained between 7.35 and 7.45. Buffer and artificial thorax chamber temperatures were maintained at 37 °C. The lungs were ventilated with unfiltered room air at 75 breaths/min by creating an alternating negative pressure (−0.1 to −0.8 kPa) (Dahlin et al. Citation1999) inside the artificial thorax chamber. Except during the exposure episodes, tracheal air flow velocity and pressure inside the thorax chamber were measured with a heated pneumotachometer (8430 Series, 0–3 L/min; Hans Rudolph, Shawnee, KS, USA) and a differential pressure transducer (emka Technologies, Paris, France), respectively. The physiological lung function variables, tidal volume (Vt), dynamic lung compliance (Cdyn), and lung conductance (Gaw), were calculated online by a data acquisition system with the software IOX v. 6.1a (emka Technologies). The perfusate flow rate after passage through the lung (Qperf) was measured gravimetrically. Normal stability was achieved concerning all the physiological parameters measured. The lungs were allowed to stabilize for 30 minutes before aerosol exposure. The baseline values were: Vt, 1.9 ± 0.1 mL; Gaw, 114.6 ± 17.5 mL/s/kPa; Cdyn, 6.5 ± 1.1 mL/kPa; Qperf, 24.9 ± 3.2 mL/min (mean ± standard deviation, n = 6). Two groups of three rat lungs were exposed ex vivo to powder aerosols containing either 2.5% or 5% nicotine. In particular, for each formulation, the animal equivalent dose (AED) of nicotine in the rat, based on a human target of 1 mg nicotine delivered to the lung (FDA CDER 2005), was calculated:
Rat AED (mg/kg) = HD (mg/kg) x Km (rat) → Km (rat) = 6.2 (FDA CDER 2005); Km is the correction factor used for conversion of human dose to the Animal Equivalent Dose (AED). This correction factor is estimated by dividing the reference body weight (kg) of species (in this case, the rat) i.e. 0.15 kg by its average body surface area (m2) i.e. 0.025 m2 (Nair and Jacob Citation2016).
Based on the calculation above, we defined the target deposition of nicotine in the rat lung to 33 μg (for a rat in a working range 300–350 g, as used in this study), corresponding to 1,320 μg and 660 μg of 2.5% and 5% nicotine powder deposited per lung, respectively. In particular, the lungs were maintained for a 120-minute perfusate collection period, during which the perfusate was sampled with a custom-made sample collector pre-exposure and 1, 2, 4, 6, 8, 10, 15, 20, 30, 60, and 120 minutes from the start of the aerosol exposure (t = 0). Immediately after the end of the perfusion period, the lungs were harvested to measure the total amounts of nicotine and cotinine remaining in the lung and trachea. The trachea was dissected separately from the lung tissue, and tissues were then weighed and frozen on dry ice. The lung perfusate and tissue samples were stored at −80 °C until analysis. The quantification of nicotine in lung perfusate and nicotine and cotinine in tissue samples was performed by LC-MS/MS (pharm-analyt Labor GmbH). Prior to the quantification of nicotine and cotinine, the lung tissues were homogenized with Ultra-Turrax or ultrasonic homogenizer. The tissue aliquots of 50-250 mg were placed in the Eppendorf conical 1.5-mL vials, to which a mixture of ethanol, DMSO and water was added.
The lowest limit of quantitation of the method for nicotine and cotinine in perfusate and lung tissues was 0.1 ng/mL and 8 ng/mL, respectively.
In vivo exposures of the intratracheally intubated rat to 2.5% and 5% nicotine powder aerosols
The experiments were approved by the local ethics review board (Stockholms Södra Djurförsöksetiska Nämnd, S30-13). For intratracheal exposures in vivo, 18 male CD IGS rats (from the same vendor as for the IPL) with a BW of 305 ± 20 g (mean ± SD) on the day of treatment were used. The animals were anesthetized i.p. with fentanyl (0.005 mg/100 g BW) and medetomidine (0.08 mg/100 g BW), and atropine sulfate (0.005 mg/100 g BW) was injected s.c. Such treatment allows normal spontaneous breathing, although the respiratory rate is generally lower than the one observed in awake animals. The animals were placed in the supine position on an adjustable table, and a stainless-steel catheter (outside diameter 2.02 mm, inside diameter 1.67 mm, length 6 cm) was inserted into the trachea using a Penn Century small animal laryngoscope (Wyndmoor, PA, USA). The tracheal catheter was connected to the PreciseInhale™ platform, and the breathing pattern of each animal was monitored for at least five minutes before aerosol exposure to ensure stable spontaneous breathing. Three groups of three rats were intratracheally exposed in vivo to powder aerosols containing either 2.5% or 5% nicotine. The aerosol was inhaled at ambient pressure (during spontaneous breathing). For each formulation, the target nicotine deposition in the rat lung was 33 μg, corresponding to 1,320 μg and 660 μg of 2.5% and 5% nicotine powder deposited per lung, respectively. The schedule for blood and tissue sampling following in vivo exposures of the rats to the study aerosols is presented in . Serial blood sampling was performed by puncture of the saphenous alt. dorsal metatarsal vein. Terminal blood sampling was performed by cardiac puncture after sacrifice with sodium pentobarbital (100 mg/kg i.p.) Blood was centrifuged to obtain plasma samples, which were immediately frozen on dry ice and stored at −80 °C until analysis. Directly after terminal blood sampling, the whole lung and trachea were excised and washed with cold saline. Thereafter, the trachea and lung tissues were weighed and frozen on dry ice. The tissue samples were stored at −80 °C until analysis.
Table 1. Blood and lung tissue sampling schedule in the rats exposed in vivo to the formulation containing 2.5% or 5% nicotine. All time points denote time after start of aerosol exposure (t = 0).
PK analysis
Data obtained from the ex vivo exposures in the IPL model were evaluated as previously reported (Selg et al. Citation2013). PK data analysis of the in vivo experiments was performed using the PKSolver ver. 2.0 software (Zhang et al. Citation2010), and the PK parameters reported were obtained using non-compartmental analysis. Cmax represents the maximum concentration obtained in tissues or plasma after administration, and tmax is the time of its occurrence. AUClast is the area under the curve for the plasma or tissue concentration as a function of time up to the last sampling point, calculated by trapezoidal integration. t1/2 represents the apparent terminal elimination half-life, calculated according to the equation t1/2 = ln2/kz, where kz is the apparent terminal elimination rate constant. MRTlast indicates the mean residence time calculated from the time of dosing to the last measurable concentration.
Results
DissolvIt
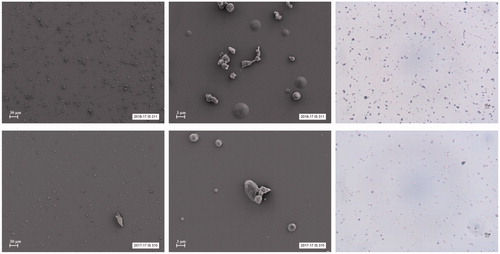
The mass median aerodynamic diameter of the nicotine particles deposited on the DissolvIt glass coverslips was 3.87 ± 0.06 µm for the 2.5% nicotine formulation and 3.95 ± 0.08 µm for the 5% nicotine formulation. The geometric standard deviation was 2.15 ± 0.09 and 1.98 ± 0.20 for the 2.5% and 5% nicotine formulations, respectively. shows SEM images and light microscope photos of the particles.
Figure 1. The upper panels show SEM images (two on the left) and a light microscope photo (right) of the 2.5% nicotine formulation. The lower panels show SEM images and a light microscope photo of the 5% nicotine formulation.
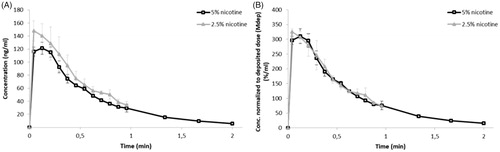
The in vitro PK profiles generated for the two nicotine formulations are shown in as concentration in the perfusate over time. In , the concentration was normalized against the amount of nicotine deposited on the glass coverslips.
Figure 2. PK profiles of 2.5% and 5% nicotine powders tested in DissolvIt (mean ± SD). (A) Nicotine concentration in the perfusate over time. (B) Nicotine concentration normalized to the deposited dose. min: minutes.
The fraction of the deposited dose that remained undissolved and unabsorbed in the DissolvIt module over time is illustrated in . All calculated PK parameters are listed in .
Figure 3. The undissolved and/or unabsorbed fraction of the deposited nicotine dose (mean ± SD) remaining in the DissolvIt system as a function of time. min: minutes.
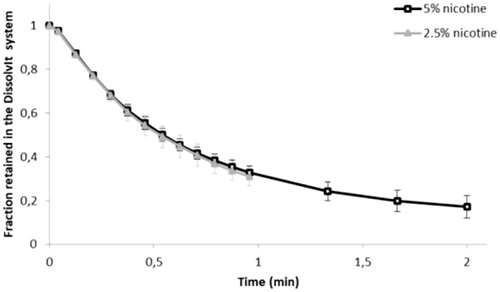
Table 2. PK parameters (mean ± SD) of the derived DissolvIt data for 2.5% and 5% nicotine powder aerosols.
IPL and intratracheally intubated rat exposures to 5% and 2.5% nicotine powder aerosols
Aerosol and exposure characteristics
Highly dispersed aerosols with a mass median aerodynamic diameter and geometric standard deviation of 4.06 µm (1.7) and 4.47 µm (1.7) were obtained from the micronized powder formulations containing 5% and 2.5% nicotine, respectively, when aerosolized with the PreciseInhale™ powder aerosol generator.
A weighted total deposition fraction of the 2.5% and 5% nicotine powder aerosols was calculated from the theoretical deposition of each size fraction using the Multiple-Path Particle Dosimetry v. 3.04 software (Applied Research Associates, Inc., Albuquerque, NM, USA). For the 2.5% nicotine powder aerosol, the weighted theoretical total deposition fraction was calculated to be 58% and 53% when inhaled by the IPL and by intratracheally exposed rats in vivo, respectively. Similarly, for the 5% nicotine powder aerosol, the weighted theoretical total deposition was calculated to be 55% and 50%, respectively. The theoretical distribution of the deposited aerosol between a tracheobronchial fraction and an alveolar fraction was around 50/50 for both nicotine powder aerosols in either of the experimental models.
The key parameters of the ex vivo exposures are shown in . For both inhalation exposure models, the exposure durations to both 2.5% and 5% nicotine aerosols were similarly short, at 2–3 minutes.
Table 3. Key parameters (mean ± standard deviation) of the inhalation exposures in the isolated perfused lung model ex vivo and in the intratracheally intubated rat in vivo.
Nicotine concentrations in lung perfusate after delivery of respirable 2.5% and 5% nicotine powder aerosols to the IPL are shown in . The corresponding PK parameters are presented in , , and . In the IPL model, nicotine appeared rapidly in lung perfusate following administration of either formulation. Tmax occurred within 1.0 to 1.7 minutes of the start of aerosol exposure (t = 0), when only 55%–76% of the total exposure time had elapsed. The achieved deposited nicotine dose in the IPL was calculated from the total amount of nicotine passed into the perfusate, plus the total amount retained in the lung tissues (lung and trachea) at the end of the experiment. This actual deposited dose was 23%–47% higher than the projected target dose based on filter exposures (). In the IPL model, only around 0.005% of the initially deposited dose of nicotine from either formulation was retained in the lung 120 minutes after exposure. The initial (0–4 minutes) half-life of compound disappearance from the lung was approximately 1 minute, and there was no difference between the 5% and 2.5% nicotine powder exposure groups ().
Figure 4. Nicotine concentration (mean ± standard deviation, n = 3) as a function of time in the single-pass lung perfusate of the IPL exposed ex vivo to powder aerosols containing 5% or 2.5% nicotine. min: minutes.
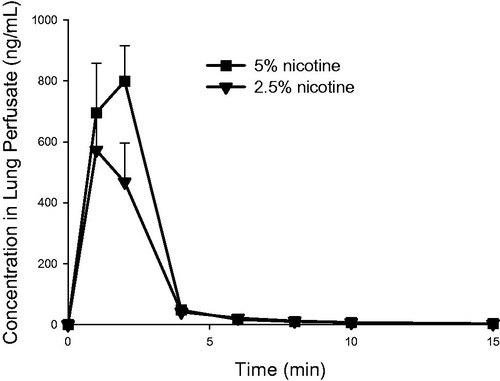
Table 4. PK parameters of nicotine (mean, n = 3), in the rat IPL exposed ex vivo to powder aerosols containing 5% or 2.5% nicotine.
Figure 5. Nicotine concentration (normalized to the initially deposited dose according to LC-MS/MS) as a function of time in the single-pass lung perfusate of the rat IPL exposed ex vivo to powder aerosols containing 5% or 2.5% nicotine. %MDEP/mL, percentage of the initially deposited dose (MDEP) cleared per milliliter of lung perfusate. Data are presented as mean ± standard deviation (n = 3). min: minutes.
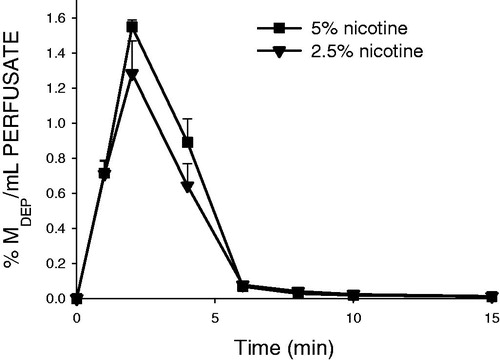
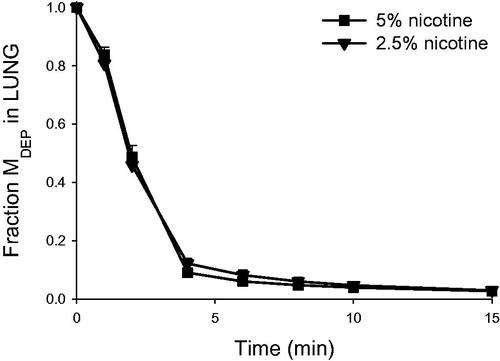
Figure 6. Nicotine retention (normalized to the initially deposited dose according to LC-MS/MS) in the lung as a function of time in the rat IPL exposed ex vivo to powder aerosols containing 5% or 2.5% nicotine. Fraction MDEP, fraction of the initially deposited dose (MDEP) retained in the lung. Data are presented as mean ± standard deviation (n = 3). min: minutes.
Intratracheally intubated rat
and show the concentrations of nicotine and cotinine in plasma () and lung () after delivery of respirable 2.5% and 5% nicotine powder aerosols to intratracheally intubated rats. The corresponding plasma and lung PK parameters are shown in and . Nicotine appeared rapidly in blood following intratracheal inhalation exposures in vivo, with tmax of five minutes after exposure. A similar inter-animal variability for nicotine and cotinine blood plasma concentrations and systemic exposure (Cmax, tmax, AUC) was observed following in vivo exposures to the two formulations (, ). A similar and fast elimination of nicotine (t1/2, MRT; Clast/Cmax ratio: 0.20–0.35) was observed for both formulations ().
Figure 7. Blood plasma concentrations of nicotine and cotinine (mean ± standard deviation, n = 3) as a function of time in rats intratracheally exposed to powder aerosols containing 5% or 2.5% nicotine. h: hours.
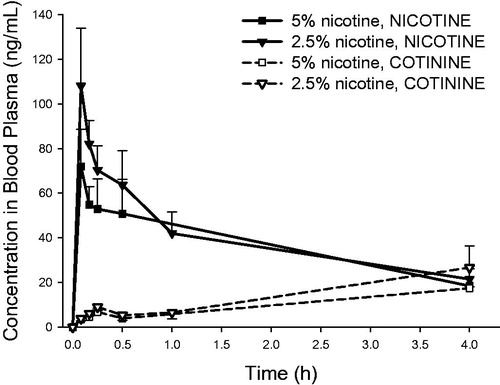
Figure 8. Lung concentrations of nicotine and cotinine (mean ± standard deviation, n = 3) as a function of time in rats intratracheally exposed to powder aerosols containing 5% or 2.5% nicotine. h: hours.
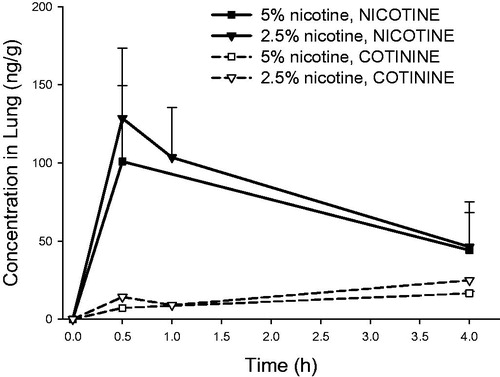
Table 5. Plasma PK parameters for nicotine and cotinine (mean, n = 3) in rats intratracheally exposed to powder aerosols containing 5% or 2.5% nicotine.
Table 6. Lung PK parameters for nicotine and cotinine (mean, n = 3) in rats intratracheally exposed to powder aerosols containing 5% or 2.5% nicotine.
The inter-animal variability for nicotine and cotinine lung levels at different time points following administration of 5% and 2.5% nicotine was also similar (). Moreover, nicotine lung levels decreased similarly rapidly over time (Clast/Cmax ratio: 0.36–0.49) following administration for both formulations, suggesting similar nicotine absorption from the lung ().
Discussion
The present study has shown the usefulness of combining several experimental models using the PreciseInhale™ system to investigate different aspects of inhalation exposures to the same dry powder formulations. Two powder formulations of nicotine were investigated in the DissolvIt in vitro dissolution system, the IPL, and in vivo by intratracheal inhalation. Together, the data produced from the three experimental models give a more comprehensive picture of the inhalation PK than a single model could. Moreover, the use of intratracheal inhalation exposure systems (both IPL and in vivo) allows better recapitulation of human exposures. Indeed, rats are obligate nose-only breathers and have a complex nose geometry, whereas humans have a simpler nose geometry and can also sustain oral inhalation, particularly during inhalation therapy schemes. Therefore, formulations with aerodynamic diameters between 4 µm and 5 µm would likely result in a high deposition efficiency in the lower respiratory tract in humans following oral inhalation. In contrast, because of the anatomical differences, the same particle size would result in a lower deposition efficiencies in the lower respiratory tract in rats, and this is the reason why aerodynamic sizes in the 1–3 µm interval are usually recommended in rat inhalation toxicity studies (OECD 2009). The DissolvIt platform indicated an instantaneous dissolution of the formulations and rapid absorption of nicotine through the simulated air–blood barrier of central airway physiological dimensions. The IPL provided similar data. The single-pass perfusion mode of the IPL yields information on the maximum rate of solute clearance from the lungs without driving force reductions in the absorption caused by a substance returning to the lungs with the circulation. The rate of perfusion of the IPL is, however, approximately one-third of the in vivo perfusion rate of the rat lung (Watanabe et al. Citation1984). Nonetheless, adding the data of IPL lung-specific absorption to the systemic PK of the same substance, measured in the rat exposed by intratracheal inhalation, gives a much better understanding of the complete in vivo PK of the studied substance following inhalation exposures. This is illustrated by combining the IPL data, which demonstrated a rapid and near-complete absorption from the lungs to the circulation within 10 minutes and a residual fraction retained in the perfused lungs after 15 minutes of less than 3%, with the distinctively biphasic systemic clearance of nicotine in the rats exposed in vivo. The combined data clearly suggest that the comparatively slow clearance of nicotine in the second phase from the lungs and other equilibrated tissues of the in vivo exposed animals is driven entirely by the slower systemic elimination of the substance from the mixed systemic blood.
All nicotine formulations tested had rapid dissolution and absorption rates in the lungs, as indicated by a perfusate clearance half-time in the DissolvIt system of less than a minute. This rate is probably close to the theoretical maximum limit for a free-diffusing substance with very low binding to the lung tissues. A typical maximum diffusivity of non-binding small organic molecules in well-perfused tissues is slightly lower than 10−9 m2/s (Gerde and Scott Citation2001). This also requires a partition coefficient between lipid membranes and tissue water that is not significantly different from 1. Nicotine, having a logP at a physiological pH around 1.2, fulfills this condition. It is likely that the high diffusive mobility of nicotine in tissues is driven by the fraction of protonated free base available (Pankow Citation2001). At a typical lung tissue pH of 7.4, the ratio of protonated to free-base nicotine is approximately equal. Therefore, the absorption of nicotine in the lung airway mucosa is limited primarily by the rate of local blood perfusion of the mucosa rather than by diffusion of nicotine through the air–blood barrier. The high diffusivity of nicotine in tissues is most evident from the rapid tmax of 5–10 seconds, as measured in the DissolvIt test barrier. With the delay caused by the pumping time of the perfusate into the fraction collector, the data obtained are likely close to the theoretical diffusional relaxation time in the air–blood barrier (Barrer Citation1951; Crank Citation1975).
The rapid dissolution and absorption of nicotine in all three exposure modules has some interesting consequences. Firstly, in the ex vivo and in vivo models the rate of nicotine clearance from the mucosa was quite similar to the model-predicted clearance rate of a substance exhibiting perfusion-limited absorption from the central airway mucosa (Gerde and Scott Citation2001). By predicting the same rapid absorption as the results of the ex vivo and in vivo models indicated, it would suggest that the DissolvIt model could also be used to simulate the more rapid, perfusion-limited absorption of substances with a logP of ∼1 from the airway mucosa. Thus, the limitation of having a porous polycarbonate membrane with a fractional hole area of only about 3% does not appear to restrict the model for use only with more slowly absorbed substances.
A second interesting interpretation is that dry powder formulations of nicotine combined with regional airway exposures could be used to measure the maximum rate of absorption of small-molecule organics in different airway segments. These data would be highly useful for improving the design and calibration of physiologically based PK models to produce more robust predictions, thereby reducing the need for experimental data input to the models. Another use for respirable-sized powdered nicotine would be to investigate the various in vitro dissolution methods published (Velaga et al. Citation2018) for their ability to simulate lung PK of rapidly dissolving and absorbing substances.
Acknowledgements
The authors would like to thank the Inhalation Sciences team as well as Daniel Mascher and pharm-analyt Labor GmbH for the technical assistance and the constructive discussions. The authors thank also Stefan Lebrun for the administrative assistance and Arkadiusz Kuczaj for the technical advice and expertise.
Disclosure statement
All authors are employees of Philip Morris International.
Additional information
Funding
References
- Barrer RM. 1951. Diffusion in and through solids. London: Cambridge University Press.
- Benowitz NL. 2009. Pharmacology of nicotine: addiction, smoking-induced disease, and therapeutics. Annu Rev Pharmacol Toxicol. 49:57–71.
- Boublik T, Fried V, Hala E. 1984. The vapour pressures of pure substances. 2nd Revised ed. Amsterdam: Elsevier.
- Caldwell B, Sumner W, Crane J. 2012. A systematic review of nicotine by inhalation: is there a role for the inhaled route? Nicotine Tob Res. 14(10):1127–1139.
- Crank J. 1975. The mathematics of diffusion. 2nd ed. Oxford, England: Clarendon Press.
- Dahlin KL, Mortberg A, Lastbom L, Ryrfeldt A. 1999. Amitriptyline-induced release of endothelin-1 in isolated perfused and ventilated rat lungs. Pharmacol Toxicol. 85(6):288–293.
- Fagerström K. 2014. Nicotine: pharmacology, toxicity and therapeutic use. J Smok Cessat. 9(2):53–59.
- FDA CDER. 2005. Guidance for industry - estimating the maximum safe starting dose in initial clinical trials for therapeutics in adult healthy volunteers; U.S. Department of Health and Human Services Food and Drug Administration Center for Drug Evaluation and Research (CDER). [accessed 2019 July] https://www.fda.gov/media/72309/download.
- Fioni A, Selg E, Cenacchi V, Acevedo F, Brogin G, Gerde P, Puccini P. 2018. Investigation of lung pharmacokinetic of the novel PDE4 inhibitor CHF6001 in preclinical models: evaluation of the preciseinhale technology. J Aerosol Med Pulm Drug Deliv. 31(1):61–70.
- Gerde P, Malmlof M, Havsborn L, Sjoberg CO, Ewing P, Eirefelt S, Ekelund K. 2017. DissolvIt: an in vitro method for simulating the dissolution and absorption of inhaled dry powder drugs in the lungs. Assay Drug Dev Technol. 15(2):77–88.
- Gerde P, Scott BR. 2001. A model for absorption of low-volatile toxicants by the airway mucosa. Inhal Toxicol. 13(10):903–929.
- Kroll F, Karlsson JA, Nilsson E, Persson CG, Ryrfeldt A. 1986. Lung mechanics of the guinea-pig isolated perfused lung. Acta Physiol Scand. 128(1):1–8.
- Lunell E, Bergstrom M, Antoni G, Langstrom B, Nordberg A. 1996. Nicotine deposition and body distribution from a nicotine inhaler and a cigarette studied with positron emission tomography. Clin Pharmacol Ther. 59(5):593–594.
- US National Library of Medicine. 2018. Substance Name: Nicotine [USP:BAN]. Toxiciology Data Network: U.S. National Library of Medicine; [accessed 2018]. https://chem.nlm.nih.gov/chemidplus/rn/54-11-5.
- Nair AB, Jacob S. 2016. A simple practice guide for dose conversion between animals and human. J Basic Clin Pharma. 7(2):27–31.
- OECD. 2009. Test No. 413: Subchronic Inhalation Toxicity: 90-day Study. OECD Publishing.
- Pankow JF. 2001. A consideration of the role of gas/particle partitioning in the deposition of nicotine and other tobacco smoke compounds in the respiratory tract. Chem Res Toxicol. 14(11):1465–1481.
- Rubow KL, Marple VA, Olin J, McCawley MA. 1987. A personal cascade impactor: design, evaluation and calibration. Am Ind Hyg Assoc J. 48(6):532–538.
- Selg E, Ewing P, Acevedo F, Sjoberg CO, Ryrfeldt A, Gerde P. 2013. Dry powder inhalation exposures of the endotracheally intubated rat lung, ex vivo and in vivo: the pulmonary pharmacokinetics of fluticasone furoate. J Aerosol Med Pulm Drug Deliv. 26(4):181–189.
- Velaga SP, Djuris J, Cvijic S, Rozou S, Russo P, Colombo G, Rossi A. 2018. Dry powder inhalers: an overview of the in vitro dissolution methodologies and their correlation with the biopharmaceutical aspects of the drug products. Eur J Pharm Sci. 113:18–28.
- Watanabe K, Nishio T, Mori C, Kihara M, Yamori Y. 1984. Measurement of cardiac output by the thermodilution method in conscious spontaneously hypertensive rats. Jpn Heart J. 25(6):1051–1058.
- Zhang Y, Huo M, Zhou J, Xie S. 2010. PKSolver: an add-in program for pharmacokinetic and pharmacodynamic data analysis in Microsoft Excel. Comput Methods Program Biomed. 99(3):306–314.