
 ?Mathematical formulae have been encoded as MathML and are displayed in this HTML version using MathJax in order to improve their display. Uncheck the box to turn MathJax off. This feature requires Javascript. Click on a formula to zoom.
Abstract
Objective: To develop a physiologically based pharmacokinetic (PBPK) model for chloroprene in the mouse, rat and human, relying only on in vitro data to estimate tissue metabolism rates and partitioning, and to apply the model to calculate an inhalation unit risk (IUR) for chloroprene.
Materials and methods: Female B6C3F1 mice were the most sensitive species/gender for lung tumors in the 2-year bioassay conducted with chloroprene. The PBPK model included tissue metabolism rate constants for chloroprene estimated from results of in vitro gas uptake studies using liver and lung microsomes. To assess the validity of the PBPK model, a 6-hr, nose-only chloroprene inhalation study was conducted with female B6C3F1 mice in which both chloroprene blood concentrations and ventilation rates were measured. The PBPK model was then used to predict dose measures – amounts of chloroprene metabolized in lungs per unit time – in mice and humans.
Results: The mouse PBPK model accurately predicted in vivo pharmacokinetic data from the 6-hr, nose-only chloroprene inhalation study. The PBPK model was used to conduct a cancer risk assessment based on metabolism of chloroprene to reactive epoxides in the lung, the target tissue in mice. The IUR was over100-fold lower than the IUR from the EPA Integrated Risk Information System (IRIS), which was based on inhaled chloroprene concentration. The different result from the PBPK model risk assessment arises from use of the more relevant tissue dose metric, amount metabolized, rather than inhaled concentration
Discussion and conclusions: The revised chloroprene PBPK model is based on the best available science, including new test animal in vivo validation, updated literature review and a Markov-Chain Monte Carlo analysis to assess parameter uncertainty. Relying on both mouse and human metabolism data also provides an important advancement in the use of quantitative in vitro to in vivo extrapolation (QIVIVE). Inclusion of the best available science is especially important when deriving a toxicity value based on species extrapolation for the potential carcinogenicity of a reactive metabolite.
Introduction
Chloroprene (CAS # 126-99-8) is a highly volatile chlorinated analog of 1,3-butadiene that is used in the manufacture of polychloroprene rubber (Neoprene). A cancer risk assessment for chloroprene conducted by the USEPA (Citation2010) calculated an inhalation unit risk (IUR) of 5 × 10⁻⁴ per µg/m3 based on tumor incidence data from female mice exposed to chloroprene for 2 years (NTP Citation1998; Melnick et al. Citation1999). The USEPA (Citation2010) assessment used a default cross-species extrapolation approach based on chloroprene exposure concentration, despite strong evidence of quantitative differences in chloroprene metabolism in mice and humans that would have a significant impact on the calculated risk (Himmelstein, Carpenter, and Hinderliter Citation2004; Himmelstein, Carpenter, Evans, et al. Citation2004). The metabolism of chloroprene results in the formation of reactive epoxides that are considered to be responsible for its carcinogenicity in rodents (USEPA Citation2010).
To determine the potential impact of species-specific differences in the production of these epoxides, a physiologically based pharmacokinetic (PBPK) model was developed in a collaborative research effort between DuPont Haskell Laboratory and the USEPA National Health and Environmental Effects Research Laboratory (NHEERL). In vitro measurements of partition coefficients and metabolism parameters for chloroprene in mice, rats, hamsters and humans (Himmelstein, Carpenter, and Hinderliter Citation2004) were used in the PBPK model (Himmelstein, Carpenter, Evans, et al. Citation2004) to predict species-specific dose metrics for the production of epoxides in the lung, the most sensitive tissue in the mouse bioassay. The dose metric chosen for this comparison is consistent with the dose metrics used in previous PBPK-based risk assessments for methylene chloride and vinyl chloride, which are also metabolized to reactive metabolites that are considered to be responsible for the observed carcinogenicity in rodents. Closed-chamber exposures of mice, rats and hamsters were used to validate the PBPK model’s ability to predict the pharmacokinetic behavior of chloroprene in vivo. The USEPA (Citation2010), however, did not make use of the PBPK model from Himmelstein, Carpenter, Evans, et al. (Citation2004) in their risk assessment, citing the lack of blood or tissue time course concentration data for model validation. In addition, USEPA indicated that they did not consider the comparisons of model predictions with the closed-chamber studies to be adequate because the data were limited to chloroprene vapor uptake from the closed chambers.
After the time of the USEPA (Citation2010) evaluation, Yang et al. (Citation2012) provided additional data for refining the PBPK model of Himmelstein, Carpenter, Evans, et al. (Citation2004). To supplement the data in Himmelstein, Carpenter, and Hinderliter (Citation2004) on liver and lung metabolism in male mouse, male rat, and pooled human cells, subsequent studies (IISRP Citation2009a) measured liver and lung metabolism in female mouse and female rat, as well as kidney metabolism in male and female mouse, male and female rat, and pooled human cells. The totality of the data from the Himmelstein, Carpenter, and Hinderliter (Citation2004), and IISRP (Citation2009a) in vitro metabolism studies were then used to refine the metabolism parameter estimates for the chloroprene PBPK model using Markov-chain Monte Carlo (MCMC) analysis. A comparison of lung dose metric estimates in mouse, rat and human was then performed using the updated metabolism parameters (Yang et al. Citation2012). These dose metrics were subsequently used in a study comparing genomic responses to chloroprene in the mouse and rat lung (Thomas et al. Citation2013) and a study comparing human risk estimates derived from mouse bioassay and human epidemiological data (Allen et al. Citation2014), but to date no in vivo blood or tissue time course concentration data have been published with which to evaluate the ability of the chloroprene PBPK model to predict in vivo kinetics.
The objectives of the present study were to (1) characterize the in vivo pharmacokinetics of chloroprene via analysis of whole blood concentrations in female B6C3F1 mice during and following a single 6-hr nose-only inhalation exposure, and (2) determine respiratory parameters (breathing frequency and tidal volume) during chloroprene exposure. In this paper we also demonstrate the ability of the refined chloroprene PBPK model to reproduce new in vivo validation data and use the PBPK model in an inhalation cancer risk assessment that properly considers species differences in pharmacokinetics and metabolism.
Materials and methods
Nose-only exposure study
Test substance and atmosphere generation
The test substance, β-Chloroprene (CAS # 126-99-8) containing polymerization inhibitors, was supplied by the sponsor as a clear liquid. Exposure atmospheres were generated by metering saturated chloroprene vapor from a stainless-steel pressure vessel reservoir (McMaster Carr, Atlanta, GA) into the nose-only exposure chamber air supply. The concentrated chloroprene vapor was metered through a mass flow controller (MKS Instruments Inc., Andover, MA) and mixed with HEPA-filtered air approximately six feet upstream of the nose-only inlet. Chloroprene vapor was introduced counter-current to the dilution air to facilitate mixing of the vapors with the dilution air. Chloroprene concentrations were monitored on-line using a gas chromatography system with flame ionization detector (GC-FID). Calibration of the GC-FID for chloroprene analysis was conducted through the analysis of a series of calibration standards produced by introducing pure chloroprene into Tedlar® bags containing known volumes of nitrogen gas (nitrogen was metered into the bag using a calibrated flow meter).
Test animals and housing
Female B6C3F1 were purchased from Charles Rivers Laboratories, Inc (Raleigh, NC) at 8 weeks of age and acclimated to their surroundings for approximately two weeks prior to use. Following acclimation animals were assigned to a dosing group by randomization of body weights using Provantis NT 2000, assigned unique identification numbers, cage cards, and housed (1/cage) in polycarbonate cages with standard cellulose bedding. Animals were housed in a humidity and temperature controlled, HEPA-filtered, mass air-displacement room provided by the Association for Assessment and Accreditation of Laboratory Animal Care International (AAALAC) accredited animal facility at The Hamner Institutes. This room was maintained on a 12-hr light-dark cycle at approximately 64oC-79oF with a relative humidity of approximately 30–70%. Rodent diet NIH-07 (Zeigler Brothers, Gardners, PA) and reverse osmosis water was provided ad libitum except during exposures. Food and water were withheld from all animals during the chloroprene exposures. Prior to the start of the chloroprene exposure, animals were weighed and their weights were recorded.
The Hamner Institutes for Health Sciences was fully accredited by the AAALAC during the time the study was performed. Currently acceptable practices of good animal husbandry were followed per the National Research Council Guide for the Care and Use of Laboratory Animals and were in compliance with all appropriate parts of the Animal Welfare Act. In addition, the study design and protocol were approved by The Hamner Institutes’ Institutional Animal Care and Use Committee (IACUC) prior to the initiation of the study.
Inhalation exposures
Inhalation exposures were conducted at 13, 32, and 90 ppm for 6 hr. Blood was collected by cardiac puncture at a total of 6 time-points, 0.5, 3, and 6 hr during exposure and 5, 10, and 15 min post-exposure. To support collection of whole blood during the exposures, nose only towers were fitted with specially designed nose only exposure tubes. These exposure tubes were manufactured from 50 mL polypropylene bulb irrigation syringes (Sherwood Medical, St. Louis, MO). Three elongated holes (0.625″ × 1.125″) were drilled into the wall of the syringe to allow access to the thorax of the mouse during chloroprene exposure. A second irrigation syringe was cut to form a sleeve around the first syringe to provide an air tight barrier during the exposures. This sleeve was pulled back during the exposure to allow for the injection of pentobarbital (100 mg/kg) while the animal continued to inhale chloroprene. Blood was removed directly from the mouse via arterial-side cardiac puncture while the mouse was still housed in the syringe and breathing chloroprene.
Plethysmography
A total of 16 mice (4 per exposure group including air controls) were used for the purpose of collecting tidal volume and breathing frequency. Data were acquired using modified nose-only Buxco plethysmograph tubes for pulmonary function monitoring. Data from control mice were collected prior to the first chloroprene exposure. Plethysmography data from both control and exposed mice were collected for 2–3 hr.
Blood sampling
Whole blood was collected at 0.5, 3, and 6 hr during exposure and 5, 10, and 15 min post-exposure. Whole blood collection during chloroprene exposures (0.5, 3, and 6-hr time points) were done using the specially designed nose only exposure tubes described above.
Blood analysis
Quantification of chloroprene in whole blood was conducted by headspace sampling with analysis by gas chromatography mass spectrometry (GC/MS). The sampling method to be used, headspace analysis, as well as the GC/MS method were based on the previously published method for the analysis of 1,3-butadiene in whole blood from mice and rats (Himmelstein et al. Citation1994).
Briefly, 200 µL of whole blood, obtained by cardiac puncture, was transferred into pre-labeled, capped, and weighed airtight headspace vials (1.5 mL autosampler vial). Sample vials were weighed to obtain an accurate estimate of sample size and allowed to equilibrate at room temperature for 2 hr. Once equilibration was complete, samples were analyzed using an Agilent 5973 mass spectrometer coupled to an Agilent 6890 gas chromatograph. The mass spectrum was run in electron impact mode with selective ion monitoring (instrumental conditions are listed below).
Calibration curves were prepared by spiking stock control whole blood with known amounts of chloroprene obtained as a certified standard solution of chloroprene in methanol. Quality control samples were prepared by spiking control rat plasma with a certified chloroprene standard. QC samples were spiked to low (near the first calibration point), medium (near the middle of the calibration curve), and high (near the highest point of the calibration curve) levels. Aliquots of the prepared QC’s were placed in sealed GC vials (3 aliquots for each level, 9 total) and kept frozen at −80 °C until required (GC vials had a minimum of headspace prior to freezing). On the blood collection days, a low-, middle-, and high-level QC was thawed and allowed to come to room temperature for 4 hr. After this time, the QC samples were “sampled” with a syringe identical to those being used for the collection of whole blood, placed in a GC vial in a manner identical to that of the whole blood collection, and analyzed along with the samples and standards.
Additional details of the nose-only inhalation study can be found in IISRP (Citation2009b).
Chloroprene PBPK model
The development and documentation of the chloroprene PBPK model has been conducted in a transparent manner consistent with the WHO/IPCS (Citation2010) guidance on PBPK modeling. The following sections describe the basis for the model structure and parameterization, as well and the methods used for sensitivity/uncertainty analysis and risk assessment application of the model.
Model structure
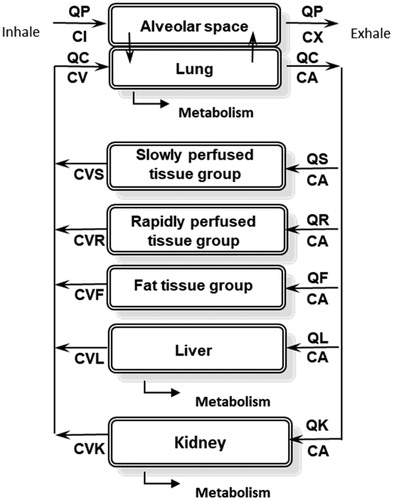
The structure of the PBPK model used in this study () is based on the PBPK model of chloroprene described in Himmelstein, Carpenter, Evans, et al. (Citation2004), as modified by Yang et al. (Citation2012). As in previous models of volatile organic compounds (Ramsey and Andersen Citation1984; Andersen et al. Citation1987), the blood is described using a steady-state approximation and the model assumes blood-flow limited transport to tissues and venous equilibration of tissues with the blood. Metabolism is described in the liver, lung and kidney using Michaelis-Menten saturable kinetics.
Figure 1. Chloroprene PBPK model diagram. QP: alveolar ventilation; CI: inhaled concentration; CX: exhaled concentration; QC: cardiac output; CA: arterial blood concentration; CV: venous blood concentration; QS, CVS: blood flow to, and venous concentration leaving, the slowly perfused tissues (e.g., muscle); QR, CVR: blood flow to, and venous concentration leaving, the richly perfused tissues (most organs); QF, CVF: blood flow to, and venous concentration leaving, the fat; QL, CVL: blood flow to, and venous concentration leaving, the liver; QK, CVK: blood flow to, and venous concentration leaving, the kidney.
Model parameters
All physiological parameters in the model for mouse, rat and human (Table S-1 in Supplemental Materials A) are taken from Brown et al. (Citation1997) except for the cardiac output in the mouse and the alveolar ventilation and cardiac output in the human. While the alveolar ventilation in the mouse is taken from Brown et al. (Citation1997), relying on the value of cardiac output reported in Brown et al. (Citation1997) would result in a value of 11.6 L/hr/bw3/4 for cardiac output (QCC). If used with the Brown et al. (Citation1997) value of 29.1 L/hr/bw3/4 for alveolar ventilation (QPC), this would result in a serious mismatch between ventilation and perfusion (V/Q ratio ≫1). Andersen et al. (Citation1987), the developers of the PBPK model for methylene chloride that was used in the USEPA (Citation2011) IRIS assessment, argued that it would be more biologically realistic to assume that the V/Q ratio was close to 1 at rest, and stated that their previous experience with PBPK modeling of data on clearance of chemicals in the mouse under flow-limited metabolism conditions supported the use of a higher value for QCC. Therefore, the value of QCC in the current model was calculated by dividing the alveolar ventilation from Brown et al. (Citation1997) by a MCMC estimate of V/Q = 1.45 for the mouse based on pharmacokinetic data for exposures to another volatile organic chemical, methylene chloride (Marino et al. Citation2006), which was used in the USEPA (Citation2011) inhalation cancer risk assessment for that chemical. In the case of the human, it is more appropriate to use the default EPA ventilation rate of 20 L/day, reflecting an average activity level, rather than a resting value (Clewell et al. Citation2001). Since the values for alveolar ventilation and cardiac output in Brown et al. (Citation1997) are resting values, we used the values calculated for the PBPK model of vinyl chloride (Clewell et al. Citation2001), which was used in the USEPA (Citation2000) cancer risk assessment for that chemical. The parameter values, which were calculated to be consistent with the USEPA default ventilation rate of 20 L/day, were QPC = 24.0 L/hr/bw3/4 and a QCC of 16.5 L/hr/bw3/4 (V/Q ratio of 1.45).
Apart from the physiological parameters, the model parameters are based entirely on in vitro data. The partition coefficients (Table S-2 in Supplemental Materials A) were calculated from the results of in vitro vial equilibration data reported by Himmelstein, Carpenter, Evans, et al. (Citation2004), using the partition coefficients for muscle and kidney to represent the slowly and rapidly perfused tissues, respectively. To obtain the model parameters for metabolism in the liver, lung and kidney, the original in vitro chloroprene metabolism time-course data (Himmelstein, Carpenter, and Hinderliter Citation2004; IISRP Citation2009a) were re-analyzed using a MCMC analytical approach similar to the one performed in Yang et al. (Citation2012). The key differences between the new analysis and the original Yang et al. (Citation2012) analysis were: (1) the incorporation of an additional parameter in the analysis of the in vitro metabolism data (Kgl) to describe the rate of transfer of chloroprene from the headspace to the media in the metabolism studies, (2) the use of updated tissue microsomal protein concentrations for scaling the in vitro results to in vivo values appropriate for the PBPK model, and (3) the adoption of a previously published approach for estimating the metabolism parameters in the human lung (Andersen et al. Citation1987).
Re-estimation of in vitro metabolism parameters: Schlosser et al. (Citation1993) suggested that mass transport limitations should be assessed when estimating metabolism from in vitro experiments conducted with volatile compounds where there is an air:liquid interface. Since mass transport limitation was not addressed in the in vitro metabolism studies conducted with chloroprene (Himmelstein, Carpenter, and Hinderliter Citation2004; IISRP Citation2009a), a new experimental study was performed to estimate a Kgl for chloroprene following a protocol based on that in Schlosser et al. (Citation1993). The new experimental study, which is described in Supplemental Materials B, resulted in an estimated value of 0.024 L/hr for Kgl, similar to the value previously reported for benzene (Schlosser et al. Citation1993). However, this experimentally estimated value of Kgl was not consistent with the high rates of liver metabolism observed at low concentrations of chloroprene; that is, the mass transport associated with a Kgl of 0.024 L/hr was too slow to support the observed rates of metabolism in the media.
We considered it likely that the much faster uptake of chloroprene in the metabolism studies than in the Kgl study was due to more effective mixing during the incubations, together with nonspecific surface binding of chloroprene to the microsomes, which provide a lipophilic binding component in the aqueous media. No microsomes were present in the Kgl experiments for chloroprene or benzene (Schlosser et al. Citation1993). Although the rate of shaking in the metabolism studies (Himmelstein, Carpenter, and Hinderliter Citation2004; IISRP Citation2009a) was not reported, we were able to determine that these studies used a Gerstel MPS2 autosampler with an agitating heater, which was set to an agitation rate of 500 rpm (Himmelstein 2019, personal communication), in comparison to the 60 rpm agitation rate used in Schlosser et al. (Citation1993) and the present study.
To account for this difference in agitation rates, it was suggested (Paul Schlosser, personal communication) that the value of Kgl in the metabolism studies was likely to be higher than the value in the new experimental study by roughly the ratio of the mixing rates, that is, Kgl(metabolism studies) = Kgl(experimental study) × 500/60 = 0.024 × 500/60 = 0.2 L/hr. To confirm this expectation, we conducted a new MCMC analysis to simultaneously estimate Kgl, Vmax and Km from the metabolism data for the male mouse (Himmelstein, Carpenter, and Hinderliter Citation2004), which provided the strongest information regarding the dose-response for the clearance of chloroprene in the vials. The resulting value of Kgl estimated from this analysis was 0.22 L/hr, with a 95% confidence interval of 0.19–0.33 L/hr, consistent with the estimated value. The estimated value was then used in the re-estimation of the metabolism parameters for all tissues (Supplemental Materials B). The results of the new in vitro metabolism parameter estimation are provided in Table S-3 in Supplemental Materials A.
Selection of tissue scaling parameters: Based on a review of the literature (Supplemental Materials C), an updated set of scaling parameters was chosen: 35, 45, and 40 mg protein/g liver for mice, rats, and humans, respectively, (Medinsky et al. Citation1994 for mouse, Houston and Galetin Citation2008 for rat, Barter et al. Citation2007 for human). For the lung, 20 mg protein/g was selected for all species (Medinsky et al. Citation1994). The microsomal content of kidney was 18 mg protein/g for mouse and rat and 11 mg protein/g human (Yoon et al., Citation2007 for mouse and rat; Scotcher et al., Citation2017 for human). The maximum velocity and 1st order clearance rate constants were scaled allometrically (mg/hr/BW0.75 or L/hr/BW0.75) using the species and sex specific time and survival weighted average BW from the control group reported in the chloroprene bioassay (NTP Citation1998) for mouse and rat and 70 kg for human. The in vivo metabolism parameters derived using the revised scaling parameters are listed in Table S-4 in Supplemental Materials A and the IVIVE calculations are provided in Supplemental Materials D.
Estimation of chloroprene metabolism in the human lung: Unfortunately, we found that the extremely low rates of chloroprene metabolism observed in the human lung (Himmelstein, Carpenter, and Hinderliter Citation2004) made parameter estimation for this tissue highly uncertain. The 95% confidence interval for human lung metabolism in the new MCMC analysis ranged from near zero (7.5 × 10⁻²³) to 0.44 L/hr/g microsomal protein, with a mean that was also near zero (1.5 × 10⁻¹¹). Therefore, this posterior distribution was only used in the PBPK model uncertainty analysis, while in the application of the model to calculate dose metrics, we estimated the metabolism parameter for the human lung using the approach used in the USEPA (Citation2011) risk assessment for methylene chloride, which relied on the PBPK model developed by Andersen et al. (Citation1987). In that model, the Km for metabolism in the human lung was assumed to be the same as the Km in the human liver, and the Vmax in the human lung was calculated from the Vmax in the human liver using a parameter (A1) derived from the ratio of the specific activities for metabolism of 7-ethoxycoumarin, a well-studied CYP2E1 substrate, in liver and lung (Lorenz et al. Citation1984).
Model simulations
The previously published version of the chloroprene PBPK model (Yang et al. Citation2012), which was written in the Advanced Continuous Simulation Language (ACSL), was translated into R, an open source programing language, to improve its portability. The R code for the model is included in Supplemental Materials E. The full model code, including the scripts for running the model, is available from the authors on request.
To model the experimental data from the nose-only inhalation exposures reported here, only the alveolar ventilation and cardiac output were altered. The average ventilation rate measured in the mice during the study was used to calculate an alveolar ventilation for use in the model, assuming 2/3 of total ventilation is alveolar (Brown et al. Citation1997), and the cardiac output was then calculated by dividing the alveolar ventilation by the V/Q ratio from Marino et al. (Citation2006), as described in the results.
Parameter sensitivity analysis
Parameter sensitivity analysis was conducted with the model under two scenarios: (1) the prediction of blood concentrations in the mouse nose-only study, and (2) the prediction of dose metrics for the mouse bioassay exposures and for the human at 1 ppm continuous exposure. The results were calculated as normalized sensitivity coefficients (fractional change in prediction divided by fractional change in parameter) for parameters with a coefficient greater than 0.1 in absolute magnitude. A positive coefficient indicates the direction of change of the prediction is the same as the direction of change of the parameter. The parameters were changed by 1%, one at a time.
Risk assessment application
Consistent with previous PBPK modeling of chloroprene (Himmelstein, Carpenter, Evans, et al. Citation2004; Yang et al Citation2012), the dose metric calculated with the PBPK model for derivation of an IUR is micromoles of chloroprene metabolized in the lung per gram lung per day. This dose metric was chosen because the lung is the tissue with the highest tumor incidence in the chloroprene inhalation bioassays (NTP Citation1998) and the carcinogenicity of chloroprene in rodents is believed to result from its metabolism to reactive epoxides in the target tissue (Himmelstein, Carpenter, and Hinderliter Citation2004; Himmelstein, Carpenter, Evans, et al. Citation2004). The dose metric selected for chloroprene is consistent with the dose metrics used in previous PBPK-based risk assessments for both vinyl chloride (USEPA Citation2000; Clewell et al. Citation2001) and methylene chloride (Andersen et al. Citation1987; USEPA Citation2011), which were also based on the production of reactive metabolites.
To estimate an IUR, the PBPK model was first used to simulate the NTP (Citation1998) bioassay exposures (12.8, 32 and 80 ppm; 6 hr/day, 5 days/week) and calculate the corresponding target tissue dose metrics (in this case, average daily production of epoxide metabolites in the lung per gram lung). Consistent with USEPA practice, the PBPK-based target tissue dose metrics were then used in place of the air concentrations in BMDS, the USEPA’s Benchmark Dose modeling program, to estimate a 95% lower-bound estimate of the dose metric associated with a tumor risk of 0.01 (the BMDL01). The PBPK model was then used to estimate the same target tissue dose metric in a human exposed continuously to chloroprene at a concentration of 1 µg/m3 for their lifetime. Due to the uncertainty associated with the low rate of chloroprene metabolism in the human lung observed in the in vitro studies (Himmelstein, Carpenter, and Hinderliter Citation2004), the human lung metabolism parameters were estimated using the approach in the methylene chloride PBPK-based risk assessment (Andersen et al. Citation1987), where the affinity of lung metabolism was assumed to be the same as in the liver, and the relative capacity of lung to liver was based on in vitro data for a standard substrate, 7-ethoxycoumarin. This was done to provide a more conservative (higher) estimate of the human dose metric than would be obtained from the in vitro data for chloroprene. The IUR was then estimated by the following formula:
Uncertainty analysis
Monte Carlo uncertainty analysis was conducted with the chloroprene PBPK model to estimate the uncertainty in the dose metrics resulting from the uncertainty in the estimates of the model parameters, particularly the metabolism parameters estimated from the in vitro studies (Himmelstein, Carpenter, and Hinderliter Citation2004; IISRP Citation2009a). For the purpose of evaluating uncertainty in the dose metrics, the posterior distributions for all metabolism parameters from the MCMC analysis were used, including the metabolism parameter for the human lung (as opposed to the use of the approach used in Andersen et al. (Citation1987) for methylene chloride, which was used in this analysis for the risk assessment calculations). Variability in the physiological and partitioning parameters was taken from Clewell and Jarnot (Citation1994).
Crystal Ball Release 11.1.2.3.850 was used to obtain the parameter values for the mouse and human parameters used in the PBPK model. The values reported in were used to define the specified distributions for the physical parameters. Most of the parameter distributions were truncated on both the lower and upper ends of the distribution at mean ± 2.5 × std except where noted (i.e., parameters where the lower bound would be less than zero). Normal distributions were used for the body weight, tissue volumes and blood flows. Log-normal distributions were used for the partition coefficients. Five thousand iterations were performed in Crystal Ball and the data from the iterations were extracted for use as input values for the PBPK model.
The metabolism parameters were obtained by random selection without replacement from the last 5000 iterations of the Markov Chain Monte Carlo simulation, to pair with the iterations of the parameters estimated using Crystal Ball. The mouse metabolism parameters were randomized separately from the human metabolism parameters.
The target tissue dose metrics (average daily production of epoxide metabolites in the lung per gram lung) were estimated using these parameters for the mouse bioassay exposures (12.8, 32 and 80 ppm; 6 hr/day, 5 days/week) in the PBPK model. Human dose metrics were obtained using 5000 iterations of the human parameters obtained from Crystal Ball with a constant external exposure concentration of 1 μg/m3.
The target tissue dose metrics for the bioassay exposures were then used in time-to-tumor modeling of the incidence of lung alveolar/bronchiolar adenomas and carcinomas with the Multistage–Weibull model provided with the EPA BMDS software (February 25, 2010 version). The Multistage Weibull model has the following form:
BMDS was used to obtain a benchmark dose (BMD) and the 95% lower bound on that dose (BMDL) associated with a benchmark risk (BMR) of 0.01 for each of the 5000 iterations. The data used with the Multistage–Weibull model was the NTP (Citation1998) female mouse combined incidence of alveolar/bronchiolar adenomas and carcinomas. For this dataset, the one animal for which the class of tumor was unknown was excluded from the analyses and the BMD and BMDL01 calculations were for incidental extra risk of 0.01 at t = 105 weeks.
In addition to the target tissue dose metrics for the mice, human dose metrics were obtained using the 5000 iterations of the human parameters obtained from Crystal Ball and a constant external exposure concentration of 1 μg/m3. As a final step in calculating the IURs, the equation below was used:
Each of the 5000 iterations were used to calculate an IUR by pairing the randomized mouse BMDL01 with a randomized human dose metric at 1 μg/m3. Since the mouse and human parameters were randomized without replacement and independently before the calculation of the dose metrics, the human and mouse dose metrics were paired on a one-to-one basis.
Correlation analysis was performed between the calculated BMDL01s and the PBPK model parameters used in the calculation of the dose metrics.
Results
Chloroprene exposure atmospheres
Chloroprene concentrations were monitored in the nose only chambers during the 13, 32, and 90 ppm exposures, as well as in the control nose-only tower. All three target concentrations were well within 10% of their nominal levels.
Plethysmography
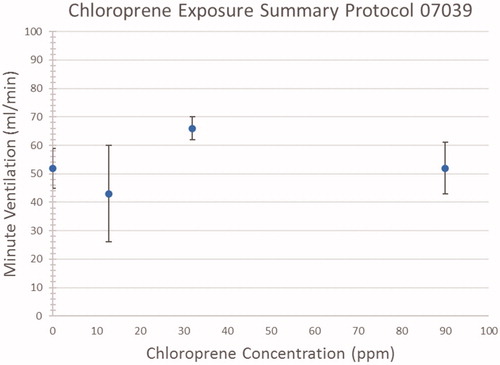
shows the measured minute volumes for the three exposure groups and controls. The data is represented as average values (diamonds) with standard deviation error bars. The data is provided in Table S-5 in Supplemental Materials A. There is no evidence of a concentration-related effect of short-term exposure to chloroprene on ventilation in mice. The average ventilation rate across all four exposure groups, including controls, was 56.2 mL/min. The average body weight for the mice in the study was 22 g; therefore, this ventilation rate equates to a model parameter for alveolar ventilation (QPC) of 39.4 L/hr/bw3/4. The corresponding model value of QCC in this study is obtained by dividing QPC by the V/Q ratio of 1.45 for the mouse (Marino et al. Citation2006), yielding a value for QCC of 27.2 L/hr/bw3/4, which compares well with the QCC of 24.2 estimated for mouse exposures to methylene chloride (Marino et al. Citation2006).
Figure 2. Measured minute ventilation during exposures.
Blood chloroprene concentrations
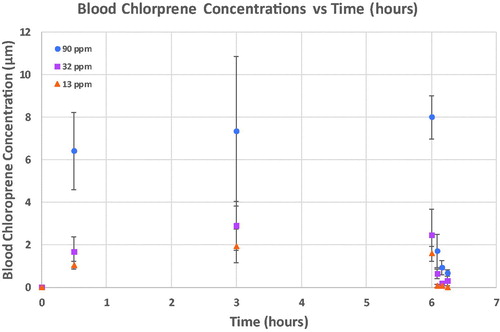
shows the average chloroprene blood concentrations for all three single day exposures (Data are provided in Table S-6 of Supplemental Materials A). Average blood chloroprene concentrations are represented by the symbols with standard deviations for each treatment group represented with error bars.
Figure 3. Blood chloroprene concentrations during and following a single nose-only exposure of female B6C3F1 mice to chloroprene at 13, 32 and 90 ppm for 6 hr. Average blood chloroprene concentrations (symbols) and standard deviations (error bars) are shown for each treatment group.
PBPK modeling of the nose-only inhalation study
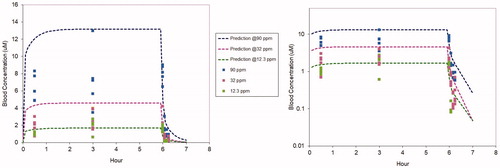
The nose-only study described above was simulated with the chloroprene PBPK model using the parameters in Tables S1, S2, and S4, except for QPC and QCC, where the study-specific values derived from the plethysmography data were used. As shown in , using only in vitro-derived metabolism and partitioning parameters the model predictions for blood concentrations during and after the 6-hr chloroprene exposures are in good agreement with the data collected in the study, consistent with the WHO/IPCS (Citation2010) guidance on PBPK modeling, model predictions are generally within roughly a factor of two of the means of the experimental data. It was not necessary to adjust any of the model parameters to provide agreement with these new data.
Figure 4. PBPK model predicted (dotted lines) and measured (symbols) blood concentrations during and following 6-hr exposures of B6C3F1 mice to chloroprene at 12.3 (green), 32 (fuchsia) or 90 (blue) ppm. The same data and model predictions are shown using a linear y axis (left) and a logarithmic y axis (right). The linear plot provides a better comparison for concentrations, whereas the logarithmic plot provides a clearer comparison for the post-exposure clearance.
PBPK model parameter sensitivity
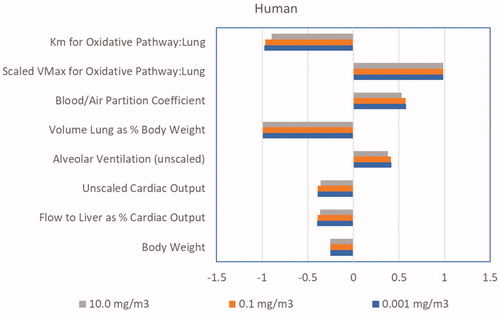
As shown in , when simulating the nose-only exposures only 4 model parameters have sensitivity coefficients greater than 0.1 in absolute magnitude: alveolar ventilation, cardiac output, blood:air partition coefficient and fractional blood flow to liver. All of these parameters were either directly measured or based on data from the literature, as described in the Methods, and can be considered to have low uncertainty. When predicting lung dose metrics in the female mouse (), the sensitive parameters include the same parameters as those for the predictions of blood concentrations, with the addition of the parameters for lung metabolism and the body weight. The sensitive parameters for predictions of lung dose metrics in the human () are the same as those in the mouse, except that a single clearance parameter is used in the human due to the low rate of metabolism in the human lung. These analyses of the sensitivity of the model to uncertainty in its parameters suggest that performing a human in vivo validation study would be unlikely to provide a significant added value for model evaluation.
Figure 5. Parameter sensitivity coefficients for the chloroprene PBPK model for the prediction of blood concentrations in the nose-only study.
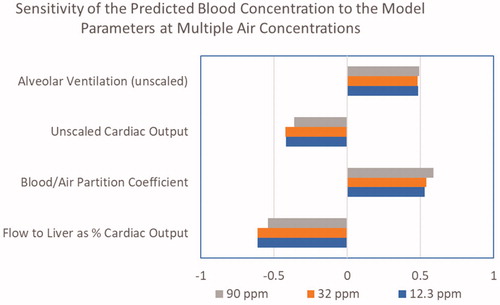
Figure 6. Parameter sensitivity coefficients for the chloroprene PBPK model for the prediction of lung dose metrics in the female mouse for exposures in the 2-year bioassay.
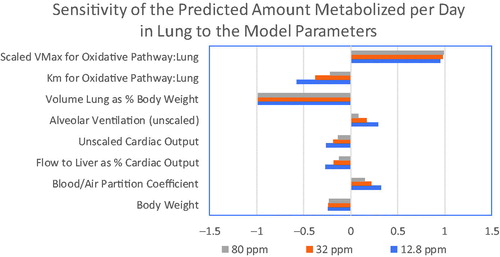
Figure 7. Parameter sensitivity coefficients for the chloroprene PBPK model for the prediction of lung dose metrics in the human for continuous exposures.
PBPK-based risk assessment for chloroprene lung carcinogenicity
The dose metrics for lung metabolism in the female mouse bioassay and for human continuous exposure are shown in . These estimates were obtained with the chloroprene PBPK model using the parameters in Tables S1, S2, and S4.
Table 1. Dose metrics for lung metabolism (average mg metabolized per gram lung per day) in the female mouse bioassay and for human continuous exposures.
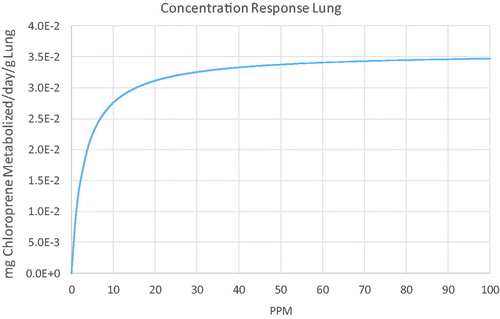
Using the dose metrics from the model, the BMDL01 in the mouse estimated with BMDS was 0.0092, resulting in an estimated IUR of 0.01*3. 36 × 10−6/0.0092 = 3.65 × 10⁻⁶ (µg/m3)−1, a factor of 137 lower than the USEPA (Citation2010) IUR of 5.0 × 10⁻⁴ (µg/m3)−1. As in the risk assessment for methylene chloride (USEPA Citation2011), this risk at 1 µg/m3 cannot be used to estimate risks at higher exposure concentrations due to the saturation of metabolism in the lung. As illustrated in , risks above 1 ppm increase less than linearly.
PBPK model uncertainty analysis
Monte Carlo uncertainty analysis was performed to evaluate the impact on risk estimates associated with uncertainty in the PBPK model parameters. The input parameter distributions are provided in Table S-6 in Supplemental Materials A. The results of the analysis are presented in .
Table 2. Percentiles of daily lung metabolism dose metric distributions in the mouse bioassay and for a human continuous exposure to 1 µg/m3 chloroprene, as well as the resulting BMDLs and IURs, using the newly estimated parameters in this study based on the in vitro assays with chloroprene (including the estimated first order rate of metabolism of chloroprene in the human lung).
The results of the Monte Carlo uncertainty analysis indicate that the uncertainty in the predictions of the model for the animal dose metrics and the resulting BMDLs is only on the order of a factor of 2. However, the uncertainty in the human dose metric, and the resulting IUR, is very large. This uncertainty results from the very low rate of human lung metabolism observed in the in vitro studies conducted with chloroprene (Himmelstein et al. Citation2001; Yang et al. Citation2012). However, the 95th percentile upper bound risk estimate of 3.38 × 10⁻⁶ (µg/m3)−1 is lower than the risk estimate of 3.65 × 10⁻⁶ (µg/m3)−1 in that was obtained using the approach from Andersen et al. (Citation1987), which was based on relative CYP activities in human liver and lung. Thus, reliance on the uncertain in vitro data for human lung metabolism of chloroprene would result in lower risk estimates than those in .
It should be emphasized that the parameters in the chloroprene PBPK model represent estimates for an average mouse or human and this Monte Carlo analysis does not address human inter-individual variability. The intention of the Monte Carlo analysis conducted with the chloroprene PBPK model was to characterize the uncertainty in model predictions of risk for an average individual. Previous evaluations of the impact of interindividual variability in pharmacokinetics on PBPK model-based risk estimates (Clewell and Andersen Citation1996) have suggested that the confidence interval for inter-individual variability in human internal dose, is generally consistent with the default expectation of a factor of ten; that is, the ratio of a sensitive individual (95th percentile) to an average individual is on the order of a factor of 3. More recently, a MCMC evaluation of the variability in human risk estimates with the PBPK model for methylene chloride (David et al. Citation2006), which included consideration of a polymorphism for the metabolism of methylene chloride, found that the upper 95th percentile risk in the US population was within a factor of 3 of the mean risk estimate.
Discussion
In this study we characterized the time course blood concentrations of chloroprene in female B6C3F1 mice during and following a single 6-hr nose-only inhalation exposure over the range of concentrations used in the NTP (Citation1998) bioassays. These data, including both whole blood concentrations and respiratory parameters (breathing frequency and tidal volume) during and after these exposures provide a reliable basis for evaluating the ability of the chloroprene PBPK model to predict in vivo pharmacokinetics in the bioassays. We have then applied the PBPK model in an inhalation cancer risk assessment that considers species differences in pharmacokinetics. The IUR obtained with the PBPK model was 137-fold lower than the IUR published by USEPA (Citation2010) based on inhaled chloroprene concentration. The principal reason for the lower human risks estimated with the PBPK model as compared to the USEPA (Citation2010) assessment, which was based on inhaled chloroprene concentration, is the use of a pharmacokinetic dose metric for cross-species extrapolation that considers the impact of metabolic differences. The use of a PBPK model for this purpose is consistent with the conclusion of the National Academy of Science (NRC Citation1987) that: “relevant PBPK data can be used to reduce uncertainty in extrapolation and risk assessment.” The application of the model is also consistent with recommended practice for the use of PBPK modeling in risk assessment (WHO/IPCS 2010).
It is important to note that, due to the low rates of metabolism in the in vitro assays for the rat and human lung, it is only possible to estimate a pseudo-first-order clearance for these tissues. Therefore, the original chloroprene model (Himmelstein, Carpenter, Evans, et al. Citation2004; Yang et al. Citation2012) used a linear description of metabolism in these tissues, which is only appropriate in the concentration range below the Km in the lung, a parameter that is highly uncertain in the rat and human. Thus model-based metabolism predictions for human exposures significantly greater than 1 ppm would greatly overestimate the associated risk. One approach for dealing with the inability to estimate the value of Km in the human lung is to use the value of Km estimated in the human liver. This approach was used in the PBPK model for methylene chloride (Andersen et al. Citation1987) and in the present analysis. The impact of saturable metabolism on human dose metric predictions is shown in . Without estimating a value for Km, the model-predicted risks above 1 ppm would continue to increase at a biologically implausible rate.
Figure 8. Inhaled concentration dependence of lung metabolism in the human for continuous exposures to chloroprene predicted with the PBPK model.
Interestingly, comparison of the Kms for chloroprene in liver and lung for male and female mice (Table S-3), which are based on the strongest data sets for estimating Kms, suggests that Km may be higher (lower affinity) in the mouse lung than in the mouse liver. This difference in apparent affinities in mouse liver and lung is consistent with differences in the relative tissue abundances of the murine CYP2E1 and CYP2F isozymes, both of which exhibit high affinities for chlorinated alkenes (Yoon et al. Citation2007). Whereas CYP2E1 is the predominant high affinity isozyme in the mouse liver, CYP2F is the predominant high affinity isozyme in the mouse lung (Yoon et al. Citation2007) and, consistent with the estimated Kms for chloroprene, the affinity of rCYP2E1 is roughly 3-fold higher (lower Km) than rCYP2F2 (Simmonds et al. Citation2004). However, since there is no evidence of CYP2F activity in the primate lung (Baldwin et al. Citation2004), no difference in Kms in the human lung and liver would be expected, so the estimation of human lung Km based on the human liver Km is appropriate.
Not unexpectedly, in our re-analysis we found that the extremely low rates of chloroprene metabolism observed in vitro in the human lung (Himmelstein, Carpenter, and Hinderliter Citation2004) made parameter estimation for this tissue highly uncertain. The 90% confidence interval for human lung metabolism in the new MCMC analysis ranged from near zero (1.2 × 10⁻²²) to 0.39 L/hr/g microsomal protein. Therefore, we estimated the metabolism parameter for the human lung using the same approach as the USEPA (Citation2011) risk assessment for methylene chloride; that is, the Km for metabolism in the human lung was assumed to be the same as the Km in the human liver, and the Vmax in the human lung was calculated from the Vmax in the human liver using a parameter (A1) derived from the ratio of the specific activities for metabolism of 7-ethoxycoumarin, a well-studied CYP2E1 substrate, in liver and lung (Lorenz et al. Citation1984). Using the human value of A1 (0.00143), together with the estimated values of Vmax and Km in the human liver from the MCMC analysis (0.052 µmol/hr/mg protein and 0.32 µmol/L), results in a metabolic clearance in the lung of 0.16 L/hr/g microsomal protein. This human lung metabolism estimate is similar to the value of 0.32 L/hr/g microsomal protein previously estimated for chloroprene by Yang et al. (Citation2012) and is within the confidence interval estimated by our new analysis of the in vitro data. In support of the applicability of A1 to chloroprene, the value of A1 in the male mouse (0.414) from Lorenz et al. (Citation1984) is close to the ratio of the in vitro Vmax in the lung and liver of the male mouse in our new analysis (0.56, see Table S-3). The value of A1 is also consistent with the reported ratio of total CYP2E1 plus CYP2F1 mRNA expression in human lung and liver of 0.00059 (Nishimura et al. Citation2003), which is about a factor of two lower than A1.
Selection of dose metric
The dose metric calculated with the PBPK model in this analysis is micromoles of chloroprene metabolized in the lung per gram lung per day (Himmelstein, Carpenter, Evans, et al. Citation2004; Yang et al. Citation2012). This dose metric was chosen because (1) the lung is the tissue with the highest tumor incidence in the chloroprene inhalation bioassays (NTP Citation1998) and (2) the carcinogenicity of chloroprene in rodents is believed to result from its metabolism to reactive epoxides in the target tissue (Himmelstein, Carpenter, and Hinderliter Citation2004; Himmelstein, Carpenter, Evans, et al. Citation2004). The dose metric selected for chloroprene is consistent with the dose metrics used in previous PBPK-based risk assessments for both vinyl chloride (USEPA Citation2000; Clewell et al. Citation2001) and methylene chloride (Andersen et al. Citation1987; USEPA Citation2011), which were also based on the rate of production of reactive metabolites. The dose metric selected for the liver carcinogenicity of vinyl chloride was total mg vinyl chloride metabolized per kg liver per day, representing the production of the reactive chloroethylene epoxide. Due to the presence of chlorine in the epoxides generated from the metabolism of chloroprene, they are considered likely to have a reactivity comparable to vinyl chloride (Haley Citation1978; Plugge and Jaeger Citation1979). The methylene chloride dose metric was average daily metabolism by the glutathione conjugation pathway in the lung per gram lung, which was selected based on evidence that the carcinogenicity of methylene chloride was associated with the local production of a reactive metabolite from the glutathione conjugate of methylene chloride. As with vinyl chloride and chloroprene, the assumption inherent in the dose metric was that the reactive metabolite would be completely consumed within the tissue where it was generated.
Himmelstein, Carpenter, Evans, et al. (Citation2004) have previously demonstrated that using the PBPK dose metric is able to harmonize the dose-responses for lung tumors in mice, rats and hamsters. However, they only had metabolism data for male animals. shows an update of the analysis from Himmelstein, Carpenter, Evans, et al. (Citation2004) that includes the results for the female mouse and rat. While the revised PBPK model is still able to demonstrate the consistency of the tumor incidence across male animals of different species and strains, female mice exhibit a higher tumor incidence than male mice at the same rate of lung metabolism.
Figure 9. Comparison of dose-response for lung tumors in chloroprene bioassays in rodents.
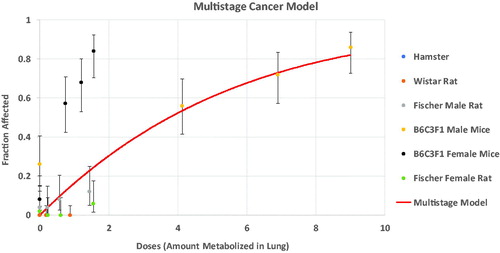
This discrepancy could indicate either of two possibilities: (1) the selected dose metric, rate of metabolism of chloroprene in the lung, is incorrect, or (2) the female mouse lung is more sensitive to the effects of chloroprene metabolites than the male mouse lung. Relatively few studies have been conducted to explore gender differences in the responses to chemical insult in the mouse lung. However, Yamada et al. Citation2017, provides evidence of a proliferative response of Club cells to the toxicity of permethrin in the female mouse lung that is not observed in the male mouse lung, and studies of naphthalene lung toxicity have demonstrated a greater sensitivity of the female mouse lung to both acute and repeated toxicity (Van Winkle et al. Citation2002; Sutherland et al. Citation2012). The greater susceptibility to a proliferative response to lung toxicity in the female mouse appears to result from gender differences in the tissue response to damage rather than metabolism (Laura Van Winkle, personal communication). A study of the genomic responses in the lungs of female mice and rats to inhaled chloroprene (Thomas et al. Citation2013) also demonstrated a greater pharmacodynamic sensitivity of the female mouse. In this study, female mice and rats were exposed for up to three weeks to inhaled chloroprene concentrations that were chosen to result in similar rates of epoxide production in the two species. The study found that while the most sensitive tissue responses occurred at similar values of the metabolism dose metric, transcriptional evidence of oxidative stress occurred at much lower concentrations in the female mouse. The more sensitive response of the female mouse to oxidative stress and to a proliferative response may underlie the apparent potency difference indicated by . Using the metabolism dose metric effectively ignores the greater sensitivity of the female mouse, which is health protective, since the greater sensitivity of the female mouse results in a lower BMDL01 than would be obtained from the male mouse.
The toxicity and carcinogenicity observed in rodents following exposure to chloroprene is believed to be related to the reactivity of the epoxides, 1-CEO and 2-CEO, that are formed by its metabolism (Himmelstein, Carpenter, and Hinderliter Citation2004). The use of a chloroprene PBPK dose metric that is based on total metabolism per gram lung represents a measure of the production of these metabolites but does not reflect any species differences that might exist in their clearance. However, due to the expectation that the rearrangement of 1-CEO and 2-CEO to reactive aldehydes is spontaneous and not enzymatically catalyzed, and that the reaction of the epoxides with glutathione is primarily related to direct GSH conjugation rather than enzymatic conjugation via glutathione transferases, clearance by these pathways would be expected to be identical across species, as was the case for methylene chloride, where the clearance of the chloromethylglutathione metabolite was non-enzymatic and rapid (Andersen et al. Citation1987). The only other clearance pathway, enzymatic hydrolysis of chloroprene by epoxide hydrolase, has been shown to be slower in mouse lung compared to human lung in the case of 1-CEO (Himmelstein, Carpenter, and Hinderliter Citation2004), and it is reasonable to assume that relationship for 2-CEO, which is too reactive to measure in vitro (Himmelstein, Carpenter, and Hinderliter Citation2004). would be similar. Thus, the total clearance of both epoxides is expected to be similar or greater in the human compared to the mouse, and the use of the dose metric based solely on production would provide a health-conservative (similar or higher) estimate of human risk compared to a dose metric that also considered clearance.
The risk assessment for vinyl chloride (USEPA Citation2000) demonstrated that the use of a PBPK model to estimate target tissue dose (based on total metabolism per gram liver per day) was able to produce similar human risk estimates using data from animal bioassays and human occupational exposures. As a similar test of the chloroprene PBPK model to support cross-species extrapolation, Allen et al. (Citation2014) used a statistical maximum likelihood approach to compare risk estimates obtained using external (air concentration) and internal (PBPK model estimated) metrics for the female mouse bioassay and human occupational exposures. The analysis concluded that if inhaled concentration was used as the dose metric, the estimates of human cancer risk using animal and human data were statistically significantly different, whereas using the PBPK metric consistent risk estimates were obtained across species. As with vinyl chloride, the use of the PBPK-based metric effectively reconciled the differences in mouse and human low-dose risk estimates.
Use of in vitro metabolism data
The most notable aspect of the chloroprene PBPK model is that, apart from the physiological parameters, the parameters in the model are based on data derived solely from in vitro studies. The PBPK model for chloroprene is structurally similar to the PBPK model for methylene chloride (Andersen et al. Citation1987) and, just as in the case of the methylene chloride risk assessment, model predictions needed to support a risk assessment are critically dependent on parameters that can only be derived from in vitro metabolism experiments.
At the time the methylene chloride PBPK model was developed, the use of in vitro data to predict in vivo metabolism was a relatively new concept, but in the intervening years it has become common practice both for pharmaceuticals (Rostami-Hodjegan Citation2012) and environmental chemicals (Yoon et al. Citation2012). While regulatory agency acceptance of PBPK models that are not based primarily on in vivo data still presents a challenge (EURL ECVAM Citation2017), “next generation” physiologically based kinetic modeling (NG PBK, Paini et al. Citation2019) has gained widespread acceptance for supporting regulatory decision making. In this regard it is important to distinguish two forms of NG PBK: high-throughput IVIVE (HT-IVIVE) and chemical-specific PBPK/QIVIVE. In the HT-IVIVE methodology, a simplified generic pharmacokinetic model is applied across chemicals regardless of the potential impact of chemical-specific properties on the processes affecting their disposition and the nature of their metabolism. The simplified generic models used in HT-IVIVE necessarily ignore many factors that could be an important determinant of steady-state blood concentrations for a particular chemical, including incomplete absorption, presystemic intestinal metabolism, bypassing of hepatic presystemic metabolism by lymphatic uptake (in the case of lipophilic compounds), and active renal clearance or resorption. Due to the imprecision associated with this simplified generic approach (Wetmore et al. Citation2015; Wambaugh et al. Citation2015), HT-IVIVE is typically applied in screening approaches such as prioritization for further testing based on bioactivity concentrations from high-throughput testing. However, more exacting QIVIVE methods can be applied in chemical-specific PBPK modeling, and there are now many examples of published NG PBK models using these techniques to provide more accurate predictions of in vivo kinetics (Yoon et al. Citation2012; Paini et al. Citation2019). In the development of the chloroprene PBPK model we have followed the PBPK/QIVIVE approach described in Yoon et al (Citation2012) and Paini et al. (Citation2019). Going forward it will be important to develop a consensus on standard practices for IVIVE of metabolism in PBPK modeling in order to assist agencies in their evaluations.
Comparison of current MCMC analysis with analysis in Yang et al. (Citation2012)
In their analysis of in vitro data on chloroprene metabolism, Yang et al. (Citation2012) employed both a standard frequentist approach (referred to in their analysis as a “deterministic” approach) and an approach that used a Markov Chain Monte Carlo (MCMC) method (referred to as a “probabilistic” approach) with non-informative prior distributions for all estimated parameters. The use of non-informative priors allows this Bayesian approach to be interpreted from a frequentist perspective. As stated in the Yang et al. document, the two methods were compared to demonstrate that the they provided consistent estimates of metabolic parameter values. Yang et al. (Citation2012) then relied on the MCMC-based estimates for developing dose metrics for chloroprene exposures in mouse, rat and human. Because it seeks a global optimum using a probabilistic direct search algorithm, MCMC is less likely than deterministic search algorithms to converge on a local optimum. Moreover, when used with non-informative priors, as in Yang et al. (Citation2012), the posterior distribution represents the likelihood distribution for the parameter, and the mode of the distribution represents the maximum likelihood estimate (MLE). As pointed out in Chiu et al. (Citation2007), the Bayesian approach, in principle, yields a more global characterization of parameter uncertainty than the local, linearized variance estimates provided by traditional optimization routines, which should be viewed as lower bound estimates of true parameter uncertainty. Because of its superior properties, we have also relied on the MCMC approach in our re-analysis of the original in vitro metabolism data.
The key difference between the MCMC analysis performed in this study and the original analysis (Yang et al. Citation2012) was that this re-analysis included an additional parameter (Kgl) for the in vitro experiments, representing the potential for a mass transport limitation for uptake of chloroprene from the air in the metabolism vials. To evaluate the impact of our re-analysis of the in vitro metabolism data using Kgl on predicted risk estimates, the PBPK model was also used to calculate dose metrics using the previously published metabolism parameters from Yang et al. (Citation2012). Again, due to the high uncertainty in the estimated value of the human lung metabolism parameter, the approach using A1 from Andersen et al. (Citation1987) was applied. The results with the two parameterizations are compared in .
Table 3. Comparison of predictions of current model parameterization with previously published model (Yang et al. Citation2012).
Using the new parameters, estimated under the assumption of an air:liquid transport limitation in the in vitro studies, the mouse dose metrics increase by roughly 30–40% and the human dose metrics increase by roughly 40%, but the resulting risk estimates are similar, providing additional evidence of the robustness of the PBPK model-based risk estimates.
Use of in vivo data for PBPK model validation
PBPK modeling has now been applied in risk assessments for a variety of environmental chemicals by regulatory agencies worldwide. The development of these models has typically required the use of in vivo experimental animal and/or human data to estimate key kinetic parameters such as uptake, metabolism and elimination. Some agencies also require the use of separate in vivo data to demonstrate model validity. However, it has become increasingly difficult to conduct controlled exposures of human subjects to chemicals of concern, other than for pharmaceuticals. The need for live animal studies is also being challenged, particularly in the EU, due to both ethical and practical (cost, throughput) concerns. Therefore, requirements for in vivo testing will increasingly limit the potential application of PBPK modeling in risk assessment, and agencies will need to consider whether in vivo validation data is truly necessary for assessing the fitness of a model for the specific purpose of its use in a particular risk assessment. To support these decisions, PBPK model evaluations should make greater use of uncertainty analyses to estimate the potential reduction in model uncertainty associated with the collection of additional data; that is, to determine the added value of a proposed study (Clewell et al. Citation2008; Keisler et al. Citation2014; Wilson Citation2015).
The original chloroprene PBPK model (Himmelstein, Carpenter, Evans, et al. Citation2004) was not used by USEPA (Citation2010) because the agency considered it necessary to have blood or tissue time course concentration data from an in vivo study to adequately validate the model. The study reported here was conducted to address this requirement and we have now demonstrated that the chloroprene PBPK model accurately simulates these in vivo blood time course validation data.
No in vivo validation data for chloroprene is available in the human, and it is unlikely that such a study could be performed given the current classification of chloroprene as “likely to be a carcinogen” (USEPA Citation2010). However, the sensitivity analyses reported here suggest that such a study would not provide significant added value for demonstrating that the PBPK model is fit for purpose for a chloroprene risk assessment. The validity of the model instead derives from the biological validity of the physiological and biochemical underpinnings of the model structure and parameters. The key parameters for performing a risk assessment for chloroprene are those for lung metabolism, and a human in vivo study would not be able to provide informative data for those parameters. As shown in , blood concentrations of chloroprene associated with inhalation are insensitive to lung metabolism, and depend only on alveolar ventilation, cardiac output, blood:air partition coefficient and fractional blood flow to liver that serves as the primary site of metabolic clearance.
The limited value of human in vivo data for determining whether a PBPK model is fit for purpose in a risk assessment based on target tissue metabolism was also an issue during the development of the PBPK model of methylene chloride (Andersen et al. Citation1987), where a similar dose metric was used: average daily metabolism of methylene chloride by glutathione transferase (GST) in the lung per gram lung. Although the model accurately reproduced blood and exhaled air concentration time-course data from multiple studies with human subjects, the in vivo data were not adequate to estimate the rates of GST metabolism in the liver and lung. Instead, it was necessary to estimate the rate of GST metabolism in the human liver by allometric scaling from animal data (Andersen et al. Citation1987), and to then estimate the rate of GST metabolism in the human lung using the ratio of specific activities for GST metabolism in liver and lung measured in vitro by Lorenz et al. (Citation1984).
Conclusion
A PBPK model of chloroprene that relies solely on data from in vitro studies for its metabolism parameters accurately predicts the in vivo time course for chloroprene in the blood of female mice exposed by nose-only inhalation to the 3 concentrations used in the chloroprene 2-year cancer bioassay. The human lung cancer risk estimated using the PBPK model is lower than the USEPA (Citation2010) risk estimates based on inhaled concentration by a factor of 137. Similar large differences between PBPK-based risk estimates and estimates based on inhaled concentration have been seen in previous inhalation risk assessments for chemicals where toxicity results from the production of reactive metabolites (Andersen et al. Citation1987; Clewell et al. Citation2001). Given the potentially high impact of species differences in pharmacokinetics on estimates of human risk and the potentially limited value of in vivo data, particularly human data, for validating some PBPK models, future requirements for validation of a PBPK model using in vivo data should be evaluated on a case-by-case basis to determine the potential added value of the studies before making them a condition for acceptance of a PBPK model in a risk assessment.
UIHT-2019-0065-File005.pdf
Download PDF (90.8 KB)UIHT-2019-0065-File004.pdf
Download PDF (739.6 KB)UIHT-2019-0065-File003.pdf
Download PDF (415.4 KB)UIHT-2019-0065-File002.pdf
Download PDF (1 MB)UIHT-2019-0065-File001.pdf
Download PDF (250.3 KB)Acknowledgments
From the work at the Hamner Institutes for Health Sciences, we thank Dr. Mark A. Sochaski (analytical chemistry), Carl U. Parkinson, Jr. (inhalation generation/characterization), Paul W. Ross, Carol M. Bobbitt and Kathy A. Bragg (animal care). The authors would also like to thank Paul Schlosser, EPA/NCEA, for his helpful comments and suggestions during the preparation of this manuscript. This research was supported by IISRP (in vivo study) and Denka Performance Elastomer, LLC (PBPK modeling). The authors would also like to thank Matt Himmelstein and Patrick Walsh, who served as the technical contacts for IISRP and Denka, respectively, for their helpful support and guidance during the research effort, and TekLab, Inc., Environmental Laboratory for conducting the chloroprene Kgl study.
Disclosure statement
No potential conflict of interest was reported by the authors.
References
- Allen BC, Van Landingham C, Yang Y, Youk AO, Marsh GM, Esmen N, Gentry PR, Clewell HJ, III, Himmelstein MW. 2014. A constrained maximum likelihood approach to evaluate the impact of dose metric on cancer risk assessment: application to b-chloroprene. Reg Tox Pharm. 70(1):203–213.
- Andersen ME, Clewell HJ, Gargas ML, Smith FA, Reitz RH. 1987. Physiologically based pharmacokinetics and the risk assessment process for methylene chloride. Toxicol Appl Pharmacol. 87(2):185–205.
- Andersen ME, Gargas ML, Clewell HJ, III, Severyn KM. 1987. Quantitative evaluation of the metabolic interactions between trichloroethylene and 1,1-dichloroethylene by gas uptake methods. Toxicol Appl Pharmacol. 89(2):149–157.
- Brown RP, Delp MD, Lindstedt SL, Rhomberg LR, Beliles RP. 1997. Physiological parameter values for physiologically based pharmacokinetic models. Toxicol Ind Health. 13(4):407–484.
- Baldwin RM, Jewell WT, Fanucchi MV, Plopper CG, Buckpitt AR. 2004. Comparison of pulmonary/nasal CYP2F expression levels in rodents and Rhesus Macaque. J Pharmacol Exp Ther. 309(1):127–136.
- Barter ZE, Bayliss MK, Beaune PH, Boobis AR, Carlile DJ, Edwards RJ, Houston JB, Lake BG, Lipscomb JC, Pelkonen OR, et al. 2007. Scaling factors for the extrapolation of in vivo metabolic drug clearance from in vitro data: reaching a consensus on values of human microsomal protein and hepatocellularity per gram of liver. CDM. 8(1):33–45.
- Chiu WA, Barton HA, DeWoskin RS, Schlosser P, Thompson CM, Sonawane B, Lipscomb JC, Krishnan KJ. 2007. Evaluation of physiologically based pharmacokinetic models for use in risk assessment. J Appl Toxicol. 27(3):218–237.
- Clewell HJ, Andersen ME. 1996. Use of physiologically-based pharmacokinetic modeling to investigate individual versus population risk. Toxicology. 111(1–3):315–329.
- Clewell HJ, Gentry PR, Gearhart JM, Allen BC, Andersen ME. 2001. Comparison of cancer risk estimates for vinyl chloride using animal and human data with a PBPK model. Sci Total Environ. 274(1-3):37–66.
- Clewell HJ, Jarnot BM. 1994. Incorporation of pharmacokinetics in non-carcinogenic risk assessment: example with chloropentafluorobenzene. Risk Anal. 14(3):265–276.
- Clewell HJ, Andersen HJ, Blaauboer BJ. 2008. On the incorporation of chemical-specific information in risk assessment. Toxicol Lett. 180(2):100–109.
- David RM, Clewell HJ, Gentry PR, Covington TR, Morgott DA, Marino DJ. 2006. Revised assessment of cancer risk to dichloromethane II: application of probabilistic methods to cancer risk determination. Reg Tox Pharm. 45(1):55–65.
- EURL ECVAM Workshop on New Generation of Physiologically-Based Kinetic Models in Risk Assessment 2017. EUR 28794 EN, Publications Office of the European Union, Luxembourg, ISBN 978-92-79-73849-4, PUBSY No. JRC108231.
- Haley T. 1978. Chloroprene (2-chloro-1,3-butadiene)—what is the evidence for its carcinogenicity? Clin Toxicol. 13(2):153–170.
- Himmelstein MW, Carpenter SC, Evans MV, Hinderliter PM, Kenyon EM. 2004. Kinetic modeling of beta-chloroprene metabolism: II. The application of physiologically based modeling for cancer dose response analysis. Toxicol Sci. 79(1):28–37.
- Himmelstein MW, Carpenter SC, Hinderliter PM. 2004. Kinetic modeling of beta-chloroprene metabolism: I. In vitro rates in liver and lung tissue fractions from mice, rats, hamsters, and humans. Toxicol Sci. 79(1):18–27.
- Himmelstein MW, Gladnick NL, Donner EM, Snyder RD, Valentine R. 2001. In vitro genotoxicity testing of (1-chloroethenyl)oxirane, a metabolite of beta-chloroprene. Chem Biol Interact. 135–136:703–713.
- Himmelstein MW, Turner MJ, Asgharian B, Bond JA. 1994. Comparison of blood concentrations of 1,3-butadiene and butadiene epoxides in mice and rats exposed to 1,3-butadiene by inhalation. Carcinogenesis. 15(8):1479–1486.
- Houston JB, Galetin A. 2008. Methods for predicting in vivo pharmacokinetics using data from in vitro assays. CDM. 9(9):940–951.
- International Institute of Synthetic Rubber Producers (IISRP). 2009a. β-Chloroprene: in vitro rate constants for metabolism in liver, lung, and kidney microsomes. IISRP-17520-1388. Docket ID No. EPA-HQ-ORD-2009-0217.
- International Institute of Synthetic Rubber Producers (IISRP). 2009b. Chloroprene: blood concentration toxicokinetics in female mice by single and repeated inhalation exposure. IISRP-12828-1388. Docket ID No. EPA-HQ-ORD-2009-0217.
- Keisler J, Collier Z, Chu E, Sinatra N, Linkov I. 2014. Value of information analysis: the state of application. Environ Syst Decis. 34(1):3–23.
- Lorenz J, Glatt HR, Fleischmann R, Ferlinz R, Oesch F. 1984. Drug metabolism in man and its relationship to that in three rodent species: monooxygenase, epoxide hydrolase, and glutathione S-transferase activities in subcellular fractions of lung and liver. Biochem Med. 32(1):43–56.
- Marino DJ, Clewell HJ, Gentry PR, Covington TR, Hack CE, David RM, Morgott DA. 2006. Revised assessment of cancer risk to dichloromethane I: Bayesian PBPK and dose-response modeling in mice. Reg Tox Pharm. 45(1):44–54.
- Medinsky MA, Leavens TL, Csanády GA, Gargas ML, Bond JA. 1994. In vivo metabolism of butadiene by mice and rats: a comparison of physiological model predictions and experimental data. Carcinogenesis. 15(7):1329–1340.
- Melnick RL, Sills RC, Portier CJ, Roycroft JH, Chou BJ, Grumbein SL, Miller RA. 1999. Multiple organ carcinogenicity of inhaled chloroprene (2-chloro-1,3-butadiene) in F344/N rats and B6C3F1 mice and comparison of dose-response with 1,3-butadiene in mice. Carcinogenesis. 20(5):867–878.
- National Research Council (NRC). 1987. Pharmacokinetics in risk assessment. Drinking water and health. Vol. 8. Washington (DC): National Academy Press.
- Nishimura M, Yaguti H, Yoshitsugu H, Naito S, Satoh T. 2003. Tissue distribution of mRNA expression of human cytochrome P450 isoforms assessed by high-sensitivity real-time reverse transcription PCR. Yakugaku Zasshi. 123(5):369–375.
- NTP (National Toxicology Program). 1998. Toxicology and carcinogenesis studies of chloroprene (CAS No. 126-99-8) in F344 rats and B6C3F1 mice (inhalation studies). Public Health Service, U.S. Department of Health and Human Services; NTP TR-467. Research Triangle Park (NC): National Institute of Environmental Health Sciences. http://ntp.niehs.nih.gov/ntp/htdocs/LT)rpts/tr467.pdf.
- Paini A, Leonard JA, Joossens E, Bessems JGM, Desalegn A, Dorne JL, Gosling JP, Heringa MB, Klaric M, Kliment T, et al. 2019. Next generation physiologically based kinetic (NG-PBK) models in support of regulatory decision making. Comput Toxicol. 9:61–72.
- Plugge H, Jaeger RJ. 1979. Acute inhalation of 2-chloro-1,3-butadiene (chloroprene): effects on liver and lung. Toxicol Appl Pharmacol. 50(3):565–572.
- Ramsey JC, Andersen ME. 1984. A physiological model for the inhalation pharmacokinetics of inhaled styrene monomer in rats and humans. Toxicol Appl Pharmacol. 73(1):159–175.
- Rostami-Hodjegan A. 2012. Physiologically based pharmacokinetics joined with in vitro-in vivo extrapolation of ADME: a marriage under the arch of systems pharmacology. Clin Pharmacol Ther. 92(1):50–61.
- Schlosser PM, Bond JA, Medinsky MA. 1993. Benzene and phenol metabolism by mouse and rat liver microsomes. Carcinogenesis. 14(12):2477–2486.
- Scotcher D, Billington S, Brown J, Jones CR, Brown CDA, Rostami-Hodjegan A, Galetin A. 2017. Microsomal and cytosolic scaling factors in dog and human kidney cortex and application for in vitro-in vivo extrapolation of renal metabolic clearance. Drug Metab Dispos. 45(5):556–568.
- Simmonds A C, Reilly C A, Baldwin R M, Ghanayem B I, Lanza DL, Yost G S, Collins K S, Forkert P G. 2004. Bioactivation of 1,1-dichloroethylene to its epoxide by CYP2E1 and CYP2F enzymes. Drug Metab Dispos. 32(9):1032–1039.
- Sutherland KM, Edwards PC, Combs TJ, Van Winkle LS. 2012. Sex differences in the development of airway epithelial tolerance to naphthalene. Am J Physiol Lung Cell Mol Physiol. 302(1):L68–81.
- Thomas RS, Himmelstein MW, Clewell HJ, 3rd, Yang Y, Healy E, Black MB, Andersen ME. 2013. Cross-species transcriptomic analysis of mouse and rat lung exposed to chloroprene. Toxicol Sci. 131(2):629–640.
- USEPA (Environmental Protection Agency). 2000. Vinyl Chloride: CASRN 75-01-4. Integrated Risk Information System (IRIS): chemical assessment summary. U.S. Environmental Protection Agency; National Center for Environmental Assessment. https://cfpub.epa.gov/ncea/iris/iris_documents/documents/subst/1001_summary.pdf.
- USEPA (Environmental Protection Agency). 2010. Toxicological review of chloroprene (CAS No. 126. p. 99–98). In support of summary information on the Integrated Risk Information System (IRIS). Washington (DC): U.S. Environmental Protection Agency. https://cfpub.epa.gov/ncea/iris/iris_documents/documents/toxreviews/0070tr.pdf.
- USEPA (Environmental Protection Agency). 2011. Dichloromethane: CASRN 75-09-2. Integrated Risk Information System (IRIS): chemical assessment summary. U.S. Environmental Protection Agency; National Center for Environmental Assessment. https://cfpub.epa.gov/ncea/iris/iris_documents/documents/subst/0070_summary.pdf
- Van Winkle LS, Gunderson AD, Shimizu JA, Baker GL, Brown CD. 2002. Gender differences in naphthalene metabolism and naphthalene-induced acute lung injury. Am J Physiol. 282(5):L1122–L1134.
- Wambaugh JF, Wetmore BA, Pearce R, Strope C, Goldsmith R, Sluka JP, Sedykh A, Tropsha A, Bosgra S, Shah I, et al. 2015. Toxicokinetic triage for environmental chemicals. Toxicol Sci. 147(1):55–67.
- Wetmore BA, Wambaugh JF, Allen B, Ferguson SS, Sochaski MA, Setzer RW, Houck KA, Strope CL, Cantwell K, Judson RS, et al. 2015. Incorporating high-throughput exposure predictions with dosimetry-adjusted in vitro bioactivity to inform chemical toxicity testing. Toxicol Sci. 148(1):121–136.
- World Health Organization/International Programme on Chemical Safety (WHO/IPCS). 2010. Characterization and application of physiologically based pharmacokinetic models in risk assessment. Harmonization Project Document No. 9. Geneva, Switzerland.
- Wilson EC. 2015. A practical guide to value of information analysis. Pharmacoeconomics. 33(2):105–121.
- Yamada T, Kondo M, Miyata K, Ogata K, Kushida M, Sumida K, Kawamura S, Osimitz TG, Lake BG, Cohen SM. 2017. An evaluation of the human relevance of the lung tumors observed in female mice treated with permethrin based on mode of action. Toxicol Sci. 157(2):465–486.
- Yang Y, Himmelstein MW, Clewell HJ. 2012. Kinetic modeling of b-chloroprene metabolism: probabilistic in vitro–in vivo extrapolation of metabolism in the lung, liver and kidneys of mice, rats and humans. Toxicol in Vitro. 26(6):1047–1055.
- Yoon M, Campbell JL, Andersen ME, Clewell HJ. 2012. Quantitative in vitro to in vivo extrapolation of cell-based toxicity assay results. Crit Rev Toxicol. 42(8):633–652.
- Yoon M, Madden MC, Barton HA. 2007. Extrahepatic metabolism by CYP2E1 in PBPK modeling of lipophilic volatile organic chemicals: impacts on metabolic parameter estimation and prediction of dose metrics. J Toxicol Environ Health A. 70(18):1527–1541.