
 ?Mathematical formulae have been encoded as MathML and are displayed in this HTML version using MathJax in order to improve their display. Uncheck the box to turn MathJax off. This feature requires Javascript. Click on a formula to zoom.
Abstract
Background
We are currently screening human volunteers to determine their sputum polymorphonuclear neutrophil (PMN) response 6- and 24-hours following initiation of exposure to wood smoke particles (WSP). Inflammatory responders (≥10% increase in %PMN) are identified for their subsequent participation in mitigation studies against WSP-induced airways inflammation. In this report we compared responder status (N = 52) at both 6 and 24 hr time points to refine/expand its classification, assessed the impact of the GSTM1 genotype, asthma status and sex on responder status, and explored whether sputum soluble phase markers of inflammation correlate with PMN responsiveness to WSP.
Results
Six-hour responders tended to be 24-hour responders and vice versa, but 24-hour responders also had significantly increased IL-1beta, IL-6, IL-8 at 24 hours post WSP exposure. The GSTM1 null genotype significantly (p < 0.05) enhanced the %PMN response by 24% in the 24-hour responders and not at all in the 6 hours responders. Asthma status enhanced the 24 hour %PMN response in the 6- and 24-hour responders. In the entire cohort (not stratified by responder status), we found a significant, but very small decrease in FVC and systolic blood pressure immediately following WSP exposure and sputum %PMNs were significantly increased and associated with sputum inflammatory markers (IL-1beta, IL-6, IL-8, and PMN/mg) at 24 but not 6 hours post exposure. Blood endpoints in the entire cohort showed a significant increase in %PMN and PMN/mg at 6 but not 24 hours. Sex had no effect on %PMN response.
Conclusions
The 24-hour time point was more informative than the 6-hour time point in optimally and expansively defining airway inflammatory responsiveness to WSP exposure. GSTM1 and asthma status are significant effect modifiers of this response. These study design and subject parameters should be considered before enrolling volunteers for proof-of-concept WSP mitigation studies.
Introduction
Wood smoke particles (WSP) produced by combustion of biomass contribute to both household and ambient air pollution with fine particulate matter (particulate matter 2.5-microns in diameter or less or PM2.5) (Schwartz et al. Citation2020; Aguilera et al. Citation2021). Increased levels of WSP are associated with exacerbations of asthma (Kodgule and Salvi Citation2012; Laumbach and Kipen Citation2012), pneumonia (Smith et al. Citation2011; Cascio Citation2018), chronic obstructive pulmonary disease (Rappold et al. Citation2011; Thurston et al. Citation2020; Rice et al. Citation2021) and cardiovascular morbidity (Cascio Citation2018; Wettstein et al. Citation2018; Jones et al. Citation2020). Household WSP can reach levels well over 1000 µg/m3 (Naeher et al. Citation2000), and WSP from wildfires are an increasingly important source of ambient air PM2.5 in the US airshed, and account for a disproportionally high number of hospitalizations compared to PM2.5 from other sources (Aguilera et al. Citation2021). Wildfires often abruptly produce ambient air PM2.5 levels >190 µg/m3 (Cleland et al. Citation2020), with firefighters often exposed to levels >1,000 µg/m3 (Adetona et al. Citation2011; Navarro Citation2020). Inhalation of WSP results in an inflammatory response in the airway, which is a central mechanism for WSP related morbidity (Steerenberg et al. Citation2006; Allen et al. Citation2008; Swiston et al. Citation2008; Ghio et al. Citation2012; Burbank et al. Citation2019; Rebuli et al. Citation2019). We are currently undertaking proof of concept clinical trials of interventions to mitigate the effect of WSP on airway inflammation.
This report documents the response of 52 volunteers, which includes 12 persons with asthma who have undergone our open-label phase I screening WSP protocol to identify those who are responsive to the inflammatory action of WSP 6 and 24 hours after controlled exposure to 500 µg/m3. We include analysis of sputum PMN and inflammatory cytokines, circulating cytokines and leukocyte counts, forced vital capacity (FVC), forced expiratory volume at 1 second (FEV1), heart rate, and blood pressure. We also analyzed GSTM1 status, asthma and sex as potential effect modifiers of the WSP-induced inflammatory response.
The overarching goal of the current study is to characterize the inflammatory response to WSP at 6- and 24-hours post exposure and undertake initial assessment of potential effect modifiers of this response, such as the glutathione-S-Transferase Mu1 (GSTM1) genotype and asthma status, where in the case of the former, multiple reports demonstrate that persons with the homozygous null genotype for GSTM1 (GSTM1 null) have increased inflammatory responsiveness to O3 and other pollutants (Gilliland et al. Citation2004, Citation2006; Alexis et al. Citation2009; Hernandez et al. Citation2010; Kim et al. Citation2011; Hernandez et al. Citation2012; Wu et al. Citation2012; Alexis et al. Citation2013). In the case of asthma, we have shown that it too is a determinant of the inflammatory response to O3 (Hernandez et al. Citation2010), hence we hypothesize that these effect modifiers may play a similar role with WSP. In this report, we expand upon our recent preliminary report of 27 volunteers who had completed a WSP screening protocol, where we observed that 67% of healthy volunteers were inflammatory responders, and that the GSTM1 null genotype appeared to increase inflammatory response to WSP as observed 24 hours after challenge (Burbank et al. Citation2019).
Methods
A total of 52 subjects (26 male, 40 healthy, 12 asthmatics), aged 18–45 years completed the WSP screening protocol (, subject demographics). All subjects were nonsmokers with no acute respiratory illness in the prior 4 weeks, and no current allergic rhinitis symptoms. Healthy volunteers were required to have a FEV1 of >80% of predicted, persons with asthma were required to have a FEV1 of ≥75% predicted while off any bronchodilator. Only healthy volunteers and persons with mild to moderate asthma were recruited. Asthma was defined by a history of episodic wheezing, chest tightness, or shortness of breath consistent with asthma, or physician diagnosed asthma and confirmed with a post-bronchodilator increase in FEV1 of at least 12%, or a clinical history of asthma after the age of 6. If persons with asthma used controller therapy (e.g. inhaled corticosteroids), they had to withhold this therapy for 2 weeks prior to WSP exposure. Persons requiring oral corticosteroid or biologic controller therapy were excluded. All asthmatics were also required to have either a positive skin test for aeroallergens present in North Carolina or a history of seasonal rhinitis symptoms. Volunteers were excluded if they had abnormal physical findings at the baseline visit, including but not limited to abnormalities on auscultation, temperature of 37.8° C, Systolic BP >150 mm Hg or <85 mm Hg; or Diastolic BP >90 mm Hg or <50 mm Hg, or pulse oximetry saturation reading less than 94%.
Table 1. Subject demographics.
Fifty subjects provided at least one sputum sample; 47 (35 healthy; 12 asthmatics) provided matched baseline and 6-hour timepoint sputum samples; and 41 (30 healthy; 11 asthmatics) provided matched baseline and 24-hour timepoint sputum samples. The GSTM1 genotype was determined by buccal swab analysis using methods previously described (Alexis et al. Citation2009). Twenty subjects were GSTM1 null, twenty-six were GSTM1 sufficient, with six refusing GSTM1 genotyping. Written consent was obtained from all participants. The study was approved by the University of North Carolina Institutional Review Board and listed in ClinicalTrials.gov (NCT02767973)
Details of the WSP exposure protocol are described previously (Ghio et al. Citation2012; Burbank et al. Citation2019). In brief, baseline induced sputum samples were obtained prior to the WSP chamber visit and at 6 and 24 hours following WSP exposure. The WSP chamber used wood smoke generated by heating red oak wood on an electric heating element. Subjects were exposed to 500 μg/m3 WSP over a 2-hour period with alternating 15-minute periods of rest and exercise on a cycle ergometer at a level sufficient to produce a minute ventilation of 20 L/min/m2 body surface area. Induced sputum was collected and processed according to previously published methods (Lay et al. Citation2011; Alexis et al. Citation2014). The primary endpoints were sputum percent neutrophils (%PMNs) at 6- and 24-hours post- initiation of the WSP exposure compared to baseline samples. Consistent with previous studies at our center, inflammatory responders were defined as those who experienced a ≥ 10 percentage point increase in sputum %PMN (Alexis et al. Citation2008; Fry et al. Citation2012; Alexis et al. Citation2013; Fry et al. Citation2014). In brief, subjects underwent sputum induction with 3 7 minute periods of hypertonic saline inhalation (21 total minutes, 3%,4%,5%). Sputum samples were expectorated into sterile specimen cups, kept on ice and processed immediately following collection. Plug selection was performed on raw samples and plug material treated was treated with DPBS (8 × wt), homogenized on a rotating tumbler (15 minutes, RT), centrifuged and cell free supernatants captured and stored at −80 deg C. Cell pellets were treated with 0.1% DTT (15 minutes, RT), filtered and cell counts and viability assessed using hemacytometry. Cytospin slides were prepared, and stained with Hema 3 stain and differentially read under light microscopy. Measures of lung function (spirometry), cardiovascular status (blood pressure, heart rate) sputum soluble markers and serum inflammatory markers were also recorded at baseline and 6- and 24-hour post WSP exposure time points.
Statistical analyses
To assess the effect of GSTM1, Asthma and sex on sputum inflammatory measures, we assessed the sputum outcomes of interest measured at baseline and 6 and 24 hours after exposure commenced. To investigate if WSP had an effect on subjects, for endpoint X, we used the ratio, defined as For instance,
For the form of the outcome variable, we also considered the differences from the baseline, as well as various transformations, e.g. log transformation. For modeling, we selected the ratio form of our outcomes based on the QQ plots to assess the model assumptions (Team RC Citation2019). The hypothesis test for WSP effect is to test whether the ratio is statistically different from 1. We fit the following regression model,
where
is the response variable, and
is the intercept. The p-value for testing
is equivalent of testing
i.e. if there is a significant change in outcome at post exposure from pre-exposure.
We then employed the regression model to examine whether GSTM1 status, Asthma status or sex had a significant effect on the ratio of interest. We fit the following model,
where
is the covariate of interest. For GSTM1 status, we will use GSTM1-Null (GSTM1-) as the reference group (
. For Asthma status, we will use Healthy as the reference group (
The p-value for
tests whether
i.e. if there is a significant change in the outcome between the covariate levels. We fit the models using lm () in R 3.6.1 (Team RC Citation2019).
We also compared the effect of WSP exposure 6 and 24 hours after beginning the 2-hour exposure challenge to baseline lung function, sputum, and blood measures. We analyzed these data by fitting a mixed model as implemented in GraphPad Prism 8.0. This mixed model uses a compound symmetry covariance matrix and is fit using Restricted Maximum Likelihood (REML). Paired t-test analysis was used to compare spirometry and blood pressure outcomes at baseline and immediately after WSP exposure.
Results
The primary endpoints for this study were identification of persons with at least a 10%-point increase in the percentage of sputum PMNs (%PMN) at 6- and 24-hours post WSP challenge compared to that at pre-exposure baseline, and the effect of the GSTM1 null genotype on responder status. Additional endpoints assessed the impact of asthma status and sex on 6 and 24 hour-responder statuses, the correlation between sputum soluble phase markers of inflammation (IL-1β, IL-6, IL-8, TNFα) and 6 and 24 hour %PMN responses and the effect of WSP exposure on lung function (spirometry) and cardiovascular (systolic and diastolic blood pressure, heart rate) outcomes.
Historic baseline vs. Air challenge control measures in sputum
As the goal of this screening protocol is to identify persons who are responsive to the inflammatory effect of WSP for subsequent entry into an intervention study, we chose to compare post WSP exposure responses to a pre-exposure baseline, rather than undertake an additional clean air control challenge. In support of this approach, we pooled our own historical data from several air control chamber challenges previously undertaken that involved 2–3 hours of exercise like that employed for this WSP challenge (NCT00840528, NCT00839943, NCT03395119 (Bennett et al. Citation2016; Lay et al. Citation2007)). At pre air challenge baseline, the %PMN in sputum was 31.7 ± 3.0% (mean, SEM, n = 66) vs. 29.4 ± 2.9% (n = 68) at 6 hours post air challenge and 37.0 ± 8.0% (n = 10) at 24 hours post air challenge (p = 0.7). The pre-WSP baseline value was 33.2 ± 3.2% PMNs (n = 50) and was not statistically different (p = 0.72) from the baseline, 6 h or 24 h historic clean air exposure time point values. It has also been reported that FVC and FEV1 following an air control session are unchanged or increase slightly. These observations support using pre-exposure baseline measures without an air exposure control visit to lower subject burden and increase efficiency for screening responsive volunteers for enrollment into intervention studies.
Endpoints for the entire cohort
As of April of 2020 (the date at which the protocol was paused due to the COVID-19 pandemic), 52 volunteers had completed this WSP screening protocol. outlines the demographics of these volunteers. Of 52 subjects, 50 provided at least one sputum sample, with 47 (35 Healthy volunteers and 12 with Asthma) providing matched baseline and 6-hour timepoint sputum samples. Forty-one (30 Healthy volunteers and 11 with Asthma) subjects were able to provide matched baseline and 24-hour timepoint samples.
Response of all 52 unstratified volunteers
depicts the sputum % PMN and soluble phase inflammatory mediators 6 and 24 hours post WSP challenge of the entire cohort which was not defined by responder status. As shown, only the %PMNs in sputum () are significantly increased by WSP 24 hours after exposure. PMN/mg sputum and sputum levels of IL-1β, IL-6, IL-8 and TNFα (, panels B-F respectively) were unchanged by WSP 6- or 24-hours post exposure. We compared % change in %PMN at 6 hours to that observed at 24 hours in 39 volunteers who had these results at both timepoints. In this group, there was correlation of r = 0.85, p < 0.05 between the %PMN responses at both time points.
Figure 1. Sputum inflammatory response to WSP of the entire cohort.
Sputum % PMN (Panel A), PMN/mg sputum (Panel B), IL-1β (Panel C), IL-6 (Panel D), IL-8 (Panel E) and TNFα (Panel F) at baseline, 6- and 24-hours post WSP challenge in the total unstratified cohort. Asterisk denotes mixed model analysis using a compound symmetry covariance matrix where fit used Restricted Maximum Likelihood (REML) to allow for overall and multiple comparisons and missing data.
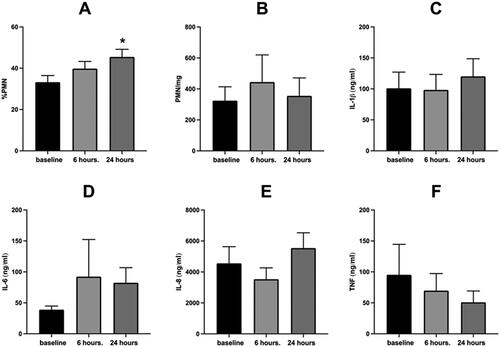
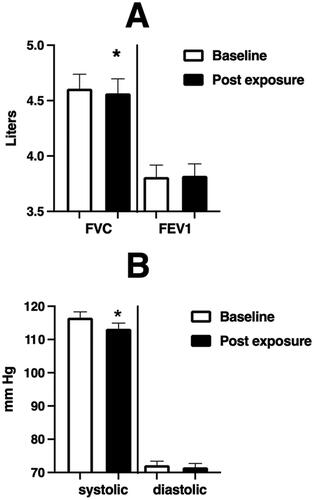
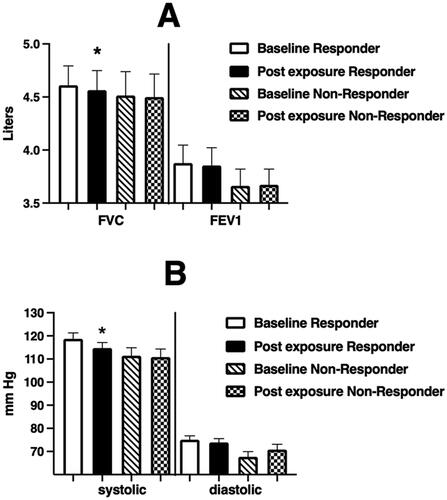
Figure 2. Spirometric and blood pressure endpoints at baseline and immediately after WSP challenge of the entire unstratified cohort.
Spirometric and blood pressure endpoints at baseline and immediately after WSP challenge in the total unstratified cohort. Asterisk denotes paired t-test.
We also assessed the correlation between the change from baseline of sputum %PMNs at 6 and 24 hours with the corresponding change from baseline (expressed as %change) of the PMN/mg sputum and sputum levels of IL-1β, IL-6, IL-8 and TNFα using Spearman’s Rank Correlation. Only one significant correlation was found at 6 hours (PMN/mg, r = 0.35, p = 0.02, n = 47). However, at 24 hours post exposure there were several significant correlations between %PMNs and other inflammatory endpoints in sputum, including IL-1β (r = 0.39, p = 0.02, n = 36), IL-6 (r = 0.36, p = 0.04, n = 34), IL-8 (r = 0.37, p = 0.02, n = 37) as well as PMN/mg sputum (r = 0.6, p = 0.01, n = 41) ().
Table 2. Correlative analysis for inflammatory biomarkers.
depicts the immediate effect of WSP exposure on FVC (left panel)), FEV1 (Right Panel)) and systolic and diastolic blood pressure () within the overall cohort. We observe a small but significant decrease in FVC and systolic blood pressure.
We also examined the relationship between change from baseline in sputum %PMN and PMN/mg sputum at 6 and 24 hours with % change from baseline in FVC, FEV1, systolic and diastolic blood pressure. Of these relationships, the only significant finding (p < 0.05) was between the %change in PMN/mg sputum at 24 hours and % change in FVC (r = −0.36); we did observe a trend (p < 0.1) between PMN/mg sputum at 24 hours and % change in FEV1 (r = –031).
We also measured blood endpoints from volunteers at 6- and 24-hours post WSP exposure (). These included circulating levels of PMNs (cells/uL), the PMN differential count (expressed as percent of total nucleated cells), and levels of IL-1β, IL-6, IL-8 and TNFα and C-reactive protein (CRP). The % PMN and PMN/uL levels were significantly (p < 0.05) increased above baseline at 6 hours, but not 24 hours. All other measures were unchanged in volunteers stratified by the %PMN response at 6 and 24 hours.
Table 3. Systemic Endpoints of the Entire Cohort at 6 and 24 hours Post WSP Exposure.
Endpoints of responders stratified on the basis of the 6-hour %PMN sputum response
Forty-seven volunteers provided sputum samples at baseline and six hours after initiation of WSP challenge. Of these volunteers, 30 (64%) were responsive to WSP, as defined by a ≥10% point increase in sputum %PMNs. Of the 30 responders based on 6-hour sputum analysis, 23 also had 24-hour sputum data, of which 20 remained responsive (87%). depicts the airway inflammatory response (cells and soluble phase mediators) to WSP of 6 hour responders (N = 30). On average, 6-hour responders had significantly (p < 0.05) increased %PMN responses at 24 hours, but no other inflammatory endpoints demonstrated this effect. When stratified on the basis of sputum inflammatory response (%PMN) at 6 hours, we again found a modest decrease in FVC and systolic blood pressure only in responsive volunteers (). Stratification of systemic inflammatory endpoints on the basis of individual PMN responsiveness at 6 hours in sputum did not modify these responses (data not shown).
Figure 3. Sputum Inflammatory Response to WSP of responsive volunteers as defined by %PMNs at 6 hours.
Sputum % PMN (Panel A), PMN/mg sputum (Panel B), IL-1β (Panel C), IL-6 (Panel D), IL-8 (Panel E) and TNFα (Panel F) at baseline, 6- and 24-hours post WSP challenge in the cohort of volunteers responsive to WSP based on a change from baseline of the 6-hour %PMN of at least 10% (N = 30). Asterisk denotes mixed model analysis using a compound symmetry covariance matrix where fit used Restricted Maximum Likelihood (REML) to allow for overall and multiple comparisons and missing data.
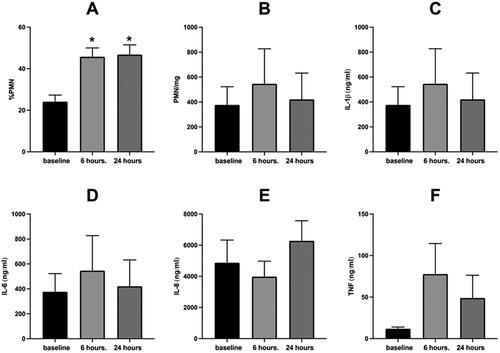
Figure 4. Spirometric (Panel A) and blood pressure (Panel B) endpoints at baseline and immediately after WSP challenge of responsive volunteers as defined by %PMNs at 6 hours.
Spirometric and blood pressure endpoints at baseline and immediately after WSP challenge in responders and non-responders defined at 6 hours. Asterisk denotes paired t-test test.
Endpoints of responders stratified on the basis of the 24-hour %PMN sputum response
Forty-one volunteers provided sputum samples at baseline and 24 hours after initiation of WSP challenge. Of these volunteers, 28 (68%) were responsive to WSP, as defined by a ≥10% increase in sputum %PMNs. Of the 28 24-hour responders, 26 provided an adequate sputum sample at 6 hours as well, with 21 of those (81%) being responsive at 6 hours. depicts the airway inflammatory response (cells and soluble phase mediators) to WSP of 24-hour responders (N = 28). The 24-hour responders had significantly increased %PMN and PMN/mg responses at both 24 and 6 hours. Interestingly, and unlike 6-hour responders, 24-hour responders showed significantly increased levels of several pro-inflammatory mediators in sputum at 24 hours post WSP exposure (IL-1β, IL-6, IL-8). We also observed a decrease in FVC and systolic blood pressure immediately after WSP challenge in persons who demonstrated a sputum inflammatory response at 24 hours post challenge (). Systemic endpoints were again similar when stratified based on airway response at 24 hours (data not shown).
Figure 5. Sputum Inflammatory Response to WSP of responsive volunteers as defined by %PMNs at 24 hours.
Sputum % PMN (Panel A), PMN/mg sputum (Panel B), IL-1β (Panel C), IL-6 (Panel D), IL-8 (Panel E) and TNFα (Panel F) at baseline, 6- and 24-hours post WSP challenge in the cohort of volunteers responsive to WSP based on a change from baseline of the 24-hours %PMN of at least 10% (N = 28). Asterisk denotes mixed model analysis using a compound symmetry covariance matrix where fit used Restricted Maximum Likelihood (REML) to allow for overall and multiple comparisons and missing data.
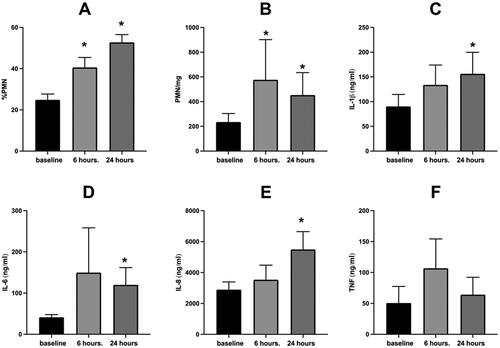
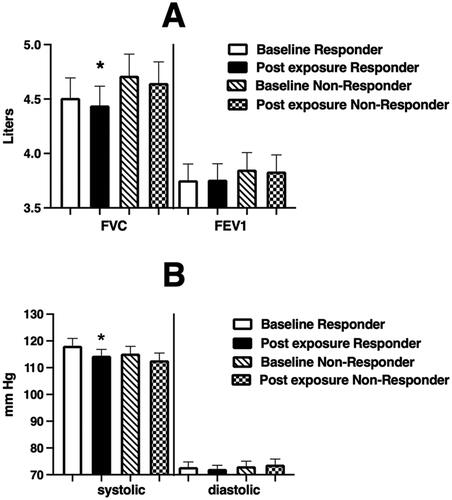
Figure 6. Spirometric (Panel A) and blood pressure (Panel B) endpoints at baseline and immediately after WSP challenge of responsive volunteers as defined by %PMNs at 24 hours.
Spirometric and blood pressure endpoints at baseline and immediately after WSP challenge in responders and non-responders defined at 24 hours. Asterisk denotes paired t-test.
Effect of GSTM1 genotype, asthma status and sex on the airway inflammatory response to WSP
We assessed the role of GSTM1 genotype, asthma status and sex on the sputum %PMN, PMN/mg sputum and sputum IL-1β, IL-6, IL-8 and TNFα response to WSP at 6 and 24 hours using the entire cohort, the 6-hour responder cohort and the 24-hour responder cohort. We used linear regression modeling approaches in which a given response was expressed as % of baseline, where, as our main response variable, with a responder defined as R ≥ 1.1 (equivalent to a 10% increase from baseline in %PMN). For instance,
To determine if there is a difference in post baseline versus baseline, we first fit an intercept only model, where the response is defined as
Thus, the hypothesis test for WSP effect is equivalent to testing whether the ratio is statistically different from 1, or equivalently, a t-test to test if
in an intercept only model. We next expanded our regression model to examine if there are any differences in the ratio between the status of GSTM1, Asthmatics, and responder status. We also fit the regression model to allow for other covariates of interest that might influence the response variable, as described fully in Methods.
We found that the GSTM1 null genotype significantly (p < 0.05) enhanced only the %PMN variable. When we consider the entire unstratified (responders and non-responders) cohort, the GSTM1 sufficient genotype was associated with significantly (p < 0.05) decreased %PMN at 6 hours (β1±SE = −0.514 ± 0.310), but not 24 hours after challenge. In the group stratified on the basis of sputum %PMN at 6 hours, the GSTM1 genotype had no impact on %PMNs at either 6 or 24 hours within that group. In the group stratified on the basis of sputum %PMN at 24 hours (only persons responsive at 24 hours post challenge), the GSTM1 sufficient genotype was associated with significantly decreased %PMNs at 24 hours (β1±SE = −1.160 ± 0.536). Thus, the GSTM1 sufficient genotype protected volunteers from increased sputum %PMN after WSP challenge.
We also observed that having asthma increased the %PMN response to WSP exposure 24 hours after exposure. This was true when assessed across the overall cohort (β1±SE = 1.170 ± 0.501), as well as those defined as responsive at 6 hours (β1±SE = 1.587 ± 0.636), and 24 hours (β1±SE = 1.215 ± 0.533), We did not observe an effect of sex on response to WSP exposure for the endpoints we assessed. These factors had no effect on any of the other inflammatory outcomes (data not shown).
Discussion
This protocol was developed to screen and identify volunteers who demonstrate inflammatory responsiveness to WSP for their entry into subsequent early phase studies of candidate mitigation interventions for WSP-induced airways inflammation. This approach was modeled on screening protocols developed by Holz, et al (Holz et al. Citation2005) and employed by our group (Alexis et al. Citation2008) to identify inflammatory responders, that is, persons who had a >10% increase in sputum neutrophils (PMN) post O3 for recruitment into studies evaluating anti-inflammatory interventions for O3. These placebo-controlled studies of recruited O3 inflammatory responders demonstrated that inhaled fluticasone (Holz et al. Citation2005; Alexis et al. Citation2008) and oral prednisolone (Holz et al. Citation2005) reduced O3 induced airway inflammation. The advantage of excluding non-responsive volunteers from these intervention studies, was to improve study efficiency and eliminate uninformative data from O3 non-responsive volunteers. Indeed, similar O3 screening protocols have reported that two CXCR2 antagonists (SCH527123 and SB-656933) (Holz et al. Citation2010; Lazaar et al. Citation2011) reduced O3-induced airway inflammation, whereas secukinmab (an anti-IL-17A antibody) (Kirsten et al. Citation2013) did not impact this response.
Previous O3 screening studies also examined effect modifiers of the O3 response in inflammatory responders and non-responders. We showed that volunteers with the GSTM1 null genotype had a 13-fold increased likelihood of having a >10% increase in sputum PMN following exposure to 0.06 ppm O3 for 6 hours (Alexis et al. Citation2013) or 0.4 ppm O3 for 2 hours (Alexis et al. Citation2009). Interestingly, Asthmatics revealed increased sputum PMN, levels of IL-1beta, IL-6 and IL-8, as well as enhanced gene expression of innate immune genes and sputum macrophage expression of TLR4 (Hernandez et al. Citation2010). These O3 studies indicated that the GSTM1 null genotype and asthma status were associated with increased inflammatory response 24 hours following exposure to O3, and therefore were examined as potential modulators of response to WSP exposure in this analysis.
Based on our previous O3 studies we chose to examine %PMN in sputum obtained both at 6 and 24 hours after initiation of a 2-hour WSP exposure to determine which time point might be optimal and most informative for the purpose of a mitigation screening protocol.
Analysis of the 6-hour sputum identified 64% of our volunteers as responders, while analysis of the 24-hour sputum samples identified 68% of our volunteers as responders. We also observed that there is a correlation of r = 0.85, p < 0.05 between the 6 and 24 hour responses. When we focused our analyses on volunteers defined as responders based on the 6-hour sputum sample that also had an adequate 24-hour sample, we observed that 87% of these 6-hour responders remained responsive at 24 hours. When we examined volunteers defined as responders based on the 24-hour sputum sample that also had an adequate 6-hour sample, we observed that 81% of the 24-hour responders had been responsive at 6 hours. Thus, overall, for the purpose of identifying responsive volunteers, we observed relatively consistent agreement between assessments made 6 and 24 hours after initiation of WSP exposure.
When we reviewed the sputum data of the overall unstratified cohort for a more complete assessment of airway inflammation, we found that only the sputum %PMN was significantly elevated at 24 hours after WSP exposure. Neither the absolute sputum PMN measure (PMN/mg sputum) nor the soluble phase cytokines were increased above baseline levels.
Circulating PMN cell counts were increased at 6, but not 24 hours. When we reviewed the cohort defined by responsiveness reflected in %PMN in airway sputum at 6 hours post exposure, we observed that both the %PMN at 6 and 24 hours was significantly increased, with no increase in the quantitative sputum PMN measure (PMN/mg sputum) or the soluble phase cytokines. In both the overall cohort and the 6 hours responsive cohort, the FVC and systolic blood pressure were slightly decreased immediately after challenge.
Interestingly, we observed a more expansive airway inflammatory response in the cohort stratified on the %PMN in airway sputum 24 hours post WSP challenge. The %PMNs were significantly increased over baseline, as one would expect based on the definition of the cohort. However, unlike our observations in the overall and 6-hour responsive group, we observed that PMN/mg, IL-1β, IL-6 and IL-8 were also significantly increased at 24 hours. We also explored the correlation between the % change in sputum %PMNs with the PMN/mg sputum, of IL-1β, IL-6, IL-8 and TNFα in the total unstratified cohort at 6- and 24-hours post WSP challenge. At 6 hours, the %PMNs correlated only with the PMN/mg sputum, whereas at 24 hours the % change in sputum %PMNs correlated with the PMN/mg sputum, and several pro-inflammatory cytokines, IL-1β, IL-6, and IL-8. Overall, these observations suggest that inflammatory biomarkers present 24 hours after challenge more robustly reflect the inflammatory response to WSP challenge than do those present 6 hours after challenge.
We also examined the effect of 500 µg/m3 WSP on lung function and blood pressure responses of exposed volunteers. Intriguingly, we observed mild decreases in FVC and in systolic blood pressure in the overall cohort. When the cohort was stratified on the basis of sputum %PMN at 6 and 24 hours, we found that this effect was only observed in the PMN responsive populations, suggesting that perhaps inflammation plays a role in these additional effects of WSP. This is different than what has been reported for O3, in which the effect of O3 on lung function does not relate to development of an airways inflammatory response (Bromberg and Koren Citation1995; Alexis et al. Citation2009).
As we had previously observed that the GSTM1 and asthma genotype modified inflammatory response to O3, we explored if these factors modified inflammatory response to WSP as well. When we examined the effect of WSP on sputum %PMNs, we found that GSTM1 and asthma significantly modified airway inflammatory response to WSP. This effect was most consistent in the cohort defined by responsiveness 24 hours after initiation of the controlled exposure, which is also when the inflammatory response to WSP was the most defined across a number of biomarkers.
There are important limitations to this screening protocol. Because the protocol is intended to identify responsive volunteers, we chose not to undertake a clean air control exposure. This is similar to our approach to identify response characteristics to O3. In establishing that protocol, we compared sputum PMN content at baseline and after a clean air exposure and found no difference in those measures (Lay et al. Citation2007). We also reviewed sputum data from a number of clean air exposures undertaken in studies of O3 which were using similar exposure duration exercise regimens and compared these outcomes to baseline values from our WSP cohort. We found no significant difference between these historic clean air exposures and the current baseline sputum %PMNs. Thus, at least for inflammatory endpoints in sputum, we did not feel that it was essential to employ an air exposure to identify WSP responsive volunteers. We also focused on one level of WSP exposure, and it is possible that the impact of asthma, GSTM1 or other potential biological determinants of response might be more apparent with different doses of WSP.
Despite these limitations, our studies with O3 and the data presented here on WSP suggest that screening protocols developed to identify responders to air pollutants such as WSP comparing post exposure with baseline values is a relatively efficient procedure to identify volunteers for recruitment into subsequent intervention studies. These screening protocols can also be used assess candidate determinants of pollutant-induced airway inflammation and biomarkers of pollutant response. Our use of this 500 µg/m3 WSP screening protocol to identify WSP responsive volunteers has not induced adverse effects in these initial 52 volunteers. We also found that while sputum analysis at 6- and 24-hours after initiation of WSP challenge is similarly effective at identifying WSP responsive volunteers, our findings also suggest that responses observed 24 hours after initiation of challenge yield more robust biological data and is likely a more efficient and informative timepoint for exploring determinants of response to WSP.
The current study will be critical in developing and conducting early phase studies of potential personal mitigation interventions to reduce WSP-induced disease in persons unavoidably exposed to this pollutant, as well as undertaking future dose response studies of WSP exposure.
Ethics approval and consent to participate
This study (IRBIS 15-1775 titled ‘To identify persons who are susceptible to WSP-induced inflammation and examine the role of GSTM1 and other factors in this susceptibility’) was reviewed and approved by the Office of Human Research Ethics of the University of North Carolina at Chapel Hill (the UNC-CH IRB). All volunteers provided informed consent prior to participation in this study.
Consent for publication
All data are mean and standard error of the mean with no individually identifiable personal data being reported.
Author contributions
DBP conceived the study, oversaw regulatory and medical aspects of the study, and was involved in data collection, data analysis and manuscript preparation. LZ conducted statistical data analysis and contributed to manuscript preparation. AJB developed the IRB application and was involved in medical oversight of the study and data collection. MA was involved in IRB preparation and data collection. MLH was involved in medical oversight of the study and data collection in data collection. KHM was involved in IRB preparation and data collection. TLN was contributed to medical oversight of the study and data collection. HW oversaw sample processing and contributed to data collection and analysis. HZ oversaw statistical analysis of the data and contributed to manuscript preparation. NEA was involved in manuscript preparation and all aspects of sample collection, laboratory processing and analysis.
| Abbreviations | ||
| WSP | = | wood smoke particles |
| GSTM1 | = | glutathione S transferase mu 1 |
| PMN | = | polymorphonuclear neutrophil |
| FVC | = | forced vital capacity |
| FEV1 | = | forced expiratory volume in 1 second |
| IL | = | interleukin |
| TNFα | = | tumor necrosis factor alpha |
| ug/m3 | = | microgram per cubic meter |
| BMI | = | body mass index |
| ANOVA | = | analysis of variance |
| l/m2 | = | liters per square meter |
Disclosure statement
No potential conflict of interest was reported by the author(s).
Data availability statement and materials
The datasets used and/or analyzed during the current study are available from the corresponding author on reasonable request. Additionally, this study is listed in ClinicalTrials.gov (NCT02767973), and data will be posted in that database upon completion of the study. Where informed consent was given, all unused de-identified biospecimens will be stored and curated in the CEMALB Biorepository (IRB# 05-2528) for potential future use.
Additional information
Funding
References
- Adetona O, Dunn K, Hall DB, Achtemeier G, Stock A, Naeher LP. 2011. Personal PM(2.5) exposure among wildland firefighters working at prescribed forest burns in southeastern United States. J Occup Environ Hyg. 8(8):503–511.
- Aguilera R, Corringham T, Gershunov A, Benmarhnia T. 2021. Wildfire smoke impacts respiratory health more than fine particles from other sources: observational evidence from Southern California. Nat Commun. 12(1):1493.
- Alexis NE, Huang YC, Rappold AG, Kehrl H, Devlin R, Peden DB. 2014. Patients with asthma demonstrate airway inflammation after exposure to concentrated ambient particulate matter. Am J Respir Crit Care Med. 190(2):235–237.
- Alexis NE, Lay JC, Haczku A, Gong H, Linn W, Hazucha MJ, Harris B, Tal-Singer R, Peden DB. 2008. Fluticasone propionate protects against ozone-induced airway inflammation and modified immune cell activation markers in healthy volunteers. Environ Health Perspect. 116(6):799–805.
- Alexis NE, Lay JC, Zhou H, Kim CS, Hernandez ML, Kehrl H, Hazucha MJ, Devlin RB, Diaz-Sanchez D, Peden DB. 2013. The glutathione-S-transferase mu 1 (GSTM1) null genotype and increased neutrophil response to low-level ozone (0.06 ppm). J Allergy Clin Immunol. 131(2):610–612.
- Alexis NE, Zhou H, Lay JC, Harris B, Hernandez ML, Lu TS, Bromberg PA, Diaz-Sanchez D, Devlin RB, Kleeberger SR, et al. 2009. The glutathione-S-transferase Mu 1 null genotype modulates ozone-induced airway inflammation in human subjects. J Allergy Clin Immunol. 124(6):1222–1228.e5.
- Allen RW, Mar T, Koenig J, Liu LJ, Gould T, Simpson C, Larson T. 2008. Changes in lung function and airway inflammation among asthmatic children residing in a woodsmoke-impacted urban area. Inhal Toxicol. 20(4):423–433.
- Bennett WD, Ivins S, Alexis NE, Wu J, Bromberg PA, Brar SS, Travlos G, London SJ. 2016. Effect of obesity on acute ozone-induced changes in airway function, reactivity, and inflammation in adult females. PLoS One. 11(8):e0160030.
- Bromberg PA, Koren HS. 1995. Ozone-induced human respiratory dysfunction and disease. Toxicol Lett. 82–83:307–316.
- Burbank AJ, Vadlamudi A, Mills KH, Alt EM, Wells H, Zhou H, Alexis N, Hernandez ML, Peden DB. 2019. The glutathione-S-transferase mu-1 null genotype increases wood smoke-induced airway inflammation. J Allergy Clin Immunol. 143(6):2299–2302.e3.
- Cascio WE. 2018. Wildland fire smoke and human health. Sci Total Environ. 624:586–595.
- Cleland SE, West JJ, Jia Y, Reid S, Raffuse S, O’Neill S, Serre ML. 2020. Estimating wildfire smoke concentrations during the October 2017 California Fires through BME Space/time data fusion of observed, modeled, and Satellite-derived PM2.5. Environ Sci Technol. 54(21):13439–13447.
- Fry RC, Rager JE, Bauer R, Sebastian E, Peden DB, Jaspers I, Alexis NE. 2014. Air toxics and epigenetic effects: ozone altered microRNAs in the sputum of human subjects. Am J Physiol Lung Cell Mol Physiol. 306(12):L1129–37.
- Fry RC, Rager JE, Zhou H, Zou B, Brickey JW, Ting J, Lay JC, Peden DB, Alexis NE. 2012. Individuals with increased inflammatory response to ozone demonstrate muted signaling of immune cell trafficking pathways. Respir Res. 13:89.
- Ghio AJ, Soukup JM, Case M, Dailey LA, Richards J, Berntsen J, Devlin RB, Stone S, Rappold A. 2012. Exposure to wood smoke particles produces inflammation in healthy volunteers. Occup Environ Med. 69(3):170–175.
- Gilliland FD, Li YF, Gong H, Jr., Diaz-Sanchez D. 2006. Glutathione s-transferases M1 and P1 prevent aggravation of allergic responses by secondhand smoke. Am J Respir Crit Care Med. 174(12):1335–1341.
- Gilliland FD, Li YF, Saxon A, Diaz-Sanchez D. 2004. Effect of glutathione-S-transferase M1 and P1 genotypes on xenobiotic enhancement of allergic responses: randomised, placebo-controlled crossover study. Lancet. 363(9403):119–125.
- Hernandez M, Brickey WJ, Alexis NE, Fry RC, Rager JE, Zhou B, Ting JP, Zhou H, Peden DB. 2012. Airway cells from atopic asthmatic patients exposed to ozone display an enhanced innate immune gene profile. J Allergy Clin Immunol. 129(1):259–261.
- Hernandez ML, Lay JC, Harris B, Esther CR Jr., Brickey WJ, Bromberg PA, Diaz-Sanchez D, Devlin RB, Kleeberger SR, Alexis NE, et al. 2010. Atopic asthmatic subjects but not atopic subjects without asthma have enhanced inflammatory response to ozone. J Allergy Clin Immunol. 126(3):537–544.
- Holz O, Khalilieh S, Ludwig-Sengpiel A, Watz H, Stryszak P, Soni P, Tsai M, Sadeh J, Magnussen H. 2010. SCH527123, a novel CXCR2 antagonist, inhibits ozone-induced neutrophilia in healthy subjects. Eur Respir J. 35(3):564–570.
- Holz O, Tal-Singer R, Kanniess F, Simpson KJ, Gibson A, Vessey RSJ, Janicki S, Magnussen H, Jörres RA, Richter K. 2005. Validation of the human ozone challenge model as a tool for assessing anti-inflammatory drugs in early development. J Clin Pharmacol. 45(5):498–503.
- Jones CG, Rappold AG, Vargo J, Cascio WE, Kharrazi M, McNally B, Hoshiko S, with the CSG. 2020. Out-of-Hospital cardiac arrests and wildfire-related particulate matter during 2015–2017 California Wildfires. J Am Heart Assoc. 9(8):e014125.
- Kim CS, Alexis NE, Rappold AG, Kehrl H, Hazucha MJ, Lay JC, Schmitt MT, Case M, Devlin RB, Peden DB, et al. 2011. Lung function and inflammatory responses in healthy young adults exposed to 0.06 ppm Ozone for 6.6 Hours. Am J Respir Crit Care Med. 183(9):1215–1221.
- Kirsten A, Watz H, Pedersen F, Holz O, Smith R, Bruin G, Koehne-Voss S, Magnussen H, Waltz DA. 2013. The anti-IL-17A antibody secukinumab does not attenuate ozone-induced airway neutrophilia in healthy volunteers. Eur Respir J. 41(1):239–241.
- Kodgule R, Salvi S. 2012. Exposure to biomass smoke as a cause for airway disease in women and children. Curr Opin Allergy Clin Immunol. 12(1):82–90.
- Laumbach RJ, Kipen HM. 2012. Respiratory health effects of air pollution: update on biomass smoke and traffic pollution. J Allergy Clin Immunol. 129(1):3–11.
- Lay JC, Alexis NE, Kleeberger SR, Roubey RA, Harris BD, Bromberg PA, Hazucha MJ, Devlin RB, Peden DB. 2007. Ozone enhances markers of innate immunity and antigen presentation on airway monocytes in healthy individuals. J Allergy Clin Immunol. 120(3):719–722.
- Lay JC, Peden DB, Alexis NE. 2011. Flow cytometry of sputum: assessing inflammation and immune response elements in the bronchial airways. Inhal Toxicol. 23(7):392–406.
- Lazaar AL, Sweeney LE, MacDonald AJ, Alexis NE, Chen C, Tal-Singer R. 2011. SB-656933, a novel CXCR2 selective antagonist, inhibits ex vivo neutrophil activation and ozone-induced airway inflammation in humans. Br J Clin Pharmacol. 72(2):282–293.
- Naeher LP, Smith KR, Leaderer BP, Mage D, Grajeda R. 2000. Indoor and outdoor PM2.5 and CO in high- and low-density Guatemalan villages. J Expo Anal Environ Epidemiol. 10(6 Pt 1):544–551.
- Navarro K. 2020. Working in smoke: Wildfire impacts on the health of firefighters and outdoor workers and mitigation strategies. Clin Chest Med. 41(4):763–769.
- Rappold AG, Stone SL, Cascio WE, Neas LM, Kilaru VJ, Carraway MS, Szykman JJ, Ising A, Cleve WE, Meredith JT, et al. 2011. Peat bog wildfire smoke exposure in rural North Carolina is associated with cardiopulmonary emergency department visits assessed through syndromic surveillance. Environ Health Perspect. 119(10):1415–1420.
- Rebuli ME, Speen AM, Martin EM, Addo KA, Pawlak EA, Glista-Baker E, Robinette C, Zhou H, Noah TL, Jaspers I. 2019. Wood smoke exposure alters human inflammatory responses to viral infection in a sex-specific manner. A randomized, placebo-controlled study. Am J Respir Crit Care Med. 199(8):996–1007.
- Rice MB, Henderson SB, Lambert AA, Cromar KR, Hall JA, Cascio WE, Smith PG, Marsh BJ, Coefield S, Balmes JR, et al. 2021. Respiratory impacts of wildland fire smoke: future challenges and policy opportunities. An official American Thoracic Society Workshop Report. Ann Am Thorac Soc. 18(6):921–930.
- Schwartz C, Bolling AK, Carlsten C. 2020. Controlled human exposures to wood smoke: a synthesis of the evidence. Part Fibre Toxicol. 17(1):49.
- Smith KR, McCracken JP, Weber MW, Hubbard A, Jenny A, Thompson LM, Balmes J, Diaz A, Arana B, Bruce N. 2011. Effect of reduction in household air pollution on childhood pneumonia in Guatemala (RESPIRE): a randomised controlled trial. Lancet. 378(9804):1717–1726.
- Steerenberg PA, van Amelsvoort L, Lovik M, Hetland RB, Alberg T, Halatek T, Bloemen HJ, Rydzynski K, Swaen G, Schwarze P, et al. 2006. Relation between sources of particulate air pollution and biological effect parameters in samples from four European cities: an exploratory study. Inhal Toxicol. 18(5):333–346.
- Swiston JR, Davidson W, Attridge S, Li GT, Brauer M, Van Eeden SF. 2008. Wood smoke exposure induces a pulmonary and systemic inflammatory response in firefighters. Eur Respir J. 32(1):129–138.
- Team RC. 2019. R: A language and environment for statistical computing. R Foundation for Statistical Computing 2019. accessed from: https://www.r-project.org.
- Thurston GD, Balmes JR, Garcia E, Gilliland FD, Rice MB, Schikowski T, Van Winkle LS, Annesi-Maesano I, Burchard EG, Carlsten C, et al. 2020. Outdoor Air pollution and new-onset airway disease. An Official American Thoracic Society Workshop Report. Ann Am Thorac Soc. 17(4):387–398.
- Wettstein ZS, Hoshiko S, Fahimi J, Harrison RJ, Cascio WE, Rappold AG. 2018. Cardiovascular and cerebrovascular emergency department visits associated with wildfire smoke exposure in California in 2015. J Am Heart Assoc. 7(8):e007492.
- Wu W, Peden D, Diaz-Sanchez D. 2012. Role of GSTM1 in resistance to lung inflammation. Free Radic Biol Med. 53(4):721–729.